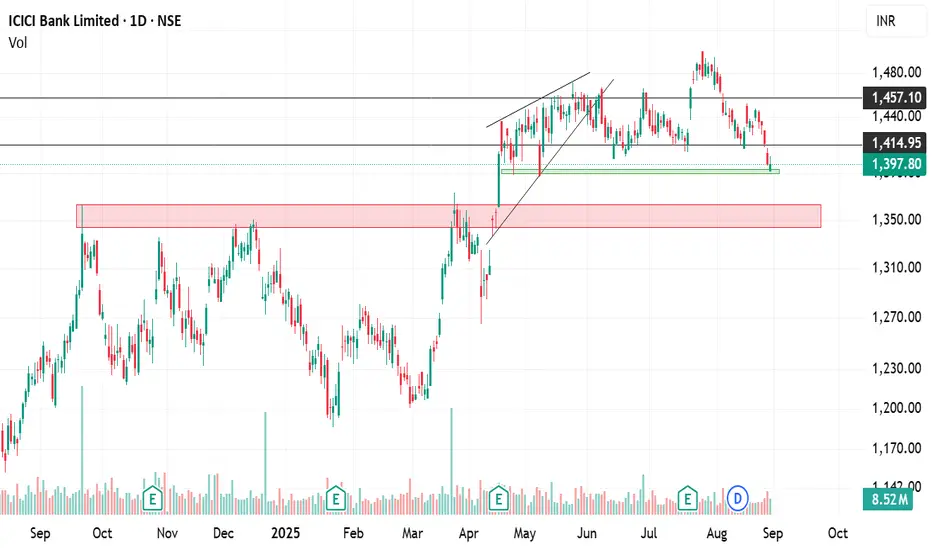
ICICI Bank Under Pressure: Breakdown Could Open ₹1,360–1,340ICICI Bank has been exhibiting persistent weakness over the past few sessions, underperforming relative to the broader market and showing clear signs of profit-booking. Despite being one of the stronger banking names in the past, the stock has recently struggled to sustain upward momentum, reflecting near-term bearish undertones.
Currently, ICICI Bank is trading around a crucial support band of ₹1,400–1,390. This zone has historically acted as a strong base, where buying interest has emerged in the past. However, repeated testing of this support without a meaningful bounce raises concerns about its sustainability.
A decisive breakdown below ₹1,390 could accelerate weakness and potentially drag the stock towards ₹1,360 and ₹1,340 levels, which are the next major support zones. These levels are important markers that could determine the medium-term trend.
On the upside, for sentiment to improve, the stock must sustain above ₹1,400–1,420 with strong volumes. Until then, caution is advised, as the undertone remains weak, and any breakdown may invite further selling pressure.
Sachinchart
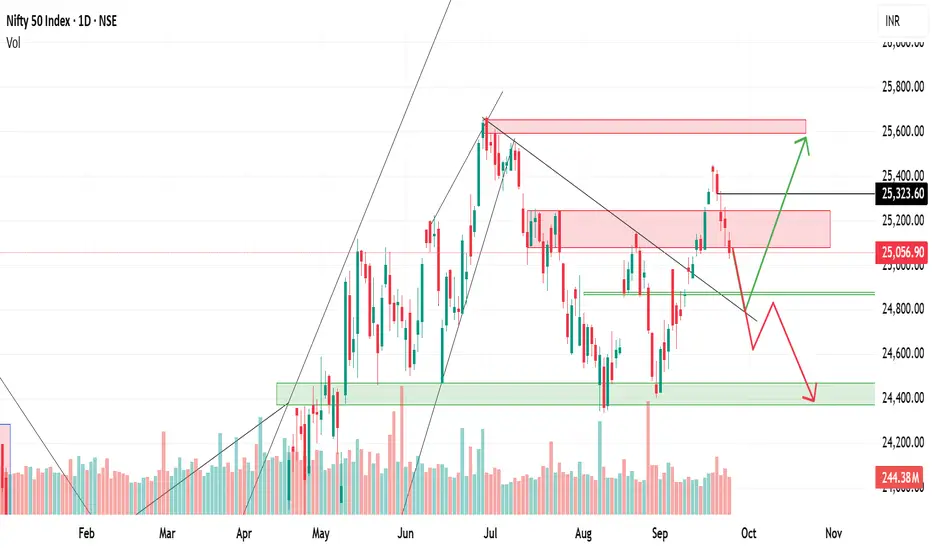
Nifty weak after failed retest – Key supports at 24,900–24,800📉 Nifty Outlook – Breakdown After Failed Retest
Nifty tried to retest the breakout zone of 25,150–25,250, but failed to hold above it. This rejection has shifted the structure towards weakness, and the index may now revisit crucial lower levels.
🔴 Failed Retest – A Bearish Signal
The zone of 25,150–25,250 was earlier acting as a breakout area. A successful retest would have confirmed strength for higher levels. However, Nifty failed to sustain, which indicates that buyers are losing control near this resistance.
📉 Next Support – Trendline Breakout Zone
The immediate support lies in the 24,900–24,800 band, which coincides with the earlier trendline breakout zone. If Nifty can stabilize here, a short-term bounce may still be possible.
⚠️ Deeper Downside Risk
If the 24,900–24,800 zone is broken on the downside, then the structure opens up for a deeper correction. In such a case, levels of 24,500–24,300 become very much possible in the coming sessions.
✅ Summary
Resistance rejected at 25,150–25,250
Weakness likely unless Nifty reclaims this zone
Supports at 24,900–24,800, below which 24,500–24,300 may come into play.
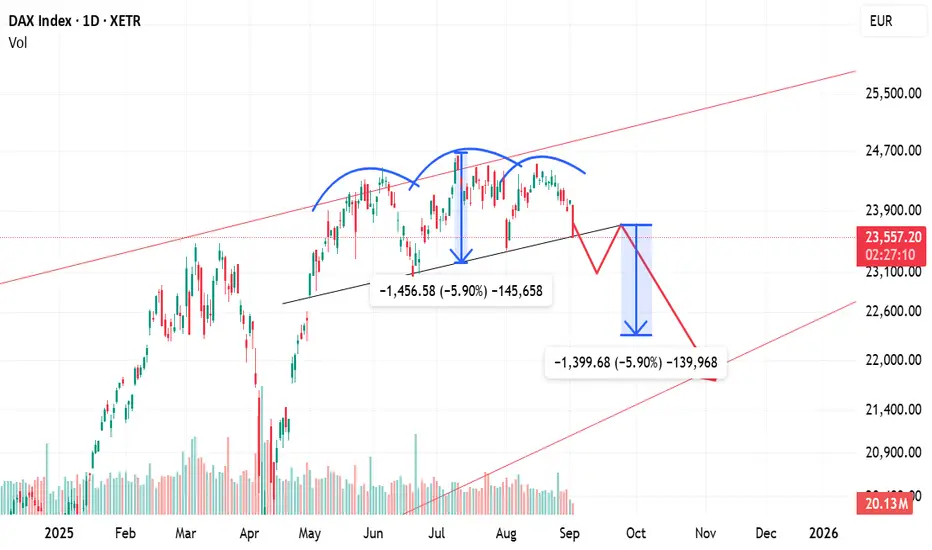
DAX Breaks H&S Pattern – Eyes 22,300–22,200🔎 Chart Setup
DAX has given a breakdown of the Head & Shoulders pattern on the daily chart. This is a strong bearish reversal pattern, usually signaling further downside.
⚖️ Downside Targets
With the breakdown confirmed, the pattern target lies in the 22,300–22,200 zone.
As long as 24,000 (on a closing basis) is not reclaimed, the bearish bias remains intact.
🔄 Retest Scenario
After such breakdowns, it’s common for the index to retest the neckline.
In this case, a pullback up to 23,700 is possible before resuming the downward move.
✅ Summary
DAX has entered a bearish phase after breaking down from the Head & Shoulders pattern. Unless it closes back above 24,000, the path of least resistance remains down toward 22,300–22,200.

SBICARD at Key Level: Watch ₹780 Support, ₹830 BreakoutSBICARD is currently displaying a double bottom pattern on the daily chart — a bullish reversal setup that typically forms after a downtrend. This pattern signals that the stock is attempting to establish a strong base and could be preparing for an upward move.
⚖️ Key Levels to Watch
Support Zone: As long as SBICARD holds above ₹780, the structure remains strong and the pattern is valid. A breakdown below this level could weaken the setup.
Breakout Confirmation: A closing above ₹830 will serve as bullish confirmation of the double bottom breakout.
Upside Targets: Once confirmed, the stock has potential to rally toward ₹860–880 levels in the short term.
✅ Summary
In short, SBICARD is in a consolidation phase, attempting to break out from a double bottom. Holding above ₹780 keeps the bullish bias intact, while a breakout above ₹830 can trigger the next leg higher.

Nifty Eyes 25,500 if Breaks Out; Risk of 24,300 if RejectedNifty bounced strongly from the 24,450–23,350 support zone and is now approaching the 25,100–25,250 resistance band. If it sustains above this level, it will confirm a double bottom pattern and open the path toward 25,500–25,600. However, if Nifty faces rejection at this resistance, it may again slip back to test the 24,400–24,300 zone. A retracement before breaking out is also possible, so next week’s price action will be crucial.
🔹 Bullish Case
Nifty bounced from the strong support zone of 24,450–23,350.
Now trading near the 25,100–25,250 resistance zone.
If it sustains above this band, it confirms a double bottom breakout.
Upside targets will be 25,500–25,600 in the short term.
🔹 Bearish Case
If Nifty fails to cross 25,100–25,250 and faces rejection,
Selling pressure may drag it back toward the 24,400–24,300 support zone.
A breakdown below this could extend weakness further.
🔹 Retracement Scenario
Nifty may first retrace a bit lower from current levels,
Then reattempt the breakout above 25,100–25,250 after retesting.
This would be a healthier breakout with stronger follow-through.
✅ Summary: Next week is crucial — a sustained breakout above 25,250 is bullish, while rejection may send Nifty back toward 24,400–24,300. Retracement before breakout is also possible.

Bearish Engulfing in Maruti: Bounce or Selloff Ahead ?What happened today
The daily candle is a strong bearish engulfing—today’s real body fully engulfed yesterday’s real body. That shows aggressive supply stepping in and a potential short-term reversal after the prior advance.
Today’s high ₹15,250 is your invalidation: as long as the price stays below this, the bearish setup remains active.
What confirms the signal tomorrow
A follow-through (confirmation) candle that closes below today’s low and ideally on above-average volume.
Bonus confirmation if intraday retests of the engulfing body’s mid-point get sold into (upper wicks, weak closes).
Downside roadmap if confirmed
A confirmed breakdown increases odds of a slide toward ₹13,600 (prior demand/congestion) and then ₹13,000 (major psychological level / deeper demand).
Momentum often accelerates after an engulfing + follow-through combo; expect lower highs, weak bounces, and moving-average rollovers on shorter timeframes.
Risk management / trade plan (discipline first)
Trigger: Consider shorts only after confirmation—i.e., sustained trade below today’s low; avoid pre-empting if price gaps up and holds.
Stop: Above ₹15,250 (setup invalidation) or above the confirmation candle’s high if that’s tighter and still logical.
Targets: T1 ₹13,600, T2 ₹13,000; trail stops on lower highs to lock gains.
Avoid traps: A close back inside/above half of today’s body without follow-through weakens the signal; a decisive close above ₹15,250 invalidates the view.
Bottom line
Bearish engulfing sets the stage; a confirmation candle tomorrow is key. If it comes, ₹13,600 → ₹13,000 opens up. If not—and especially if ₹15,250 is reclaimed—the bearish thesis is off.

Maruti’s Bearish Engulfing – Will We Get Confirmation?Maruti has formed a bearish engulfing candle on the daily chart today, which is a strong reversal signal when it appears after a rally. This pattern suggests that sellers have overpowered buyers.
⚖️ Importance of Confirmation
A bearish engulfing pattern requires a confirmation candle (a red follow-through candle on the next day) to validate the setup.
We’ve seen this before: on 4th September, Maruti also formed a bearish engulfing, but on 5th September, the follow-up candle was missing, which invalidated the bearish setup at that time.
Hence, waiting for tomorrow’s confirmation is crucial to avoid a false signal.
✅ Key Levels & Targets
If we get the confirmation candle tomorrow, then downside levels of ₹14,600 → ₹13,600 → ₹12,900 could unfold in the short to medium term.
On the flip side, if no confirmation comes, the pattern may fail just like in early September, and the stock could remain range-bound or resume upward momentum.

NVDA Breaks Trendline, Eyes $155–150 SupportNVIDIA recently gave a trendline breakdown on the chart, indicating that bullish momentum has weakened. After the breakdown, the stock also retested the broken trendline from below, which is a common technical behavior — often referred to as a breakdown and retest pattern. This confirms that the broken trendline has now turned into a resistance level.
⚖️ Implications
Since the retest failed to reclaim the trendline, selling pressure is likely to continue.
The stock is now vulnerable to further downside and may gradually drift lower.
The immediate support zone lies at $155–150, which coincides with prior demand areas where buying interest previously emerged.
✅ Key Levels
Resistance (Invalidation): The broken trendline — if price reclaims and sustains above it, bearish momentum weakens.
Support: $155–150 zone (short-term target area).
Trend Bias: Bearish as long as the stock trades below the retested trendline.

Head & Shoulders on DAX Daily Chart – Watch for BreakdownThe DAX index is currently forming a Head and Shoulders pattern on the daily chart, a well-known bearish reversal formation. This pattern typically signals a potential shift in trend from bullish to bearish if the breakdown occurs.
Left Shoulder – Formed when prices peaked, followed by a correction.
Head – A higher peak, marking the top of the uptrend, followed by another decline.
Right Shoulder – A lower high compared to the head, showing weakening bullish momentum.
Neckline – The key support line connecting the lows between the shoulders and the head.
⚖️ Implications
If the DAX breaks below the neckline with strong volume, it will confirm the pattern.
This breakdown could trigger further downward momentum, with potential targets calculated by measuring the distance from the head to the neckline and projecting it downward.
✅ Summary
Pattern: Head & Shoulders (bearish) on daily chart.
Trigger: Breakdown below the neckline.
Outcome: Increased probability of further decline, with downside targets extending to lower support zones.
Long Term View on Bank NiftyRising Wedge Pattern (Bearish Setup)
The red trendlines form a rising wedge, which is typically a bearish pattern.
After years of an uptrend, the index has near its support from the wedge.
Current Position (53,655)
Bank Nifty has corrected sharply in the last few days/weeks and is now trading around 53,600 levels.
The immediate support marked on the chart is around 53000. If this breaks, further downside could open.
Key Support Levels
50,600 – first crucial support.
48,000–47,500 zone – next major support if selling extends.
32,448 – long-term support marked, aligns with pre-COVID breakout levels.
Possible Scenarios (Green & Red Arrows on Chart)
Bullish case (green path): If Bank Nifty stabilizes near 53,000-52,500 and reclaims 55,000+, it can attempt a bounce.
Bearish case (red path): Sustained breakdown below 53,000-52,500 could accelerate fall towards 48,000 -47,500, and in extreme bearishness, even 32,500 over the medium term.
⚖️ Interpretation
The structure suggests weakness after a long rally; if the wedge breakdown happens, then a trend reversal could happen.
The next 1–2 weeks will be crucial: holding 53,000-52,500 may trigger a bounce, but a breakdown could confirm a deeper correction.

Bounce or Breakdown? HDFC Bank at Crucial Support BandHDFC Bank has been under sustained pressure over the past few sessions, reflecting both stock-specific concerns and broader market volatility. The stock has failed to participate meaningfully in the recent market upmove, which highlights underlying weakness in its structure. Selling pressure has intensified, and price action shows that the stock is struggling to hold above key support zones.
At present, HDFC Bank is trading around a crucial support band of ₹950–₹940. This zone has historically acted as an important demand area, where buyers have stepped in to defend the price. However, the inability of the stock to bounce strongly from this range in recent days raises caution.
A decisive breakdown below ₹940 may trigger further weakness, opening the door for a slide toward ₹930, ₹900, and even ₹870 levels in the near term. These levels are important psychological and technical supports, and a test of them cannot be ruled out if selling continues.
Overall, unless the stock manages to sustain and bounce above ₹950 with strong volumes, the undertone remains weak. The coming sessions will be crucial to determine whether HDFC Bank stabilizes at this support zone or extends its downtrend.

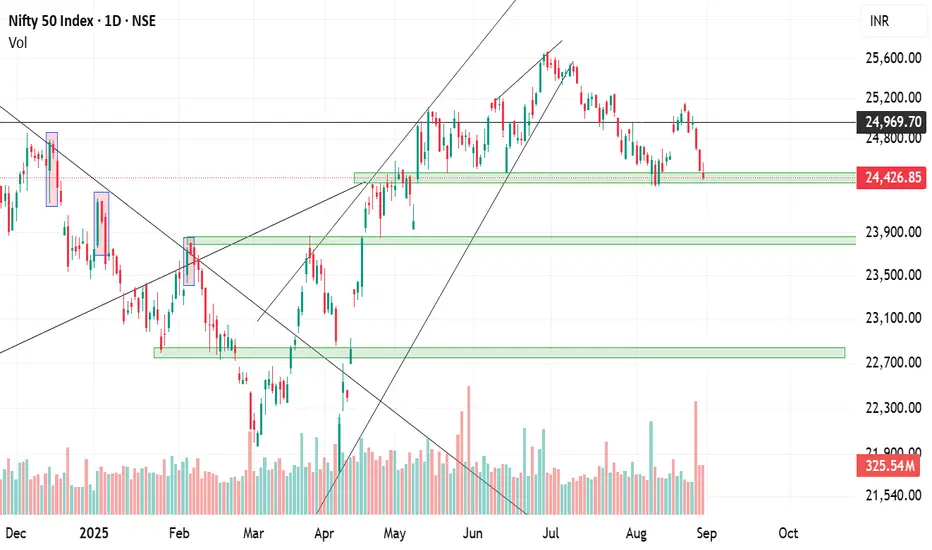
Crucial Week Ahead: Bounce or Breakdown for Nifty?The Nifty ended Friday’s session at a very crucial technical level, which makes the coming week particularly important for market direction. The index has been showing signs of weakness after a sharp rally, and the 24350 level has now emerged as a key support zone. If Nifty fails to sustain below this level, it could open the doors for further downside. The next major support is placed around 24000–23800, which also coincides with previous demand zones and moving average clusters.
Traders should note that the market sentiment next week will be critical. A sustainable bounce from the current level could re-establish bullish momentum and keep the uptrend intact. However, a decisive breakdown below 24350 may trigger profit booking and a short-term trend reversal toward lower levels.
Overall, next week could act as a make-or-break zone for the Indian market, as price action around these levels will decide whether we continue higher or witness a deeper correction.