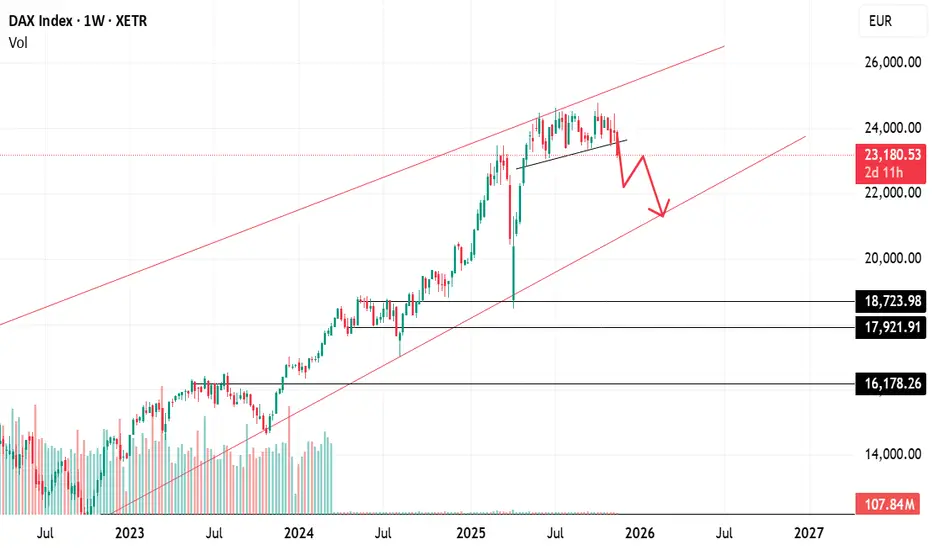
DAX breaking 7-month consolidationDAX Weekly Outlook – Consolidation Breakdown in Progress
The DAX has been moving in a broad 7-month consolidation range, showing neither a clear uptrend nor a downtrend. Such long consolidations often act as distribution zones, where smart money gradually exits positions before a larger move begins.
Consolidation Breaking on the Downside
This week, the index is attempting to break below the lower boundary of this consolidation range. A downside break after months of sideways action is usually a strong bearish signal, especially on higher timeframes like the weekly chart.
Key Level – 23,000
The 23,000 zone is the critical level to watch:
If the DAX gives a weekly close below 23,000,
And we see follow-up selling next week,
…then it would strongly suggest that the distribution phase is complete, and the index may begin a sustained downward journey.
What This Means
A confirmed breakdown from multi-month consolidation often leads to:
Increased volatility
Trend acceleration
Deeper corrections toward the next major demand zones
For now, the weekly close will be crucial. A weak closing would confirm bearish sentiment and open the path for further downside.
Sachincharts
Bearish Signal in Dow Jones: Will 45,000 Hold?Dow Jones Analysis – Bearish Signal Emerges
The Dow Jones Industrial Average (DJI) has shown signs of weakness over the past couple of sessions. On Tuesday, the index formed a shooting star candlestick pattern — a classic reversal signal that often indicates exhaustion in the uptrend.
Yesterday, the shooting star was confirmed by a follow-up bearish candle, which strengthens the case that a short-term top may be in place for the index. This suggests that buyers are losing control, and sellers are stepping in at higher levels.
Key Support Zone – 45,000
The immediate and crucial support for DJI is placed around 45,000, a level that has held strong in the past. However, the index is now testing this zone again, and the price action shows clear weakness.
Trend Breakdown Adds to Bearish Bias
Looking at the chart, the trendline support is also at risk of breaking. If the index fails to hold 45,000 decisively, this breakdown could open the door for deeper correction, leading to further downside targets in the short term.
Conclusion
Bearish pattern confirmed: Shooting star + follow-up candle.
45,000 is key support: A breakdown here confirms bearish momentum.
Short-term top likely: Weakness could extend further if supports fail.
📉 For now, traders should stay cautious on DJI until it either reclaims higher levels or establishes fresh support below.

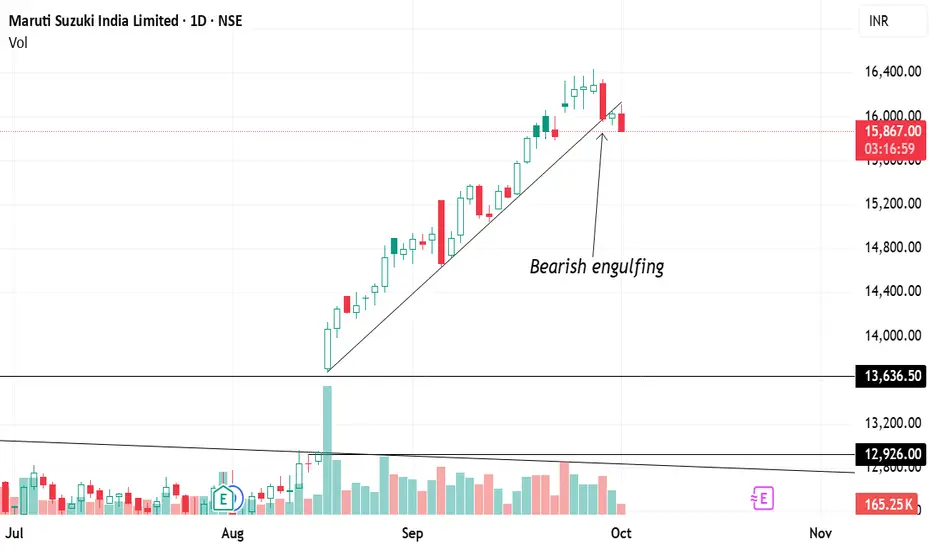
Maruti Hits the Brakes ?🚗 Maruti Hits the Brakes: Bearish Engulfing Signals a Possible Correction Ahead!
Maruti Suzuki has been one of the strongest performers in the market since August 2025, rallying nearly 35% in just two months 📈. The uptrend was further boosted after the GST cut reform, which led to a huge gap-up opening. From there, the stock followed a clear trendline support, steadily moving higher week after week.
But now, the charts are flashing caution signals ⚠️:
✨ 1. Daily Chart View
On 29th September 2025, Maruti formed a bearish engulfing candle.
This isn’t just an ordinary candle — it engulfed the previous four trading sessions’ candles, showing strong selling pressure.
Such a large engulfing candle often signals a trend reversal, especially after a sharp rally.
📅 2. Weekly Chart View (Bigger Picture)
For the past 8 straight weeks, Maruti delivered green candles — a remarkable bullish run.
This week, the weekly chart is also showing the formation of a bearish engulfing pattern (although two days remain for confirmation).
If this pattern holds at the close, it would indicate that momentum has shifted from buyers to sellers.
📌 3. Trendline Break
The uptrend since August was guided by a well-respected trendline.
This trendline now appears to be broken, which adds further confirmation that the bullish momentum has weakened.
⚖️ 4. What This Means
🔻 Bearish Signal: A strong bearish engulfing candle after a steep rally is a textbook sign of a potential correction.
⛔ Trendline Broken: Losing the trendline suggests the uptrend structure is failing.
📉 Correction Likely: After a 35% run-up, profit booking and a healthy pullback seem due.
👉 Summary
Maruti’s spectacular run since August may have finally hit a wall. With a daily bearish engulfing candle, a trendline breakdown, and the weekly bearish engulfing pattern forming, the probability of a correction is high.
Disclaimer:- I have a short position on the Stock.
#Nifty #StockMarket #stockmarketsindia #SachinCharts #stockmarketcrash #Epic202426 #SachinStockChart #Maruti #Auto #SachinStockAnalysis
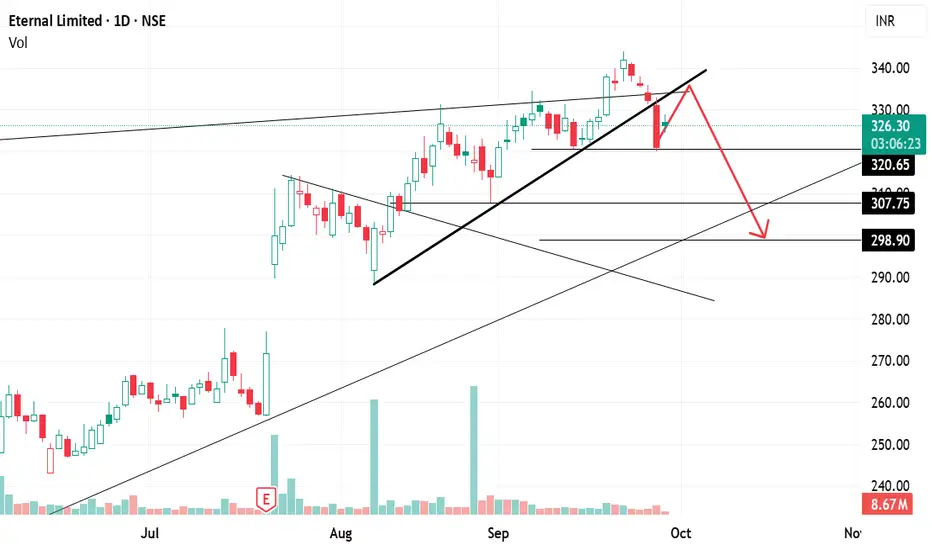
ETERNAL (Zomato): Breakdown Below Trendline ETERNAL (Zomato) had been on a strong bull run since April 2025, rallying from ₹195 to ₹344 🚀. Throughout this journey, the stock consistently respected an upward trendline, bouncing every time it touched the line.
But things changed on 26th September 2025:
❌ The stock broke down below the trendline support for the first time.
After the breakdown, it reached a low of ₹320, signaling that the structure had become weak
✨ 1. Trendline Signals (Daily Chart)
If we connect all the key highs of September 2024, December 2024, August 2025, and September 2025, we obtain a resistance trendline.
Recently, the stock gave a breakout above this trendline, but it failed to sustain and quickly slipped back below it.
This false breakout followed by weakness is often a bearish signal ⚠️.
📅 2. Short-Term View
Right now, the stock is hovering near ₹320, a critical support level.
If ₹320 breaks decisively, the weakness will get confirmed, and the stock may head toward:
🎯 ₹310
🎯 ₹300 (short-term target zone).
Until then, some retracement or sideways movement may happen, but the overall bias is weak.
🕰️ 3. Weekly Chart View (Bigger Picture)
Last week, the stock formed a bearish engulfing candle, where the body of the red candle completely covers the body of the previous green candle.
This pattern is a reversal signal, showing sellers overpowering buyers.
If this week’s close is below ₹320, it will confirm the bearish engulfing pattern ✅, adding further weight to the downside scenario.
📌 Summary:
🔻 Weakness Detected: Breakdown of trendline + false breakout on resistance.
⚠️ Confirmation Needed: Closing below ₹320 will confirm bearish engulfing and continuation of weakness.
🎯 Targets: If ₹320 breaks, next levels are ₹310 and ₹300.
🛡️ If ₹320 holds: Stock may bounce, but the overall structure remains fragile.
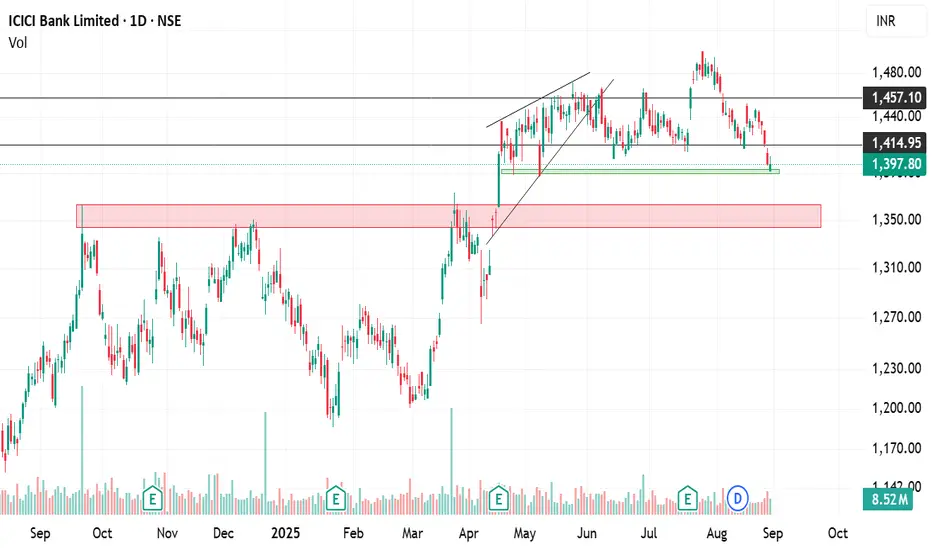
ICICI Bank Under Pressure: Breakdown Could Open ₹1,360–1,340ICICI Bank has been exhibiting persistent weakness over the past few sessions, underperforming relative to the broader market and showing clear signs of profit-booking. Despite being one of the stronger banking names in the past, the stock has recently struggled to sustain upward momentum, reflecting near-term bearish undertones.
Currently, ICICI Bank is trading around a crucial support band of ₹1,400–1,390. This zone has historically acted as a strong base, where buying interest has emerged in the past. However, repeated testing of this support without a meaningful bounce raises concerns about its sustainability.
A decisive breakdown below ₹1,390 could accelerate weakness and potentially drag the stock towards ₹1,360 and ₹1,340 levels, which are the next major support zones. These levels are important markers that could determine the medium-term trend.
On the upside, for sentiment to improve, the stock must sustain above ₹1,400–1,420 with strong volumes. Until then, caution is advised, as the undertone remains weak, and any breakdown may invite further selling pressure.
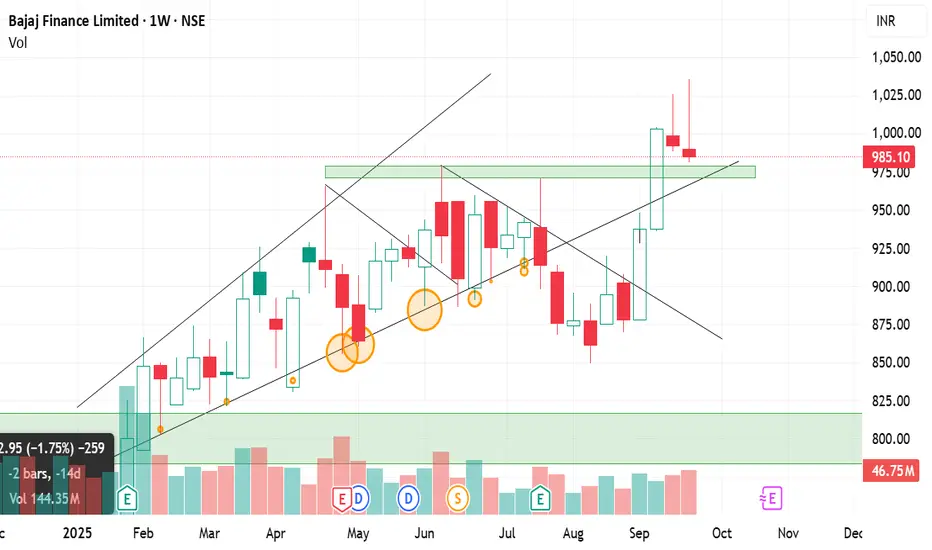
Bajaj Finance: Breakout, Retest & What’s Next?Bajaj Finance has been in focus ever since it broke its long-term resistance zone of ₹870–₹880 on 12th September 2025. This breakout was significant because the stock had been struggling to cross this level for a long time. Once it crossed, the stock quickly rallied and touched a high of ₹1036 🚀.
But the story has taken an interesting turn in the last two weeks. Let’s break it down in detail:
✨ 1. Weekly Chart View (Bigger Picture)
A shooting star candle formed last week. This is a bearish reversal pattern that occurs when the price moves higher but closes near the lows, showing that sellers took control.
This week, once again, a second shooting star appeared, and what’s more important is that it closed lower than last week’s close.
This back-to-back formation is a strong sign that buyers are losing momentum and sellers are active at higher levels.
📅 2. Daily Chart View (Short-Term Action)
After the breakout above ₹870–₹880, the stock pulled back and is now retesting this breakout zone.
This level is crucial because:
It is a classic breakout-retest scenario.
The same zone also coincides with a trendline support, adding strength to this level.
If the price bounces from this zone, it will confirm the breakout as valid and can lead to another leg up.
📌 3. Key Levels to Watch
Strong Support: ₹870–₹880 (breakout + trendline support).
Upside Potential: If the stock holds above this zone, it can retest ₹1000+ levels in the short-to-medium term.
Downside Risk: If the stock decisively breaks below ₹870–₹880, then the structure weakens, and the stock can slip towards ₹900 or even lower.
⚖️ 4. Market Sentiment & Interpretation
Two weekly shooting stars show weakness and profit-booking at higher levels.
But since the stock is still above the breakout zone, bulls still have a chance to defend the trend.
The coming sessions are critical — holding above 870–880 means bulls are in control, but if broken, sellers will dominate.
👉 Summary
🔻 Weakness spotted: Two weekly shooting stars confirm selling pressure.
🛡️ Support zone (₹870–₹880): This is the line in the sand for bulls.
⚠️ If broken: A medium-term fall toward ₹900 (or lower) is likely.
🚀 If defended: The stock can bounce and resume its upward journey, possibly retesting ₹1000–₹1036.
The Dollar’s Journey💵 The Dollar’s Journey – From Blastoff to Pause, and Maybe… Another Run?
Back in May 2021 , the Dollar Index (DXY) quietly started climbing. At first, nobody gave it much thought. But then 🚀 it took off—running from 89 to 114 in just over a year. That’s what traders call a parabolic move —fast, powerful, and impossible to ignore.
Then came September 2022 . The rally cooled off. The dollar stopped sprinting and instead moved sideways. For the next three years , it was all about patience. The index slipped as low as 95.5 , testing everyone’s nerves. Was the bull run dead, or just taking a breather? ⏸️
Here’s the twist: that low wasn’t random. It actually landed right on a major long-term trendline —a line that connects the tops of 2001, 2016, and 2020 . In other words, the dollar was pulling back to recharge at home base . 📉➡️📈
Now the picture gets exciting again. The correction looks done. The index is knocking on the door of 100 —and this number isn’t just psychological, it’s technical too. If DXY sustains above 100 ✅ , it could light the fuse for the next bull run 🐂💵 .
And remember, when the dollar moves, the world feels it:
* 📉 Global equities, especially emerging markets, often struggle.
* 🛢️ Commodities like gold and oil usually come under pressure.
* 💱 Other currencies—the euro, yen, pound—tend to weaken.
So here we are, three years after the peak. The dollar looks ready to decide its next chapter. Will it stay stuck in consolidation… or break out into a brand-new bull cycle? Traders, investors, and even governments are watching closely. 👀
The story of the dollar isn’t over—it might just be about to get interesting again. 📊✨

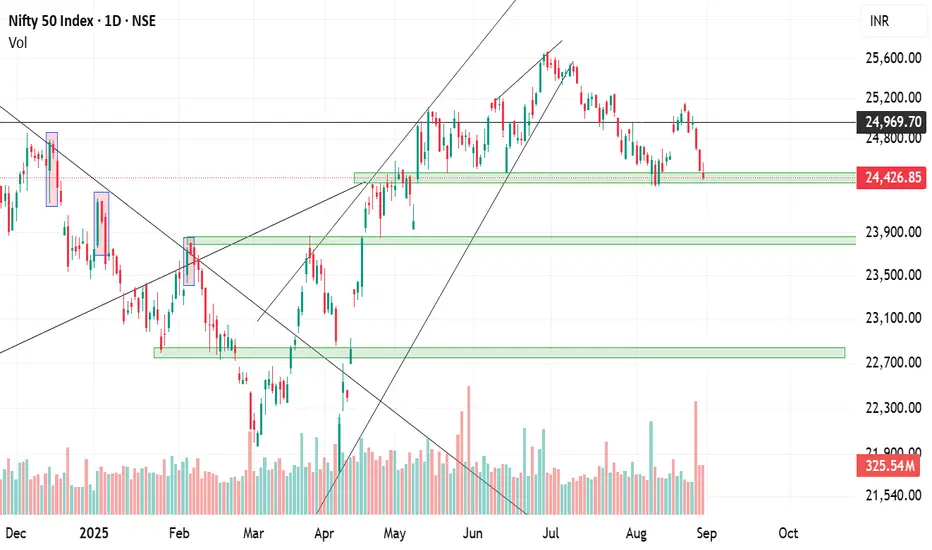
Nifty weak after failed retest – Key supports at 24,900–24,800📉 Nifty Outlook – Breakdown After Failed Retest
Nifty tried to retest the breakout zone of 25,150–25,250, but failed to hold above it. This rejection has shifted the structure towards weakness, and the index may now revisit crucial lower levels.
🔴 Failed Retest – A Bearish Signal
The zone of 25,150–25,250 was earlier acting as a breakout area. A successful retest would have confirmed strength for higher levels. However, Nifty failed to sustain, which indicates that buyers are losing control near this resistance.
📉 Next Support – Trendline Breakout Zone
The immediate support lies in the 24,900–24,800 band, which coincides with the earlier trendline breakout zone. If Nifty can stabilize here, a short-term bounce may still be possible.
⚠️ Deeper Downside Risk
If the 24,900–24,800 zone is broken on the downside, then the structure opens up for a deeper correction. In such a case, levels of 24,500–24,300 become very much possible in the coming sessions.
✅ Summary
Resistance rejected at 25,150–25,250
Weakness likely unless Nifty reclaims this zone
Supports at 24,900–24,800, below which 24,500–24,300 may come into play.
DAX Breaks H&S Pattern – Eyes 22,300–22,200🔎 Chart Setup
DAX has given a breakdown of the Head & Shoulders pattern on the daily chart. This is a strong bearish reversal pattern, usually signaling further downside.
⚖️ Downside Targets
With the breakdown confirmed, the pattern target lies in the 22,300–22,200 zone.
As long as 24,000 (on a closing basis) is not reclaimed, the bearish bias remains intact.
🔄 Retest Scenario
After such breakdowns, it’s common for the index to retest the neckline.
In this case, a pullback up to 23,700 is possible before resuming the downward move.
✅ Summary
DAX has entered a bearish phase after breaking down from the Head & Shoulders pattern. Unless it closes back above 24,000, the path of least resistance remains down toward 22,300–22,200.

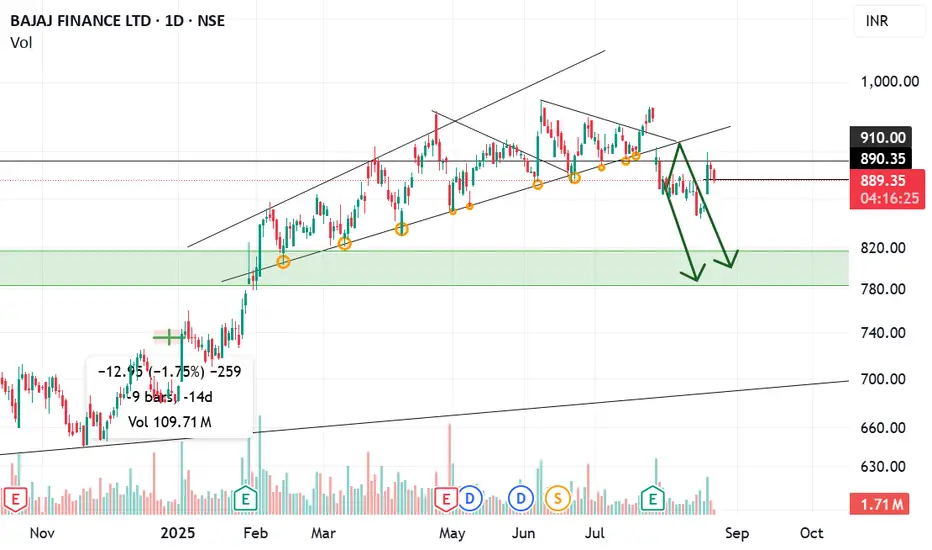
Chart Analysis – Bajaj Finance LtdThe stock was trading inside a rising channel for a long time but eventually broke down from it.
After the breakdown, a retest of the broken support trendline was observed, confirming weakness.
Currently, the price is struggling near the ₹890–₹900 zone, which is acting as a resistance.
The critical support lies around ₹850.
⚠️ If the stock closes below ₹850, it will confirm further bearish momentum.
The next support levels open up towards ₹820–₹800, which is also a strong demand zone (green highlighted area on chart).
📌 Summary:
Unless the stock reclaims and sustains above ₹900, the bias remains weak. A close below ₹850 can accelerate the fall toward ₹820–₹800.
SBICARD at Key Level: Watch ₹780 Support, ₹830 BreakoutSBICARD is currently displaying a double bottom pattern on the daily chart — a bullish reversal setup that typically forms after a downtrend. This pattern signals that the stock is attempting to establish a strong base and could be preparing for an upward move.
⚖️ Key Levels to Watch
Support Zone: As long as SBICARD holds above ₹780, the structure remains strong and the pattern is valid. A breakdown below this level could weaken the setup.
Breakout Confirmation: A closing above ₹830 will serve as bullish confirmation of the double bottom breakout.
Upside Targets: Once confirmed, the stock has potential to rally toward ₹860–880 levels in the short term.
✅ Summary
In short, SBICARD is in a consolidation phase, attempting to break out from a double bottom. Holding above ₹780 keeps the bullish bias intact, while a breakout above ₹830 can trigger the next leg higher.

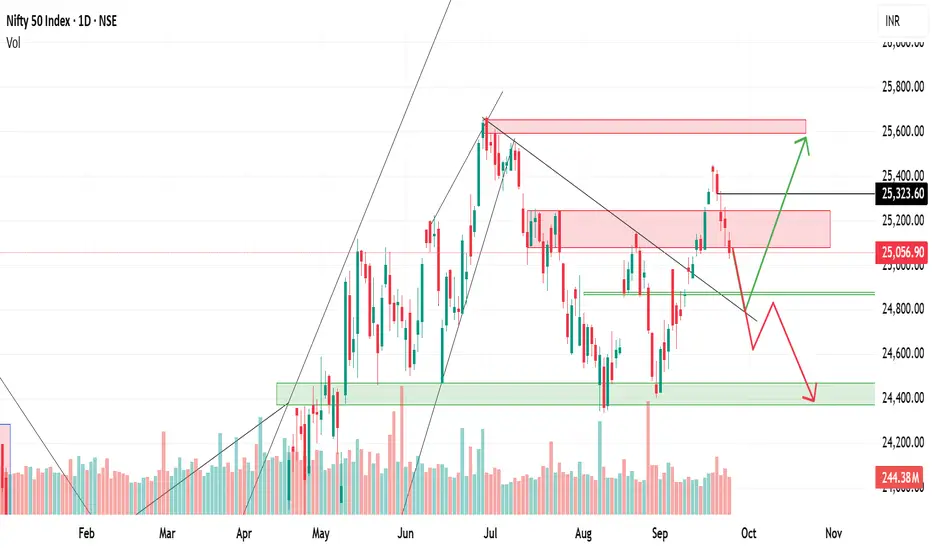
Nifty Eyes 25,500 if Breaks Out; Risk of 24,300 if RejectedNifty bounced strongly from the 24,450–23,350 support zone and is now approaching the 25,100–25,250 resistance band. If it sustains above this level, it will confirm a double bottom pattern and open the path toward 25,500–25,600. However, if Nifty faces rejection at this resistance, it may again slip back to test the 24,400–24,300 zone. A retracement before breaking out is also possible, so next week’s price action will be crucial.
🔹 Bullish Case
Nifty bounced from the strong support zone of 24,450–23,350.
Now trading near the 25,100–25,250 resistance zone.
If it sustains above this band, it confirms a double bottom breakout.
Upside targets will be 25,500–25,600 in the short term.
🔹 Bearish Case
If Nifty fails to cross 25,100–25,250 and faces rejection,
Selling pressure may drag it back toward the 24,400–24,300 support zone.
A breakdown below this could extend weakness further.
🔹 Retracement Scenario
Nifty may first retrace a bit lower from current levels,
Then reattempt the breakout above 25,100–25,250 after retesting.
This would be a healthier breakout with stronger follow-through.
✅ Summary: Next week is crucial — a sustained breakout above 25,250 is bullish, while rejection may send Nifty back toward 24,400–24,300. Retracement before breakout is also possible.

Bearish Engulfing in Maruti: Bounce or Selloff Ahead ?What happened today
The daily candle is a strong bearish engulfing—today’s real body fully engulfed yesterday’s real body. That shows aggressive supply stepping in and a potential short-term reversal after the prior advance.
Today’s high ₹15,250 is your invalidation: as long as the price stays below this, the bearish setup remains active.
What confirms the signal tomorrow
A follow-through (confirmation) candle that closes below today’s low and ideally on above-average volume.
Bonus confirmation if intraday retests of the engulfing body’s mid-point get sold into (upper wicks, weak closes).
Downside roadmap if confirmed
A confirmed breakdown increases odds of a slide toward ₹13,600 (prior demand/congestion) and then ₹13,000 (major psychological level / deeper demand).
Momentum often accelerates after an engulfing + follow-through combo; expect lower highs, weak bounces, and moving-average rollovers on shorter timeframes.
Risk management / trade plan (discipline first)
Trigger: Consider shorts only after confirmation—i.e., sustained trade below today’s low; avoid pre-empting if price gaps up and holds.
Stop: Above ₹15,250 (setup invalidation) or above the confirmation candle’s high if that’s tighter and still logical.
Targets: T1 ₹13,600, T2 ₹13,000; trail stops on lower highs to lock gains.
Avoid traps: A close back inside/above half of today’s body without follow-through weakens the signal; a decisive close above ₹15,250 invalidates the view.
Bottom line
Bearish engulfing sets the stage; a confirmation candle tomorrow is key. If it comes, ₹13,600 → ₹13,000 opens up. If not—and especially if ₹15,250 is reclaimed—the bearish thesis is off.

Maruti’s Bearish Engulfing – Will We Get Confirmation?Maruti has formed a bearish engulfing candle on the daily chart today, which is a strong reversal signal when it appears after a rally. This pattern suggests that sellers have overpowered buyers.
⚖️ Importance of Confirmation
A bearish engulfing pattern requires a confirmation candle (a red follow-through candle on the next day) to validate the setup.
We’ve seen this before: on 4th September, Maruti also formed a bearish engulfing, but on 5th September, the follow-up candle was missing, which invalidated the bearish setup at that time.
Hence, waiting for tomorrow’s confirmation is crucial to avoid a false signal.
✅ Key Levels & Targets
If we get the confirmation candle tomorrow, then downside levels of ₹14,600 → ₹13,600 → ₹12,900 could unfold in the short to medium term.
On the flip side, if no confirmation comes, the pattern may fail just like in early September, and the stock could remain range-bound or resume upward momentum.

NVDA Breaks Trendline, Eyes $155–150 SupportNVIDIA recently gave a trendline breakdown on the chart, indicating that bullish momentum has weakened. After the breakdown, the stock also retested the broken trendline from below, which is a common technical behavior — often referred to as a breakdown and retest pattern. This confirms that the broken trendline has now turned into a resistance level.
⚖️ Implications
Since the retest failed to reclaim the trendline, selling pressure is likely to continue.
The stock is now vulnerable to further downside and may gradually drift lower.
The immediate support zone lies at $155–150, which coincides with prior demand areas where buying interest previously emerged.
✅ Key Levels
Resistance (Invalidation): The broken trendline — if price reclaims and sustains above it, bearish momentum weakens.
Support: $155–150 zone (short-term target area).
Trend Bias: Bearish as long as the stock trades below the retested trendline.

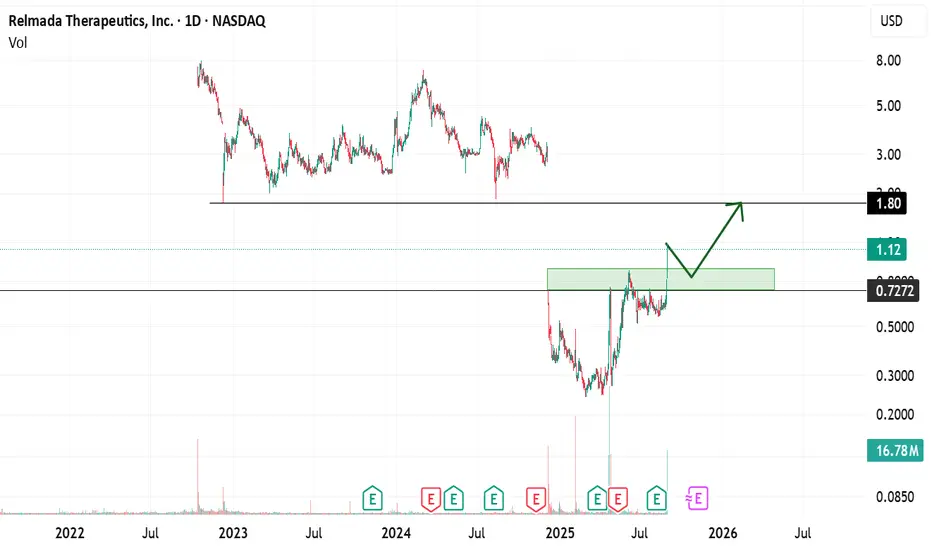
RLMD — Breakout After 10-Month ConsolidationRLMD has finally broken out above its long-standing resistance after nearly 10 months of consolidation. The breakout is supported by good volume, which adds strength and reliability to the move.
🔑 Why This is Significant
Long consolidation: When a stock trades sideways for months, it builds strong accumulation. Once price escapes the range, moves are often sharp and sustained.
Volume confirmation: Breakouts on higher-than-average volume signal real demand, reducing the chances of a false breakout.
Gap to fill: There’s a price gap up to $1.70. Gaps act like magnets — if the breakout holds, price often travels to fill them.
🎯 Levels to Watch
Breakout trigger: $0.70 → needs to sustain trading above this level.
Immediate targets: $1.40 → $1.70 (gap-fill).
Invalidation: A daily close back below $0.70 would signal a failed breakout and likely return to consolidation.
✅ Conclusion
As long as RLMD holds above $0.70, bias stays bullish with a possible gap-fill move toward $1.70. Traders should watch for retests of $0.70 acting as support, along with continued volume confirmation.
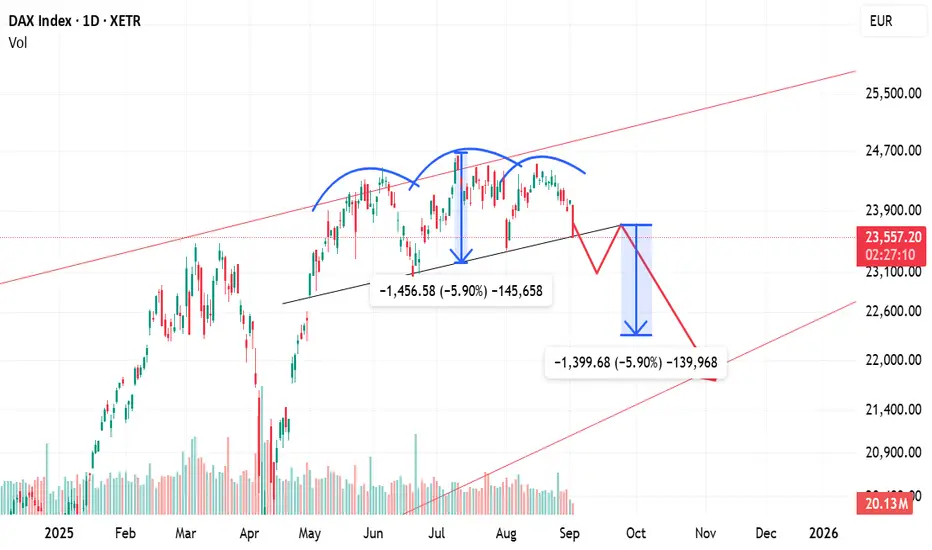
Head & Shoulders on DAX Daily Chart – Watch for BreakdownThe DAX index is currently forming a Head and Shoulders pattern on the daily chart, a well-known bearish reversal formation. This pattern typically signals a potential shift in trend from bullish to bearish if the breakdown occurs.
Left Shoulder – Formed when prices peaked, followed by a correction.
Head – A higher peak, marking the top of the uptrend, followed by another decline.
Right Shoulder – A lower high compared to the head, showing weakening bullish momentum.
Neckline – The key support line connecting the lows between the shoulders and the head.
⚖️ Implications
If the DAX breaks below the neckline with strong volume, it will confirm the pattern.
This breakdown could trigger further downward momentum, with potential targets calculated by measuring the distance from the head to the neckline and projecting it downward.
✅ Summary
Pattern: Head & Shoulders (bearish) on daily chart.
Trigger: Breakdown below the neckline.
Outcome: Increased probability of further decline, with downside targets extending to lower support zones.
Long Term View on Bank NiftyRising Wedge Pattern (Bearish Setup)
The red trendlines form a rising wedge, which is typically a bearish pattern.
After years of an uptrend, the index has near its support from the wedge.
Current Position (53,655)
Bank Nifty has corrected sharply in the last few days/weeks and is now trading around 53,600 levels.
The immediate support marked on the chart is around 53000. If this breaks, further downside could open.
Key Support Levels
50,600 – first crucial support.
48,000–47,500 zone – next major support if selling extends.
32,448 – long-term support marked, aligns with pre-COVID breakout levels.
Possible Scenarios (Green & Red Arrows on Chart)
Bullish case (green path): If Bank Nifty stabilizes near 53,000-52,500 and reclaims 55,000+, it can attempt a bounce.
Bearish case (red path): Sustained breakdown below 53,000-52,500 could accelerate fall towards 48,000 -47,500, and in extreme bearishness, even 32,500 over the medium term.
⚖️ Interpretation
The structure suggests weakness after a long rally; if the wedge breakdown happens, then a trend reversal could happen.
The next 1–2 weeks will be crucial: holding 53,000-52,500 may trigger a bounce, but a breakdown could confirm a deeper correction.

Bounce or Breakdown? HDFC Bank at Crucial Support BandHDFC Bank has been under sustained pressure over the past few sessions, reflecting both stock-specific concerns and broader market volatility. The stock has failed to participate meaningfully in the recent market upmove, which highlights underlying weakness in its structure. Selling pressure has intensified, and price action shows that the stock is struggling to hold above key support zones.
At present, HDFC Bank is trading around a crucial support band of ₹950–₹940. This zone has historically acted as an important demand area, where buyers have stepped in to defend the price. However, the inability of the stock to bounce strongly from this range in recent days raises caution.
A decisive breakdown below ₹940 may trigger further weakness, opening the door for a slide toward ₹930, ₹900, and even ₹870 levels in the near term. These levels are important psychological and technical supports, and a test of them cannot be ruled out if selling continues.
Overall, unless the stock manages to sustain and bounce above ₹950 with strong volumes, the undertone remains weak. The coming sessions will be crucial to determine whether HDFC Bank stabilizes at this support zone or extends its downtrend.

Crucial Week Ahead: Bounce or Breakdown for Nifty?The Nifty ended Friday’s session at a very crucial technical level, which makes the coming week particularly important for market direction. The index has been showing signs of weakness after a sharp rally, and the 24350 level has now emerged as a key support zone. If Nifty fails to sustain below this level, it could open the doors for further downside. The next major support is placed around 24000–23800, which also coincides with previous demand zones and moving average clusters.
Traders should note that the market sentiment next week will be critical. A sustainable bounce from the current level could re-establish bullish momentum and keep the uptrend intact. However, a decisive breakdown below 24350 may trigger profit booking and a short-term trend reversal toward lower levels.
Overall, next week could act as a make-or-break zone for the Indian market, as price action around these levels will decide whether we continue higher or witness a deeper correction.
Bitcoin Analysis – Support Break & Next LevelsBitcoin has broken below its key ascending trendline and also lost the horizontal support around 111k–112k.
The breakdown was followed by a retest of the trendline, which got rejected, confirming the weakness.
🔑 Key Levels to Watch
124,272 → Major resistance (recent swing high).
111k–112k → Broken support, now acting as resistance.
100,407 (~100k)→ Next important support zone to test.
92k–90k (red zone) → Strong demand area if 100k fails.
76,719 → Deeper support if selling continues.
📊 Possible Scenarios
1. Bearish Continuation (Base Case):
Price likely to move toward 100k support. A bounce is possible here, but if Bitcoin closes below 100k on daily timeframe, next downside targets are 96k → 92k–90k.
2. Bullish Invalidation:
If BTC reclaims 112k and sustains above it, short-term bearish outlook weakens.
A break above 120k could reopen the path toward 124k.
✅ Conclusion
Right now, the bias remains bearish below 112k, with 100k as the immediate support to watch. Reaction at 100k will decide whether we see a bounce back to 111k or a deeper correction into the 90k zone.
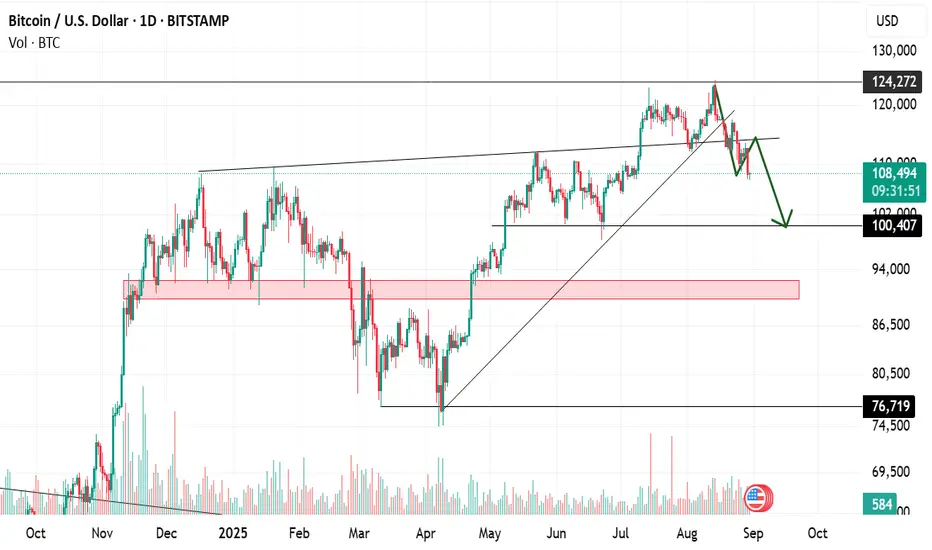
Chart Analysis - Dow Jones (Breaking Important Resistance)The US30 index has successfully broken through an important resistance level today, which is a key technical development. This breakout suggests the potential beginning of a strong bullish trend, provided the index is able to sustain itself above the red zone. If it continues to hold above this zone, buyers will likely remain in control, paving the way for higher upside targets in the coming sessions.
However, if the index fails to stay above this red zone and falls back below it, the breakout will be considered a false breakout, which could lead to renewed selling pressure and possible downside movement. In short, the red zone is the make-or-break level that will decide whether the trend continues upward or reverses.
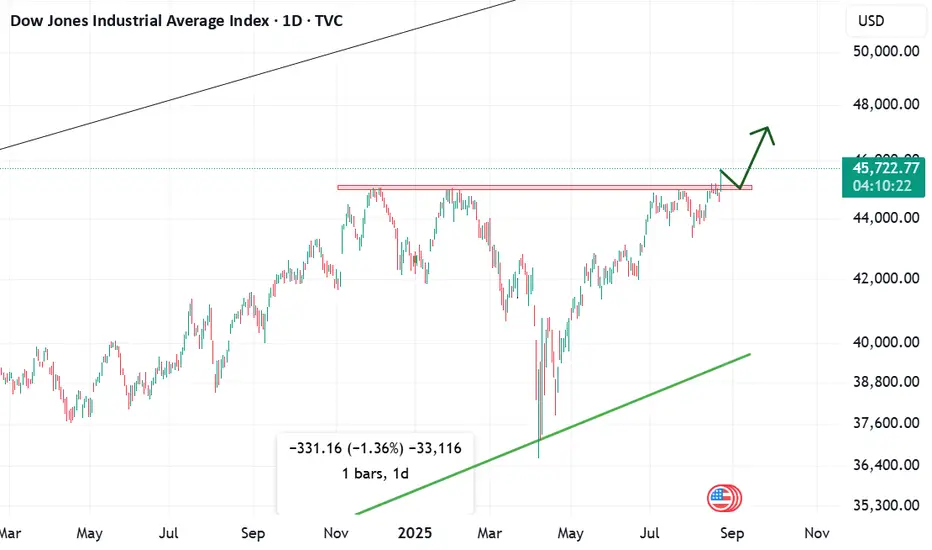
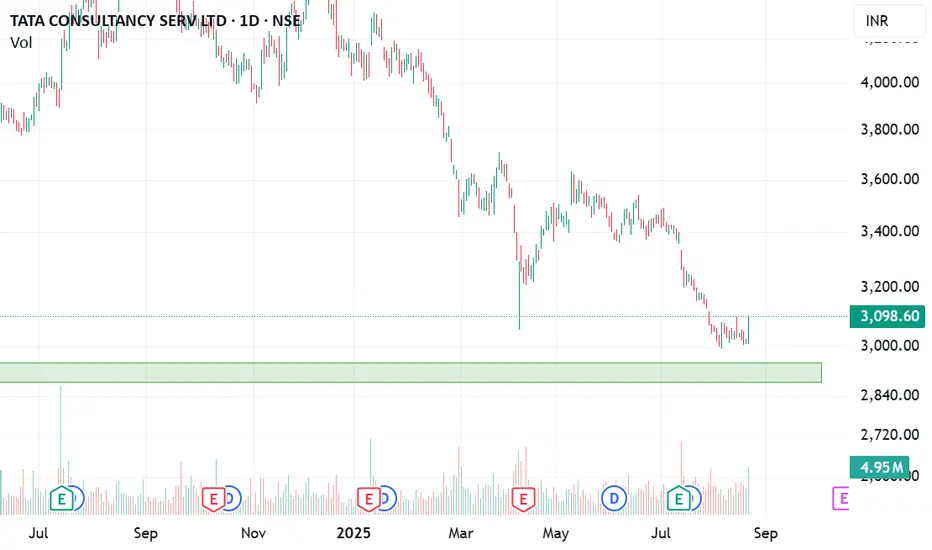
Chart Analysis - TCS1) Weekly support (context)
Price is sitting near a multi-week demand zone (prior swing lows / consolidation base). Weekly supports matter because bigger timeframes filter noise and attract institutional flows.
When price returns to a weekly support and stabilizes, it often transitions from distribution to accumulation.
2) Daily double bottom (pattern)
A double bottom forms when price tests a low, bounces, then retests roughly the same low and rejects it again. That shows buyers defending the level twice.
The neckline is drawn across the swing high between the two lows. A daily close above the neckline confirms the pattern.
3) Volume confirmation
Healthy: rising volume on up-days, especially on the rally from the second bottom and on the neckline breakout. That says demand is active, not just a technical bounce.
4) Risk line (“invalidates below today’s low”)
Your statement “bullish till it holds today’s low” defines a clear invalidity level. If price closes below today’s low, it suggests the second bottom failed—cut risk there.
5) Trade planning (illustrative, not advice)
Entry ideas:
(a) Aggressive: near current price with stop just below today’s low.
(b) Conservative: on a confirmed close above the neckline, or on a pullback/retest to the neckline that holds.
Stops: A few ticks below today’s low (aggressive) or below retest low (conservative).
Management: Scale partial at interim resistance; trail stop under higher lows / 20-EMA on the daily.
6) What would weaken the setup
Weak or declining volume on rallies, repeated rejections at the neckline, or a decisive daily close below today’s low/weekly support.
In short: Weekly support + daily double bottom + volume = constructive. Confirmation comes with a neckline break; invalidation is a close below today’s low.