Bajaj Finance – Trendline BreakdownBajaj Finance has broken a key ascending trendline on the daily chart, with a minor retest underway. The price now trades below the 21 EMA (926.59), indicating short-term weakness. RSI stands at 38.31, showing bearish momentum with room for further downside. A significant volume spike confirms strong selling pressure. If the retest fails, the stock could drop toward the 790–830 support zone. This bearish setup remains valid unless the price reclaims the trendline and closes above the EMA. Traders should watch for rejection at the trendline to confirm further downside.
Sachincharts

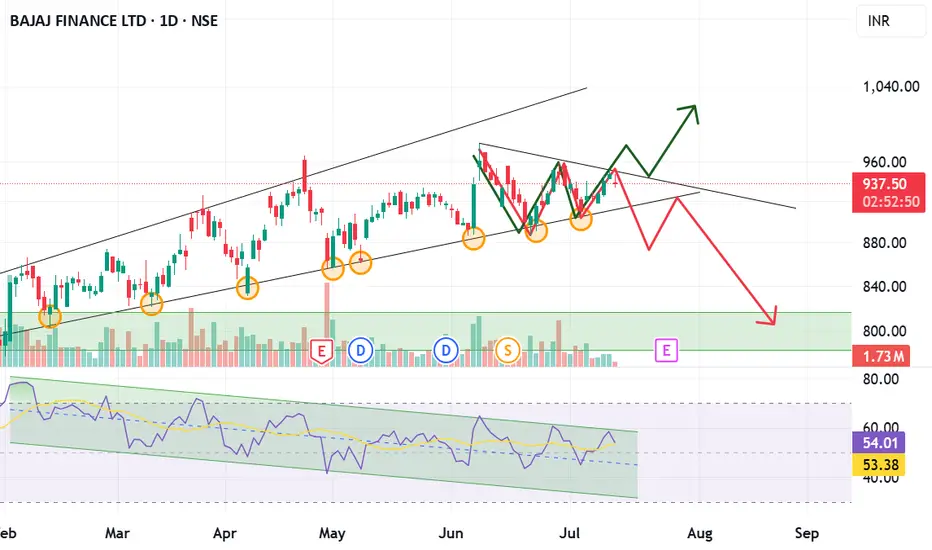
Green or Red Which path Bajaj Finance will take ?Bajaj Finance is currently consolidating, showing potential for a strong move in either direction. A bullish breakout could lead to an uptrend, while a bearish breakdown may signal a decline. The stock is forming a base, and whichever path it takes next may define its trend for the coming weeks.
Bajaj Finance – Bearish Divergence and Short Bajaj Finance is currently exhibiting a classic bearish divergence, which is a well-known signal in technical analysis indicating a potential trend reversal or weakness in the ongoing uptrend.
1. Price Action – Upward Trending Channel
The stock price of Bajaj Finance has been making higher highs and higher lows, forming a well-defined upward channel.
This typically suggests a strong bullish momentum, where buyers are in control, and the price continues to rise steadily.
2. RSI Indicator – Downward Channel
In contrast to the price, the Relative Strength Index (RSI) – a momentum oscillator – is not confirming the bullish trend.
The RSI is forming a downward channel, with lower highs and lower lows over the same time period.
This means that while the price is moving higher, the momentum behind the move is weakening.
3. Bearish Divergence
This mismatch between price movement and RSI is called a bearish divergence.
It often signals that the upward trend may soon lose strength or reverse, as the underlying buying momentum is fading.
Divergences are typically seen as early warning signs by technical traders.
4. Trade Setup – Good Short Opportunity
Given the divergence, Bajaj Finance presents a high-probability short trade setup.
Conclusion:
The divergence between Bajaj Finance’s rising price and its declining RSI suggests that the bullish momentum is unsustainable. This creates a good opportunity to consider shorting the stock, especially for traders looking for setups with strong technical justification and attractive risk-reward profiles.
Always ensure risk management is in place before entering the trade.
