DAX breaking 7-month consolidationDAX Weekly Outlook – Consolidation Breakdown in Progress
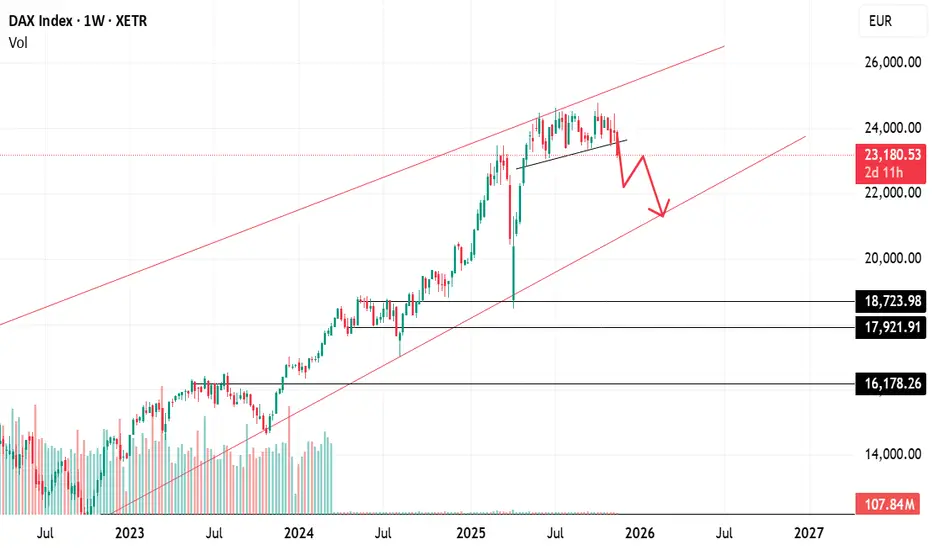
The DAX has been moving in a broad 7-month consolidation range, showing neither a clear uptrend nor a downtrend. Such long consolidations often act as distribution zones, where smart money gradually exits positions before a larger move begins.
Consolidation Breaking on the Downside
This week, the index is attempting to break below the lower boundary of this consolidation range. A downside break after months of sideways action is usually a strong bearish signal, especially on higher timeframes like the weekly chart.
Key Level – 23,000
The 23,000 zone is the critical level to watch:
If the DAX gives a weekly close below 23,000,
And we see follow-up selling next week,
…then it would strongly suggest that the distribution phase is complete, and the index may begin a sustained downward journey.
What This Means
A confirmed breakdown from multi-month consolidation often leads to:
Increased volatility
Trend acceleration
Deeper corrections toward the next major demand zones
For now, the weekly close will be crucial. A weak closing would confirm bearish sentiment and open the path for further downside.
Sachinindexanalysis
Bearish Signal in Dow Jones: Will 45,000 Hold?Dow Jones Analysis – Bearish Signal Emerges
The Dow Jones Industrial Average (DJI) has shown signs of weakness over the past couple of sessions. On Tuesday, the index formed a shooting star candlestick pattern — a classic reversal signal that often indicates exhaustion in the uptrend.
Yesterday, the shooting star was confirmed by a follow-up bearish candle, which strengthens the case that a short-term top may be in place for the index. This suggests that buyers are losing control, and sellers are stepping in at higher levels.
Key Support Zone – 45,000
The immediate and crucial support for DJI is placed around 45,000, a level that has held strong in the past. However, the index is now testing this zone again, and the price action shows clear weakness.
Trend Breakdown Adds to Bearish Bias
Looking at the chart, the trendline support is also at risk of breaking. If the index fails to hold 45,000 decisively, this breakdown could open the door for deeper correction, leading to further downside targets in the short term.
Conclusion
Bearish pattern confirmed: Shooting star + follow-up candle.
45,000 is key support: A breakdown here confirms bearish momentum.
Short-term top likely: Weakness could extend further if supports fail.
📉 For now, traders should stay cautious on DJI until it either reclaims higher levels or establishes fresh support below.

Nifty weak after failed retest – Key supports at 24,900–24,800📉 Nifty Outlook – Breakdown After Failed Retest
Nifty tried to retest the breakout zone of 25,150–25,250, but failed to hold above it. This rejection has shifted the structure towards weakness, and the index may now revisit crucial lower levels.
🔴 Failed Retest – A Bearish Signal
The zone of 25,150–25,250 was earlier acting as a breakout area. A successful retest would have confirmed strength for higher levels. However, Nifty failed to sustain, which indicates that buyers are losing control near this resistance.
📉 Next Support – Trendline Breakout Zone
The immediate support lies in the 24,900–24,800 band, which coincides with the earlier trendline breakout zone. If Nifty can stabilize here, a short-term bounce may still be possible.
⚠️ Deeper Downside Risk
If the 24,900–24,800 zone is broken on the downside, then the structure opens up for a deeper correction. In such a case, levels of 24,500–24,300 become very much possible in the coming sessions.
✅ Summary
Resistance rejected at 25,150–25,250
Weakness likely unless Nifty reclaims this zone
Supports at 24,900–24,800, below which 24,500–24,300 may come into play.
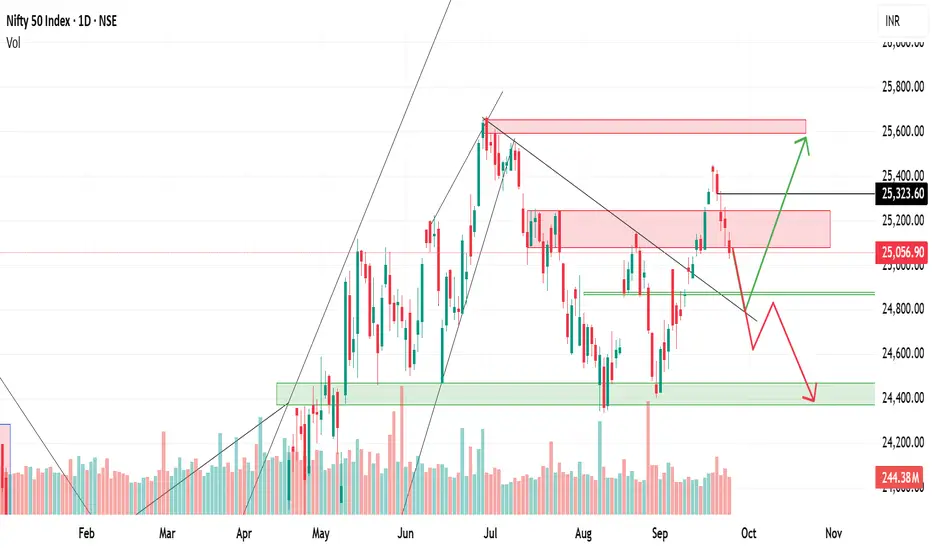
Nifty Eyes 25,500 if Breaks Out; Risk of 24,300 if RejectedNifty bounced strongly from the 24,450–23,350 support zone and is now approaching the 25,100–25,250 resistance band. If it sustains above this level, it will confirm a double bottom pattern and open the path toward 25,500–25,600. However, if Nifty faces rejection at this resistance, it may again slip back to test the 24,400–24,300 zone. A retracement before breaking out is also possible, so next week’s price action will be crucial.
🔹 Bullish Case
Nifty bounced from the strong support zone of 24,450–23,350.
Now trading near the 25,100–25,250 resistance zone.
If it sustains above this band, it confirms a double bottom breakout.
Upside targets will be 25,500–25,600 in the short term.
🔹 Bearish Case
If Nifty fails to cross 25,100–25,250 and faces rejection,
Selling pressure may drag it back toward the 24,400–24,300 support zone.
A breakdown below this could extend weakness further.
🔹 Retracement Scenario
Nifty may first retrace a bit lower from current levels,
Then reattempt the breakout above 25,100–25,250 after retesting.
This would be a healthier breakout with stronger follow-through.
✅ Summary: Next week is crucial — a sustained breakout above 25,250 is bullish, while rejection may send Nifty back toward 24,400–24,300. Retracement before breakout is also possible.

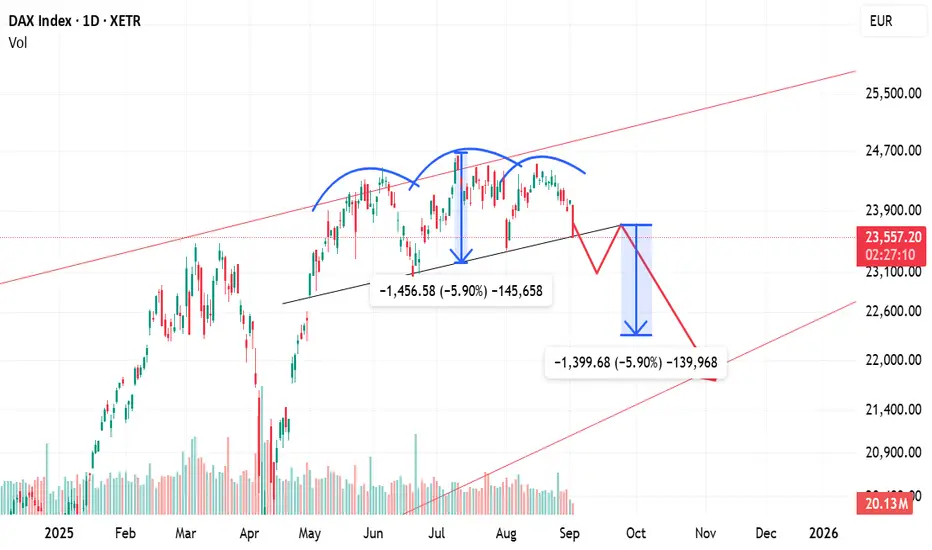
Head & Shoulders on DAX Daily Chart – Watch for BreakdownThe DAX index is currently forming a Head and Shoulders pattern on the daily chart, a well-known bearish reversal formation. This pattern typically signals a potential shift in trend from bullish to bearish if the breakdown occurs.
Left Shoulder – Formed when prices peaked, followed by a correction.
Head – A higher peak, marking the top of the uptrend, followed by another decline.
Right Shoulder – A lower high compared to the head, showing weakening bullish momentum.
Neckline – The key support line connecting the lows between the shoulders and the head.
⚖️ Implications
If the DAX breaks below the neckline with strong volume, it will confirm the pattern.
This breakdown could trigger further downward momentum, with potential targets calculated by measuring the distance from the head to the neckline and projecting it downward.
✅ Summary
Pattern: Head & Shoulders (bearish) on daily chart.
Trigger: Breakdown below the neckline.
Outcome: Increased probability of further decline, with downside targets extending to lower support zones.