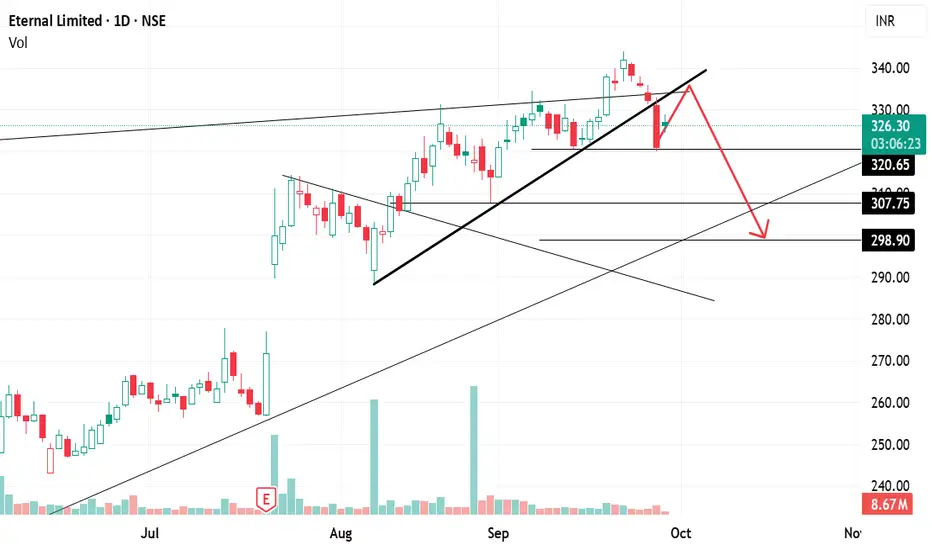
ETERNAL (Zomato): Breakdown Below Trendline ETERNAL (Zomato) had been on a strong bull run since April 2025, rallying from ₹195 to ₹344 🚀. Throughout this journey, the stock consistently respected an upward trendline, bouncing every time it touched the line.
But things changed on 26th September 2025:
❌ The stock broke down below the trendline support for the first time.
After the breakdown, it reached a low of ₹320, signaling that the structure had become weak
✨ 1. Trendline Signals (Daily Chart)
If we connect all the key highs of September 2024, December 2024, August 2025, and September 2025, we obtain a resistance trendline.
Recently, the stock gave a breakout above this trendline, but it failed to sustain and quickly slipped back below it.
This false breakout followed by weakness is often a bearish signal ⚠️.
📅 2. Short-Term View
Right now, the stock is hovering near ₹320, a critical support level.
If ₹320 breaks decisively, the weakness will get confirmed, and the stock may head toward:
🎯 ₹310
🎯 ₹300 (short-term target zone).
Until then, some retracement or sideways movement may happen, but the overall bias is weak.
🕰️ 3. Weekly Chart View (Bigger Picture)
Last week, the stock formed a bearish engulfing candle, where the body of the red candle completely covers the body of the previous green candle.
This pattern is a reversal signal, showing sellers overpowering buyers.
If this week’s close is below ₹320, it will confirm the bearish engulfing pattern ✅, adding further weight to the downside scenario.
📌 Summary:
🔻 Weakness Detected: Breakdown of trendline + false breakout on resistance.
⚠️ Confirmation Needed: Closing below ₹320 will confirm bearish engulfing and continuation of weakness.
🎯 Targets: If ₹320 breaks, next levels are ₹310 and ₹300.
🛡️ If ₹320 holds: Stock may bounce, but the overall structure remains fragile.
Sachinstockanalysis
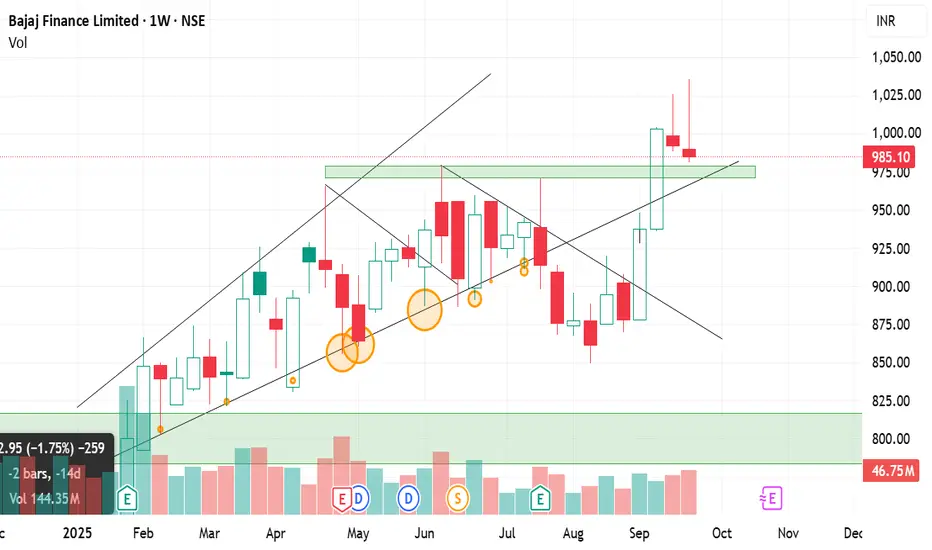
Bajaj Finance: Breakout, Retest & What’s Next?Bajaj Finance has been in focus ever since it broke its long-term resistance zone of ₹870–₹880 on 12th September 2025. This breakout was significant because the stock had been struggling to cross this level for a long time. Once it crossed, the stock quickly rallied and touched a high of ₹1036 🚀.
But the story has taken an interesting turn in the last two weeks. Let’s break it down in detail:
✨ 1. Weekly Chart View (Bigger Picture)
A shooting star candle formed last week. This is a bearish reversal pattern that occurs when the price moves higher but closes near the lows, showing that sellers took control.
This week, once again, a second shooting star appeared, and what’s more important is that it closed lower than last week’s close.
This back-to-back formation is a strong sign that buyers are losing momentum and sellers are active at higher levels.
📅 2. Daily Chart View (Short-Term Action)
After the breakout above ₹870–₹880, the stock pulled back and is now retesting this breakout zone.
This level is crucial because:
It is a classic breakout-retest scenario.
The same zone also coincides with a trendline support, adding strength to this level.
If the price bounces from this zone, it will confirm the breakout as valid and can lead to another leg up.
📌 3. Key Levels to Watch
Strong Support: ₹870–₹880 (breakout + trendline support).
Upside Potential: If the stock holds above this zone, it can retest ₹1000+ levels in the short-to-medium term.
Downside Risk: If the stock decisively breaks below ₹870–₹880, then the structure weakens, and the stock can slip towards ₹900 or even lower.
⚖️ 4. Market Sentiment & Interpretation
Two weekly shooting stars show weakness and profit-booking at higher levels.
But since the stock is still above the breakout zone, bulls still have a chance to defend the trend.
The coming sessions are critical — holding above 870–880 means bulls are in control, but if broken, sellers will dominate.
👉 Summary
🔻 Weakness spotted: Two weekly shooting stars confirm selling pressure.
🛡️ Support zone (₹870–₹880): This is the line in the sand for bulls.
⚠️ If broken: A medium-term fall toward ₹900 (or lower) is likely.
🚀 If defended: The stock can bounce and resume its upward journey, possibly retesting ₹1000–₹1036.