Maruti Hits the Brakes ?🚗 Maruti Hits the Brakes: Bearish Engulfing Signals a Possible Correction Ahead!
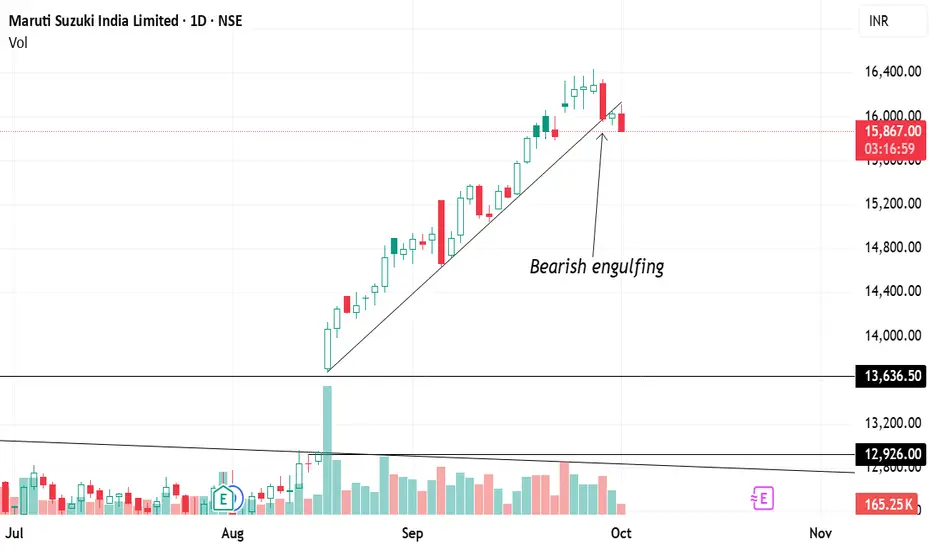
Maruti Suzuki has been one of the strongest performers in the market since August 2025, rallying nearly 35% in just two months 📈. The uptrend was further boosted after the GST cut reform, which led to a huge gap-up opening. From there, the stock followed a clear trendline support, steadily moving higher week after week.
But now, the charts are flashing caution signals ⚠️:
✨ 1. Daily Chart View
On 29th September 2025, Maruti formed a bearish engulfing candle.
This isn’t just an ordinary candle — it engulfed the previous four trading sessions’ candles, showing strong selling pressure.
Such a large engulfing candle often signals a trend reversal, especially after a sharp rally.
📅 2. Weekly Chart View (Bigger Picture)
For the past 8 straight weeks, Maruti delivered green candles — a remarkable bullish run.
This week, the weekly chart is also showing the formation of a bearish engulfing pattern (although two days remain for confirmation).
If this pattern holds at the close, it would indicate that momentum has shifted from buyers to sellers.
📌 3. Trendline Break
The uptrend since August was guided by a well-respected trendline.
This trendline now appears to be broken, which adds further confirmation that the bullish momentum has weakened.
⚖️ 4. What This Means
🔻 Bearish Signal: A strong bearish engulfing candle after a steep rally is a textbook sign of a potential correction.
⛔ Trendline Broken: Losing the trendline suggests the uptrend structure is failing.
📉 Correction Likely: After a 35% run-up, profit booking and a healthy pullback seem due.
👉 Summary
Maruti’s spectacular run since August may have finally hit a wall. With a daily bearish engulfing candle, a trendline breakdown, and the weekly bearish engulfing pattern forming, the probability of a correction is high.
Disclaimer:- I have a short position on the Stock.
#Nifty #StockMarket #stockmarketsindia #SachinCharts #stockmarketcrash #Epic202426 #SachinStockChart #Maruti #Auto #SachinStockAnalysis
Sachinstockcharts
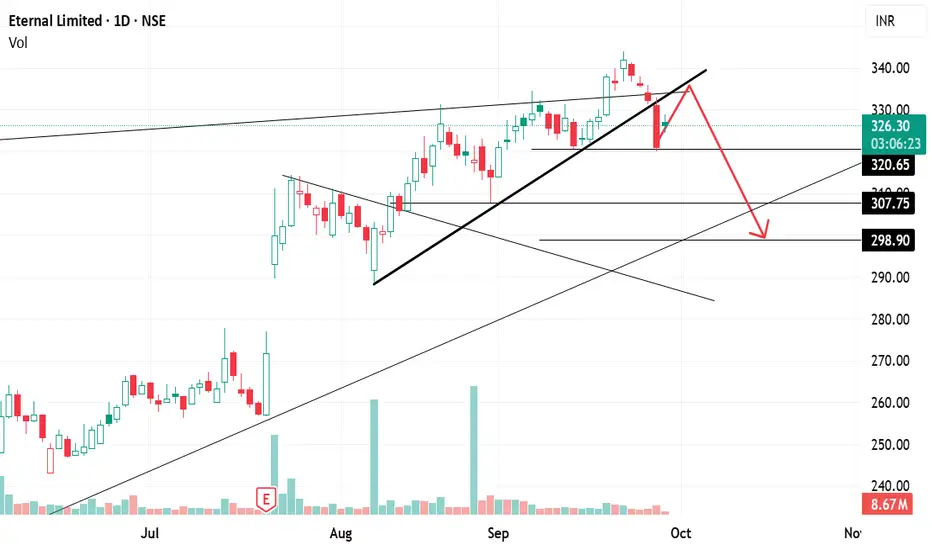
ETERNAL (Zomato): Breakdown Below Trendline ETERNAL (Zomato) had been on a strong bull run since April 2025, rallying from ₹195 to ₹344 🚀. Throughout this journey, the stock consistently respected an upward trendline, bouncing every time it touched the line.
But things changed on 26th September 2025:
❌ The stock broke down below the trendline support for the first time.
After the breakdown, it reached a low of ₹320, signaling that the structure had become weak
✨ 1. Trendline Signals (Daily Chart)
If we connect all the key highs of September 2024, December 2024, August 2025, and September 2025, we obtain a resistance trendline.
Recently, the stock gave a breakout above this trendline, but it failed to sustain and quickly slipped back below it.
This false breakout followed by weakness is often a bearish signal ⚠️.
📅 2. Short-Term View
Right now, the stock is hovering near ₹320, a critical support level.
If ₹320 breaks decisively, the weakness will get confirmed, and the stock may head toward:
🎯 ₹310
🎯 ₹300 (short-term target zone).
Until then, some retracement or sideways movement may happen, but the overall bias is weak.
🕰️ 3. Weekly Chart View (Bigger Picture)
Last week, the stock formed a bearish engulfing candle, where the body of the red candle completely covers the body of the previous green candle.
This pattern is a reversal signal, showing sellers overpowering buyers.
If this week’s close is below ₹320, it will confirm the bearish engulfing pattern ✅, adding further weight to the downside scenario.
📌 Summary:
🔻 Weakness Detected: Breakdown of trendline + false breakout on resistance.
⚠️ Confirmation Needed: Closing below ₹320 will confirm bearish engulfing and continuation of weakness.
🎯 Targets: If ₹320 breaks, next levels are ₹310 and ₹300.
🛡️ If ₹320 holds: Stock may bounce, but the overall structure remains fragile.
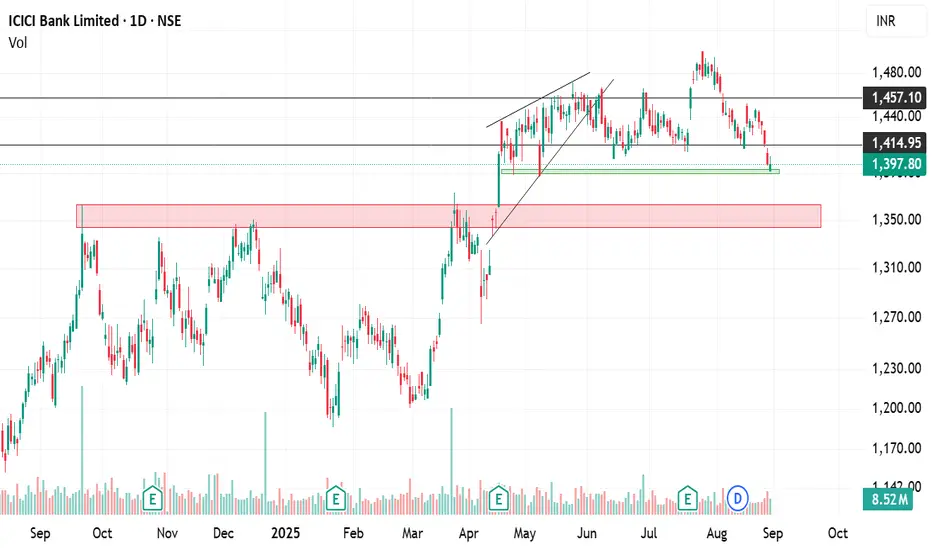
ICICI Bank Under Pressure: Breakdown Could Open ₹1,360–1,340ICICI Bank has been exhibiting persistent weakness over the past few sessions, underperforming relative to the broader market and showing clear signs of profit-booking. Despite being one of the stronger banking names in the past, the stock has recently struggled to sustain upward momentum, reflecting near-term bearish undertones.
Currently, ICICI Bank is trading around a crucial support band of ₹1,400–1,390. This zone has historically acted as a strong base, where buying interest has emerged in the past. However, repeated testing of this support without a meaningful bounce raises concerns about its sustainability.
A decisive breakdown below ₹1,390 could accelerate weakness and potentially drag the stock towards ₹1,360 and ₹1,340 levels, which are the next major support zones. These levels are important markers that could determine the medium-term trend.
On the upside, for sentiment to improve, the stock must sustain above ₹1,400–1,420 with strong volumes. Until then, caution is advised, as the undertone remains weak, and any breakdown may invite further selling pressure.
SBICARD at Key Level: Watch ₹780 Support, ₹830 BreakoutSBICARD is currently displaying a double bottom pattern on the daily chart — a bullish reversal setup that typically forms after a downtrend. This pattern signals that the stock is attempting to establish a strong base and could be preparing for an upward move.
⚖️ Key Levels to Watch
Support Zone: As long as SBICARD holds above ₹780, the structure remains strong and the pattern is valid. A breakdown below this level could weaken the setup.
Breakout Confirmation: A closing above ₹830 will serve as bullish confirmation of the double bottom breakout.
Upside Targets: Once confirmed, the stock has potential to rally toward ₹860–880 levels in the short term.
✅ Summary
In short, SBICARD is in a consolidation phase, attempting to break out from a double bottom. Holding above ₹780 keeps the bullish bias intact, while a breakout above ₹830 can trigger the next leg higher.

Maruti’s Bearish Engulfing – Will We Get Confirmation?Maruti has formed a bearish engulfing candle on the daily chart today, which is a strong reversal signal when it appears after a rally. This pattern suggests that sellers have overpowered buyers.
⚖️ Importance of Confirmation
A bearish engulfing pattern requires a confirmation candle (a red follow-through candle on the next day) to validate the setup.
We’ve seen this before: on 4th September, Maruti also formed a bearish engulfing, but on 5th September, the follow-up candle was missing, which invalidated the bearish setup at that time.
Hence, waiting for tomorrow’s confirmation is crucial to avoid a false signal.
✅ Key Levels & Targets
If we get the confirmation candle tomorrow, then downside levels of ₹14,600 → ₹13,600 → ₹12,900 could unfold in the short to medium term.
On the flip side, if no confirmation comes, the pattern may fail just like in early September, and the stock could remain range-bound or resume upward momentum.

NVDA Breaks Trendline, Eyes $155–150 SupportNVIDIA recently gave a trendline breakdown on the chart, indicating that bullish momentum has weakened. After the breakdown, the stock also retested the broken trendline from below, which is a common technical behavior — often referred to as a breakdown and retest pattern. This confirms that the broken trendline has now turned into a resistance level.
⚖️ Implications
Since the retest failed to reclaim the trendline, selling pressure is likely to continue.
The stock is now vulnerable to further downside and may gradually drift lower.
The immediate support zone lies at $155–150, which coincides with prior demand areas where buying interest previously emerged.
✅ Key Levels
Resistance (Invalidation): The broken trendline — if price reclaims and sustains above it, bearish momentum weakens.
Support: $155–150 zone (short-term target area).
Trend Bias: Bearish as long as the stock trades below the retested trendline.

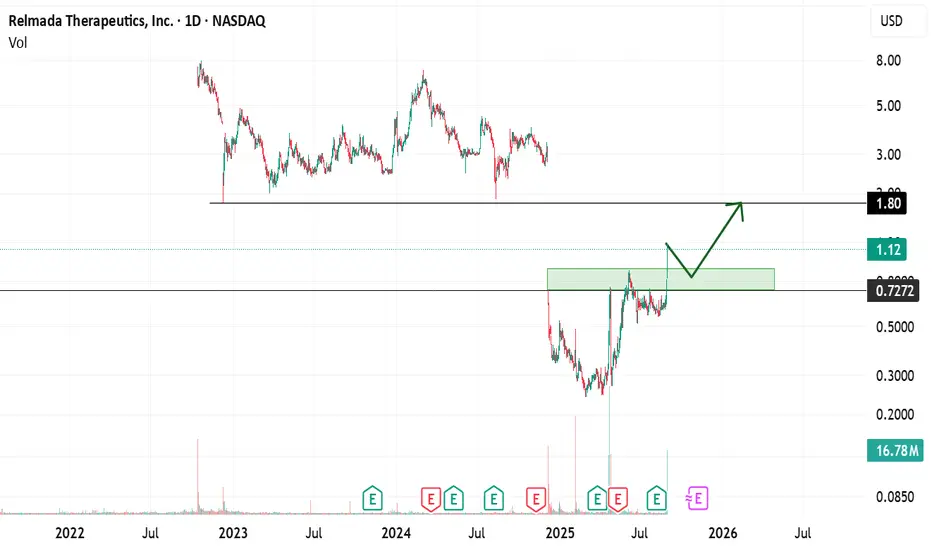
RLMD — Breakout After 10-Month ConsolidationRLMD has finally broken out above its long-standing resistance after nearly 10 months of consolidation. The breakout is supported by good volume, which adds strength and reliability to the move.
🔑 Why This is Significant
Long consolidation: When a stock trades sideways for months, it builds strong accumulation. Once price escapes the range, moves are often sharp and sustained.
Volume confirmation: Breakouts on higher-than-average volume signal real demand, reducing the chances of a false breakout.
Gap to fill: There’s a price gap up to $1.70. Gaps act like magnets — if the breakout holds, price often travels to fill them.
🎯 Levels to Watch
Breakout trigger: $0.70 → needs to sustain trading above this level.
Immediate targets: $1.40 → $1.70 (gap-fill).
Invalidation: A daily close back below $0.70 would signal a failed breakout and likely return to consolidation.
✅ Conclusion
As long as RLMD holds above $0.70, bias stays bullish with a possible gap-fill move toward $1.70. Traders should watch for retests of $0.70 acting as support, along with continued volume confirmation.
Bounce or Breakdown? HDFC Bank at Crucial Support BandHDFC Bank has been under sustained pressure over the past few sessions, reflecting both stock-specific concerns and broader market volatility. The stock has failed to participate meaningfully in the recent market upmove, which highlights underlying weakness in its structure. Selling pressure has intensified, and price action shows that the stock is struggling to hold above key support zones.
At present, HDFC Bank is trading around a crucial support band of ₹950–₹940. This zone has historically acted as an important demand area, where buyers have stepped in to defend the price. However, the inability of the stock to bounce strongly from this range in recent days raises caution.
A decisive breakdown below ₹940 may trigger further weakness, opening the door for a slide toward ₹930, ₹900, and even ₹870 levels in the near term. These levels are important psychological and technical supports, and a test of them cannot be ruled out if selling continues.
Overall, unless the stock manages to sustain and bounce above ₹950 with strong volumes, the undertone remains weak. The coming sessions will be crucial to determine whether HDFC Bank stabilizes at this support zone or extends its downtrend.

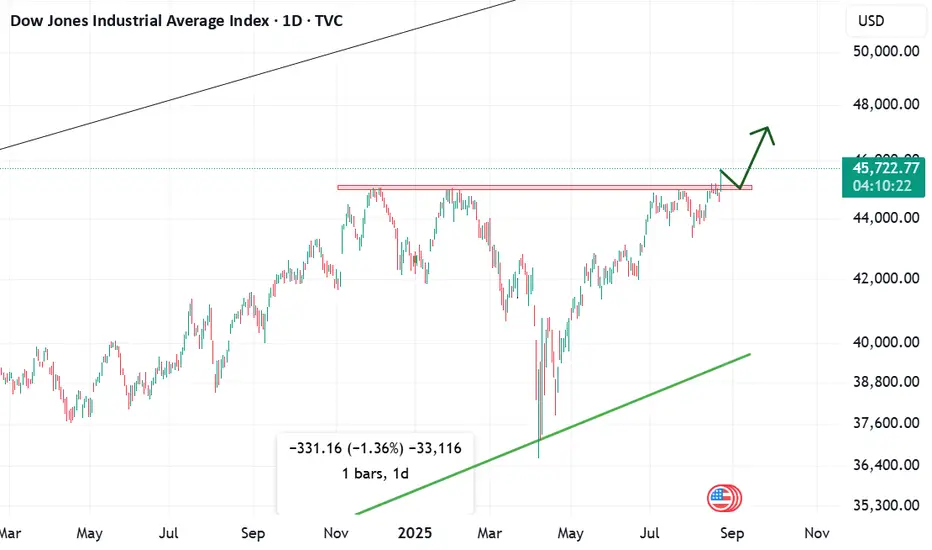
Chart Analysis - Dow Jones (Breaking Important Resistance)The US30 index has successfully broken through an important resistance level today, which is a key technical development. This breakout suggests the potential beginning of a strong bullish trend, provided the index is able to sustain itself above the red zone. If it continues to hold above this zone, buyers will likely remain in control, paving the way for higher upside targets in the coming sessions.
However, if the index fails to stay above this red zone and falls back below it, the breakout will be considered a false breakout, which could lead to renewed selling pressure and possible downside movement. In short, the red zone is the make-or-break level that will decide whether the trend continues upward or reverses.
Green or Red Which path Bajaj Finance will take ?Bajaj Finance is currently consolidating, showing potential for a strong move in either direction. A bullish breakout could lead to an uptrend, while a bearish breakdown may signal a decline. The stock is forming a base, and whichever path it takes next may define its trend for the coming weeks.
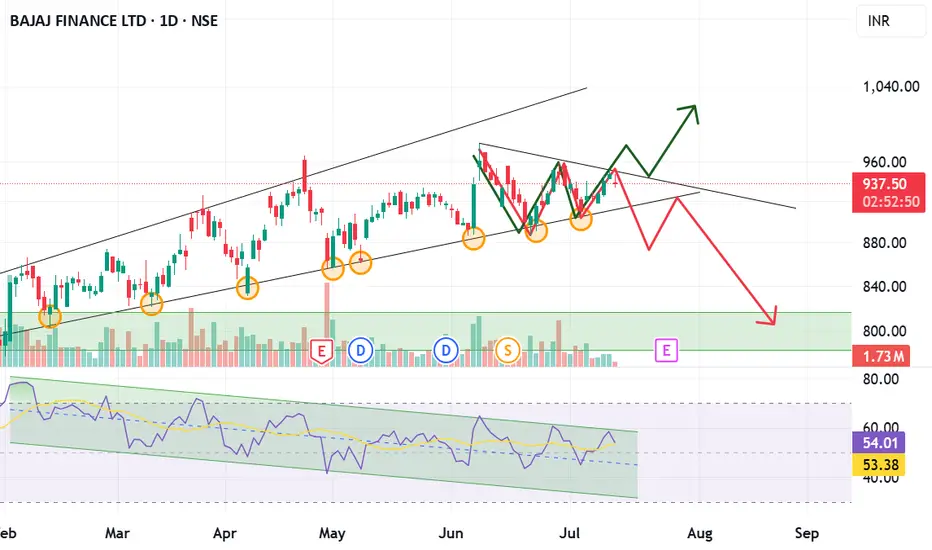
Bajaj Finance – Bearish Divergence and Short Bajaj Finance is currently exhibiting a classic bearish divergence, which is a well-known signal in technical analysis indicating a potential trend reversal or weakness in the ongoing uptrend.
1. Price Action – Upward Trending Channel
The stock price of Bajaj Finance has been making higher highs and higher lows, forming a well-defined upward channel.
This typically suggests a strong bullish momentum, where buyers are in control, and the price continues to rise steadily.
2. RSI Indicator – Downward Channel
In contrast to the price, the Relative Strength Index (RSI) – a momentum oscillator – is not confirming the bullish trend.
The RSI is forming a downward channel, with lower highs and lower lows over the same time period.
This means that while the price is moving higher, the momentum behind the move is weakening.
3. Bearish Divergence
This mismatch between price movement and RSI is called a bearish divergence.
It often signals that the upward trend may soon lose strength or reverse, as the underlying buying momentum is fading.
Divergences are typically seen as early warning signs by technical traders.
4. Trade Setup – Good Short Opportunity
Given the divergence, Bajaj Finance presents a high-probability short trade setup.
Conclusion:
The divergence between Bajaj Finance’s rising price and its declining RSI suggests that the bullish momentum is unsustainable. This creates a good opportunity to consider shorting the stock, especially for traders looking for setups with strong technical justification and attractive risk-reward profiles.
Always ensure risk management is in place before entering the trade.
