SAIL - Weekly - LongThis is a weekly chart of the SAIL, so it is useful for positional or swing trading.
First, let’s understand the trend based on the markings.
Earlier on the left side, the stock was making lower highs and lower lows, which clearly shows a downtrend. This phase is marked with “lower low” arrows. After that, the selling pressure reduced and the price started stabilizing. From the middle of the chart onward, you can see the structure changing. The stock started making higher lows. This is the first sign that the downtrend is ending and accumulation is happening. Later, the price moved above the 20 EMA and started respecting it as support. Each dip near the 20 EMA formed a higher low, which confirms a trend shift from downtrend to uptrend.
Now, focus on the 20 EMA.
In the recent candles, price is staying above the 20 EMA. The candle marked as “elephant bar above 20 EMA” shows strong buying interest. A large green candle closing above the moving average usually indicates strength and momentum returning to the stock. As long as price stays above the 20 EMA on a weekly closing basis, the trend remains positive.
Resistance and breakout view.
There was a clear resistance zone around the 139–140 area. The price has now moved above this level, which is marked as “resistance broken”. When an old resistance is broken, it often turns into support. This breakout improves the probability of further upside.
Volumes analysis.
Volume was relatively low during the sideways and base formation phase. Recently, volume has expanded on the bullish candle, which is marked as “high volumes”. This is important because a breakout with higher volume shows genuine participation and not just a weak bounce. Rising price with rising volume supports the bullish view.
RSI analysis.
RSI is around the 60–65 zone. This indicates strength but not overbought conditions. RSI staying above 50 usually supports an uptrend. Since RSI is rising and comfortably above 50, it confirms positive momentum. There is still room for upside before RSI reaches extreme levels.
Overall trend conclusion.
The structure has shifted from lower lows to higher lows. Price is above the 20 EMA, resistance is broken, volume is supporting the move, and RSI confirms strength. All these signals together indicate a bullish trend on the weekly timeframe.
Entry plan.
A safer entry would be on a small pullback towards the broken resistance zone or near the 20 EMA, around 138–142, if price shows support in this area. Aggressive traders can also enter on a weekly close above the breakout level if the next candle holds above it.
Stop loss placement.
Stop loss should be below the recent higher low or below the 20 EMA on a weekly closing basis. A practical stop loss zone would be around 128–130. This keeps you protected if the breakout fails.
Targets and risk management.
The first target can be near the previous swing resistance around 155–160. If momentum continues, the next positional target can be near 168–170.
Risk only a small portion of your capital on this trade, ideally 1–2 percent. Position size should be calculated based on the distance between entry and stop loss. Do not move the stop loss upward too quickly; let the trade breathe as long as the price respects the 20 EMA.
In simple words, this chart shows a clear trend reversal into an uptrend. Patience, disciplined entry near support, and strict risk management are the key to trading this setup safely.
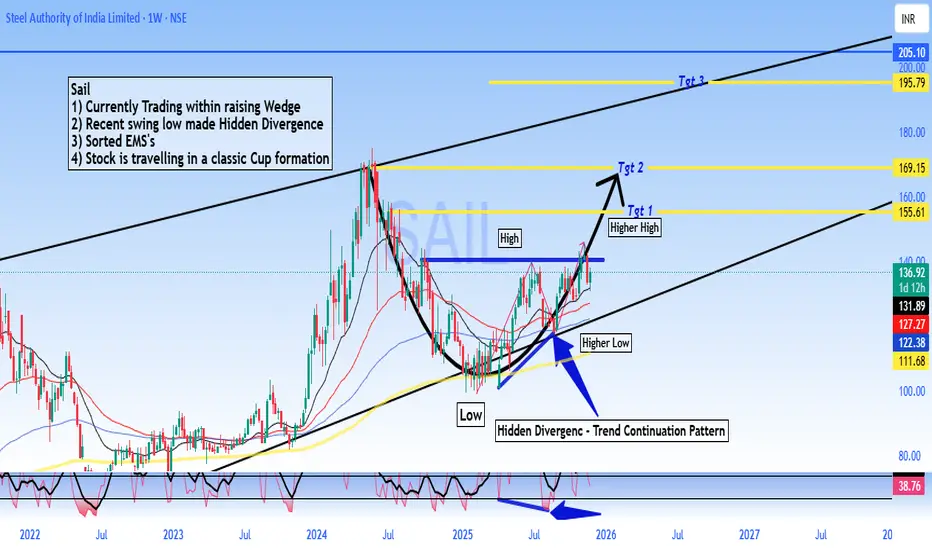
Sail

SAIL - Buy - Technical Analysis# Steel Authority of India Limited (SAIL) - Technical Analysis Report
Current Price: 136.92
Timeframe: Weekly Chart Analysis
Technical Setup Overview
SAIL is presenting a compelling technical picture with multiple bullish indicators aligning for a potential significant upward move. The stock is currently trading within a well-defined rising wedge pattern and has recently formed a **Hidden Divergence** on the weekly chart - a classic trend continuation signal.
Key Technical Observations
Rising Wedge Pattern:
The stock is trading within a rising wedge formation, which typically indicates consolidation before a breakout. The current price action suggests the stock is in the later stages of this pattern.
Hidden Divergence - Bullish Continuation Signal:
A **Hidden Divergence** has formed on the weekly timeframe.
- This pattern typically signals trend continuation and suggests the uptrend is likely to resume with strength
Sorted EMA Structure:
The Exponential Moving Averages are properly aligned, indicating a healthy bullish trend structure with multiple moving averages providing dynamic support.
Cup Formation in Progress:
The stock appears to be carving out a **classic Cup pattern**, which is a well-known bullish continuation formation. This pattern suggests accumulation and potential for a significant breakout move.
Price Targets & Projections
Based on the technical structure, here are the potential price targets:
Target 1: 155.61 (Higher High breakout level)
Target 2: 169.15
Target 3: 195.79
These targets are derived from the pattern structure and represent key resistance zones where profit-taking may occur.
Trading Strategy Considerations
For Swing Traders:
- Current levels offer a potential entry opportunity for medium to long-term positions
- A move above ₹140 could confirm the continuation pattern
- Stop loss can be placed below the recent higher low at 122 for risk management
Risk Factors to Monitor
- Failure to hold above ₹122 would invalidate the bullish hidden divergence
- Breakdown below the rising wedge support would change the outlook
- Sector performance and broader market conditions should be monitored
- Steel industry fundamentals and commodity price trends
🔔 Conclusion
SAIL is exhibiting strong technical characteristics with the Hidden Divergence pattern, sorted EMA structure, and cup formation all pointing toward potential upside. The current price action within the rising wedge presents an interesting risk-reward setup for traders and investors with appropriate risk management.
DISCLAIMER
This analysis is for educational and informational purposes only and should NOT be considered as investment advice or a recommendation to buy, sell, or hold any securities. - I am not a SEBI registered analyst or investment advisor - This is purely a technical analysis based on chart patterns and indicators - Past performance and technical patterns do not guarantee future results - Trading and investing in stocks involves substantial risk of loss - Always conduct your own research and due diligence before making any investment decisions - Consult with a qualified financial advisor before taking any investment positions - The author holds no responsibility for any profits or losses incurred based on this analysis - Risk management and position sizing are crucial - never invest more than you can afford to lose
**Trade/Invest at your own risk. Do your own analysis.**
#SAIL #SteelAuthorityOfIndia #StockMarket #TechnicalAnalysis #NSE #IndianStocks #ChartAnalysis #TradingView #StockTrading #HiddenDivergence #CupPattern #PriceAction #SwingTrading #Investing #MarketAnalysis #SteelSector #Commodities #TradingStrategy #ChartPatterns #TechnicalIndicators
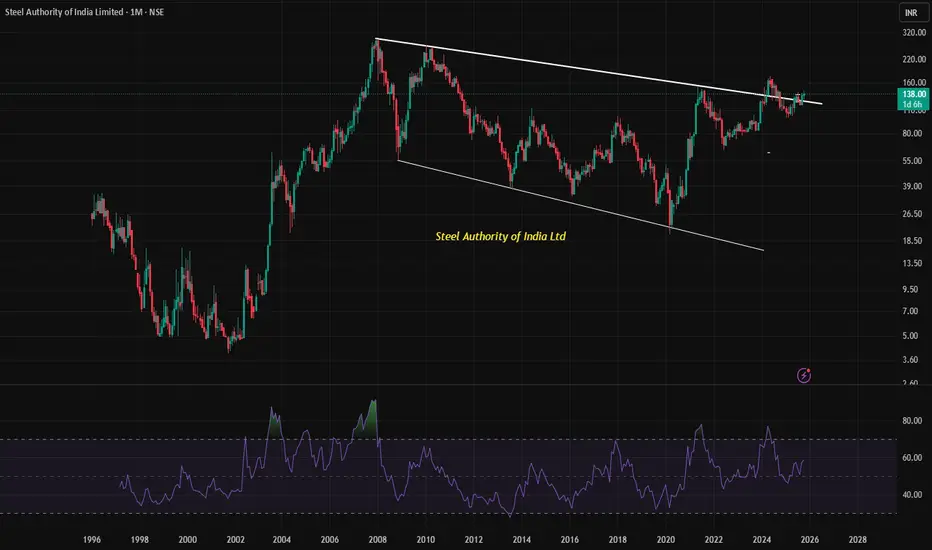
SAIL is seen sustaining breakout of 17-year downtrend channelSAIL is seen sustaining the breaking out of a 17-year downtrend channel on monthly charts, signaling a potentially powerful long-term reversal.
📈 Steel Authority of India (SAIL): Breaking Free from a 17-Year Technical Grip
Steel Authority of India Ltd. (SAIL), one of India’s largest steel producers, is currently trading around ₹138.80 and showing signs of a major technical breakout. What makes this move noteworthy is that it’s emerging from a downward-sloping channel that has persisted since 2007–2008, spanning nearly 17 years. A breakout from such a long-term pattern is rare and often carries significant implications for future price action.
🔍 Understanding the Downtrend Channel
A downtrend channel is formed when a stock consistently makes lower highs and lower lows, bounded by parallel trendlines. For SAIL, this channel has defined its price movement for over a decade, acting as a ceiling that repeatedly rejected upward momentum. Breaking above this channel suggests a shift in market sentiment—from bearish to bullish.
📊 Monthly Chart Breakout: Why It Matters
Timeframe strength: Monthly chart breakouts are considered more reliable than daily or weekly ones because they reflect long-term investor behavior.
Volume confirmation: Sustained breakout levels often coincide with increased trading volume, indicating institutional interest.
Psychological shift: Surpassing a multi-year resistance level can trigger a wave of buying from traders who were previously cautious.
📈 Technical Indicators Support the Move
According to recent technical analysis:
📊 RSI Confirms Strength
The Relative Strength Index (RSI), a key momentum indicator, is currently moving in the 50–70 range, with recent readings around 58.42. This range is considered a bullish zone, indicating that buying momentum is building without the stock being overbought. Sustained RSI levels above 50 often precede further upward movement, especially when aligned with a breakout.
Price is above both 50-day and 200-day SMAs, reinforcing the strength of the breakout.
These indicators collectively suggest that the breakout is not just a short-term anomaly but part of a broader trend reversal.
🧠 Investor Takeaway
SAIL’s breakout from a 17-year downtrend channel is a textbook example of a long-term technical reversal. With supporting indicators like RSI, MACD, and moving averages aligning in favor of bulls, this move could mark the beginning of a sustained uptrend. Traders and investors may consider this a strong technical setup, but should also factor in macroeconomic conditions and sector fundamentals before making decisions.
Live chart Example
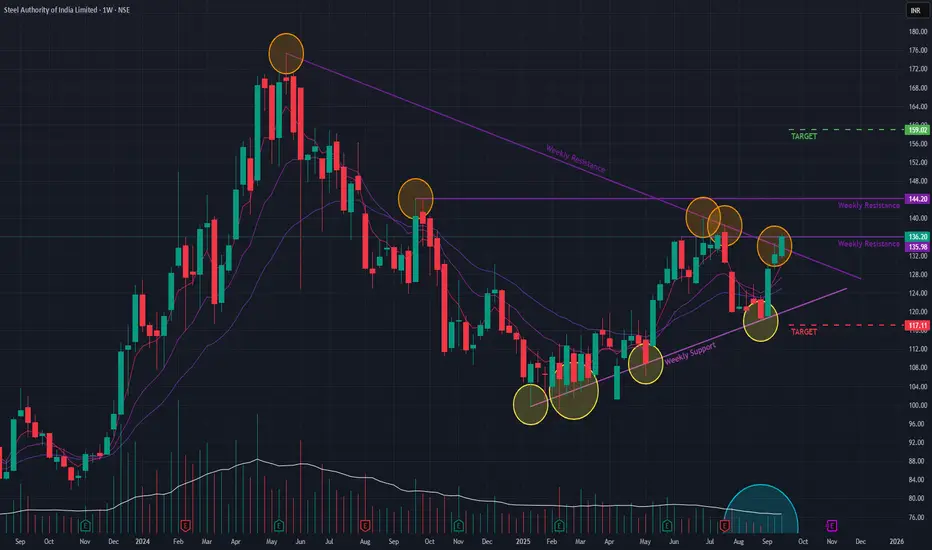
SAIL (Weekly) - Can it SAIL past the resistances ?SAIL is showing signs of a potential turnaround after a prolonged downtrend that began in May 2024. This week, the stock executed a significant breakout from a long-term angular resistance trendline , a move accompanied by a healthy increase in volume and a price surge of +2.98% .
This bullish development follows a period of consolidation that began after the downtrend reversed in January 2025. The stock is now testing a key short-term resistance level.
Bullish Indicators to Note 👍
The positive outlook is supported by the following technical signals:
- Breakout Confirmation: The move through the long-term trendline was validated by a notable increase in trading volume , indicating strong buyer participation.
- Momentum: Short-term Exponential Moving Averages (EMAs) are in a positive crossover , signaling building upward momentum.
Immediate Hurdles Ahead 🚧
Despite the positive momentum, a sustained rally depends on the stock's ability to overcome two significant upcoming resistance levels . The price action in the upcoming week will be crucial to watch for confirmation of the breakout's strength.
Future Outlook and Key Levels
- Bullish Case 📈: If the stock successfully breaks through the immediate resistances and the upward momentum continues, the next potential price target is ₹159 .
- Bearish Case 📉: However, if the stock fails to clear these hurdles and momentum wanes, a pullback towards the support level of ₹117 is possible.
SAIL (Bird view) By KRS Charts28th May 2025 / 10:17AM
Why SAIL??
1. As we can see from above chart, it clearly turning Bullish Trend stock from Berish .
2. Fundamentally its Durable and is at decent valuation right now.
3. Technically, in 1D TF fake selling and Gap Down is visible showing sellers got trapped. Such move market gives when they need liquidity, and this can happen both the side.
4. Further Bullish traits Sell candles volume is getting lower and allover lower than bullish candles. which usually noticed when Stock turned bullish on bigger cycles.
5. 100 EMA is underneath in many significant timeframes which also indicates buyers had shown more interest in past and likely this time as well.
Targets and Stop Loss is mentioned in Chart.
Note: This is 1M TF view will be Medium to Long Term

#SAIL#SAIL has corrected about 40% from recent swing high and currently trading near 61.8% retracement zone + weekly 200 ema and parallel channel support confluence zone. On weekly tf, it is probably trying to make a double bottom.
Historidally, when it gave a breakdown below weekly 200 ema and unable to sustain above it, it continued to underperform for almost 8-10 years but now it is probably trying to take support around it.
Also, RSI is making HLs off late, which is probably a good sign.
In terms of R:R, this is currently a good bet on long side.
As usual, DYOR and this isn't a Buy or Sell reco - but just an educational purpose post

Nifty may give more downside soon As expected in yesterday's commentary we did see a pullback in NSE:NIFTY and it also closed below yesterday's support.
Today again we have a supply candle in the index. Sellers have exceeded Buyers by 62 million volume. You can also see on chart that momentum is also falling Which means selling can continue.
However, tomorrow is weekly expiry so more of a tight Sideway day is expected.
Support would be 25395 and Resistance 25495. If breaks above this and settles for few hours then 25600 would be next target. If we drift below the support then 25333 is the next crucial point downward.
For NSE:BANKNIFTY the next Support is 56100. Resistance at 57280.
I am not opening any new positions just doing momentum trading like I did in NSE:SAIL today. Will be doing same until the Pivot Low is created at weekly support.
NSE:CNXPSUBANK Index still on momentum so keep it on radar and find out a good setup.
That will be all. Take care. Have a profitable tomorrow.
#Learning is Earning 📚

SAIL showing signs of reversal: Worth taking the small risk!⚡ Price Analysis:
1️⃣ Price near trendline support.
2️⃣ Price tapped the demand zone in higher tf.
3️⃣ Price structure need to form HH-HL to confirm the trend reversal.
⭐ Key Observations:
➡️ Expecting some good momentum buildup else there is a risk of a breakdown on the lower side.
➡️ All timeframes aligned for potential upside move.
➡️ Perfect RRR (Risk-Reward Ratio) setup forming at these levels.
⚠️ Disclaimer: This is NOT a buy/sell recommendation. This post is meant for learning purposes only. Views are personal. Please, do your due diligence before investing.⚠️
💬 What are your thoughts on this share it in the comments below. ✌️
🔥 Happy Trading!✅🚀

SAIL - At strong supportAt strong support
Strong support area 108 - 110
Upside strong resistance - 117
Next resistance - 125
Risk to reward - Excellent
Expecting to take support and finally break the trend line this time

Selected SAIL for Intraday
In this analysis of SAIL, we observe a potential bullish setup for intraday
Trigger Level: If the price breaks marked level, it may indicate further upside movement.
Target: Adjust based on price action dynamics.
⚠️ Disclaimer:
This analysis is for educational purposes only and is not a trading or investment recommendation. Please do your own research and consult a financial advisor before making any decisions.

SAIL for level 144.15
SAIL - CMP 117.75
RSI : 37.86
Below 50 EMA
Target 144.15
This stock is taking support from this level and showing strong upward moves as shown in the technical chart for your reference as RSI also confirms this but in the recent bearish move in market this is below 50 EMA.

SAIL Bullish setup for 1:4 risk reward Metal sector is near reversal, it has retested breakout level of 9493.
SAIL Also retested the breakout and made reversal with strong volume candle.
SWING TRADE
Buy SAIL
Above 131
Stop Loss: 125
Target 1 (1:2) 142
Target 2 (1:3) 148
Target 3 (1:4) 153
Duration 3-4 months
Trade as per your risk-taking capacity

Lux Industries Entered Strong Demand AreaLux industries entered into strong demand area and formed doubl bottom as an additional confirmation. All views are my personal, these posts are not a buy/sell recommendation. Contact your financial advisor before taking any buying decisions.

*SAIL cmp 143.00 by Monthly Chart views**SAIL cmp 143.00 by Monthly Chart views*
- 150 to 160 Resistance Zone Price Band
- Weekly basis Support at 124 > 105 > 83 with Resistance at 160 > 181 > 200
- *Cup and Handle and/or Double Rounding Bottoms as one may read and interpret*
- *Volumes decreasing month on month indicative of the strongly effective retracement from Resistance Zone*

NMDC CHART IS LOOKING BULLISHNMDC chart is turned bullish after trend line breakout. These all my views are personal, not a buy sell .

BEL IS LOOKING BULLISHBEL is looking bullish as its reacted from strong zone. If if closes above 295 more bullishness will be added. These all views are my personal and posting here only for educational purposes. These are not buy/sell recommendations. Better contact your personal financial advisor before go are investing into any stock.

metals are getting cold.metal stocks and index are not looking good for longs right now with global slowdown especially with china slowdown . any positive news from china for real estate sector will bring boost to metal prices.its not TA or FA but a opinion . avoid ferrous metal contracts/stocks . when time comes for long zinc/magnesium/coppper/aluminium are the ones that perform better than any other.
: just a educational guess and not a trading call for buy or sell.

Sali to 100%SAIL : Long-term gem just broke its line, took a step back, and now ready to soar! Aiming for double from where we are. Let's ride the wave! 🚢📈
🚨DYOR
🚨SL must, it depend's on your risk appetite

'Strongly Bullish' on SAIL for long term; Weekly Chart analysedThe stock hit a fresh 52-week high of 151.30 on 10th May 2021, but failed to hold on to the momentum, falling about 58% .
SAIL took support at the lower trendline of the wedge pattern on 21st June 2022 and bounced back from a 52W low of 63.60 to a high of 93.90 on 19th Jan 2023, rising about 47% .
In terms of price action, the stock is trading well above all the short-term and long-term moving averages.
RSI is above 50 and MACD gave bullish crossover above its signal line on 2nd March 2023.
Based on bullish moving averages and technical indicators, it is expected that the stock's price will continue to rise towards the assigned targets, with a recommended stop loss of 83 on a closing basis.

Sail on the Verge of Breakout..!Sail has been consolidating for a while. Taken support near 140 and waiting for triangle breakout. Can reach all time high if markets support..! maintain risk reward and follow strict stoploss..!

Just A View - SAIL📊 Script: SAIL
📊 Sector: Steel
📊 Industry: Steel
Key highlights: 💡⚡
📈 Script is trading at its support level, we may see some good rally from here.
📈 One can go for Swing Trade.
⏱️ C.M.P 📑💰- 147
🟢 Target 🎯🏆 - 162
⚠️ Important: Always maintain your Risk & Reward Ratio.
✅Like and follow to never miss a new idea!✅
Disclaimer: I am not SEBI Registered Advisor. My posts are purely for training and educational purposes.
Eat🍜 Sleep😴 TradingView📈 Repeat 🔁
Happy learning with trading. Cheers!🥂

SAIL: Steel Authority of India Ltd - Breakout ViewDate : 8-Jul-2024
Rating : Buy - Positional View
LTP : Rs. 155.61 (on 5-Jul-2024)
Targets: (1) Rs. 175 --> (2) Rs. 188 --> (3) Rs. 210
SL : Rs. 140 on daily close basis
Technical View:
• NSE:SAIL is in it's primary uptrend and was recently going through it's secondary downtrend.
• After touching the high of 175.35 on 22-May-2024, it has retraced 29% to 124.80 level.
• On 5-Jul-2024, NSE:SAIL has broke out from its secondary down trend with higher than average volume.
• NSE:SAIL is trading above 20 DMA, 50 DMA and 21 DEMA.
• RSI is trading at 54.16 and MACD is about give cross over.
• Looking strong to start a new swing from here.
Disclaimer : I am not a SEBI registered analyst/consultant and not recommending anyone to take any BUY or SELL position in stock market. Investing in stock market is risky and one should do a self analysis and validation before investing in stock market. Ideas are published for learning purpose only.

SAIL Key Technical Levels and AnalysisI am sharing my analysis of key levels for these stocks. Please note that they may not be accurate, as I am still learning.
