SAIL - Weekly - LongThis is a weekly chart of the SAIL, so it is useful for positional or swing trading.
First, let’s understand the trend based on the markings.
Earlier on the left side, the stock was making lower highs and lower lows, which clearly shows a downtrend. This phase is marked with “lower low” arrows. After that, the selling pressure reduced and the price started stabilizing. From the middle of the chart onward, you can see the structure changing. The stock started making higher lows. This is the first sign that the downtrend is ending and accumulation is happening. Later, the price moved above the 20 EMA and started respecting it as support. Each dip near the 20 EMA formed a higher low, which confirms a trend shift from downtrend to uptrend.
Now, focus on the 20 EMA.
In the recent candles, price is staying above the 20 EMA. The candle marked as “elephant bar above 20 EMA” shows strong buying interest. A large green candle closing above the moving average usually indicates strength and momentum returning to the stock. As long as price stays above the 20 EMA on a weekly closing basis, the trend remains positive.
Resistance and breakout view.
There was a clear resistance zone around the 139–140 area. The price has now moved above this level, which is marked as “resistance broken”. When an old resistance is broken, it often turns into support. This breakout improves the probability of further upside.
Volumes analysis.
Volume was relatively low during the sideways and base formation phase. Recently, volume has expanded on the bullish candle, which is marked as “high volumes”. This is important because a breakout with higher volume shows genuine participation and not just a weak bounce. Rising price with rising volume supports the bullish view.
RSI analysis.
RSI is around the 60–65 zone. This indicates strength but not overbought conditions. RSI staying above 50 usually supports an uptrend. Since RSI is rising and comfortably above 50, it confirms positive momentum. There is still room for upside before RSI reaches extreme levels.
Overall trend conclusion.
The structure has shifted from lower lows to higher lows. Price is above the 20 EMA, resistance is broken, volume is supporting the move, and RSI confirms strength. All these signals together indicate a bullish trend on the weekly timeframe.
Entry plan.
A safer entry would be on a small pullback towards the broken resistance zone or near the 20 EMA, around 138–142, if price shows support in this area. Aggressive traders can also enter on a weekly close above the breakout level if the next candle holds above it.
Stop loss placement.
Stop loss should be below the recent higher low or below the 20 EMA on a weekly closing basis. A practical stop loss zone would be around 128–130. This keeps you protected if the breakout fails.
Targets and risk management.
The first target can be near the previous swing resistance around 155–160. If momentum continues, the next positional target can be near 168–170.
Risk only a small portion of your capital on this trade, ideally 1–2 percent. Position size should be calculated based on the distance between entry and stop loss. Do not move the stop loss upward too quickly; let the trade breathe as long as the price respects the 20 EMA.
In simple words, this chart shows a clear trend reversal into an uptrend. Patience, disciplined entry near support, and strict risk management are the key to trading this setup safely.
Sailanalysis

SAIL : LongTrend: The stock is forming a cup and handle pattern, which is a bullish continuation setup. It has broken out above the neckline around 140 levels, showing strength. The trend has turned positive after a long consolidation phase.
Volume: There is a clear increase in volume during the breakout, which confirms buying interest. Higher volume on breakout weeks indicates that buyers are active and the move is supported by participation.
Momentum (MACD): The MACD line has crossed above the signal line, showing bullish momentum. The histogram is also in the green, confirming that momentum is strengthening.
RSI (Relative Strength Index): RSI is around 65, which shows the stock is gaining strength but not yet overbought. It suggests there is still room for the price to move higher.
ADX (Average Directional Index): ADX is around 21, which indicates that the trend is just beginning to gain strength. As it rises above 25, the uptrend will become more powerful.
Overall view: The breakout above 140 from the cup and handle pattern supported by volume and momentum indicators suggests a bullish outlook. The potential target as per the pattern is around 182. The trend looks positive as long as the price stays above the breakout zone.

SAIL (Bird view) By KRS Charts28th May 2025 / 10:17AM
Why SAIL??
1. As we can see from above chart, it clearly turning Bullish Trend stock from Berish .
2. Fundamentally its Durable and is at decent valuation right now.
3. Technically, in 1D TF fake selling and Gap Down is visible showing sellers got trapped. Such move market gives when they need liquidity, and this can happen both the side.
4. Further Bullish traits Sell candles volume is getting lower and allover lower than bullish candles. which usually noticed when Stock turned bullish on bigger cycles.
5. 100 EMA is underneath in many significant timeframes which also indicates buyers had shown more interest in past and likely this time as well.
Targets and Stop Loss is mentioned in Chart.
Note: This is 1M TF view will be Medium to Long Term

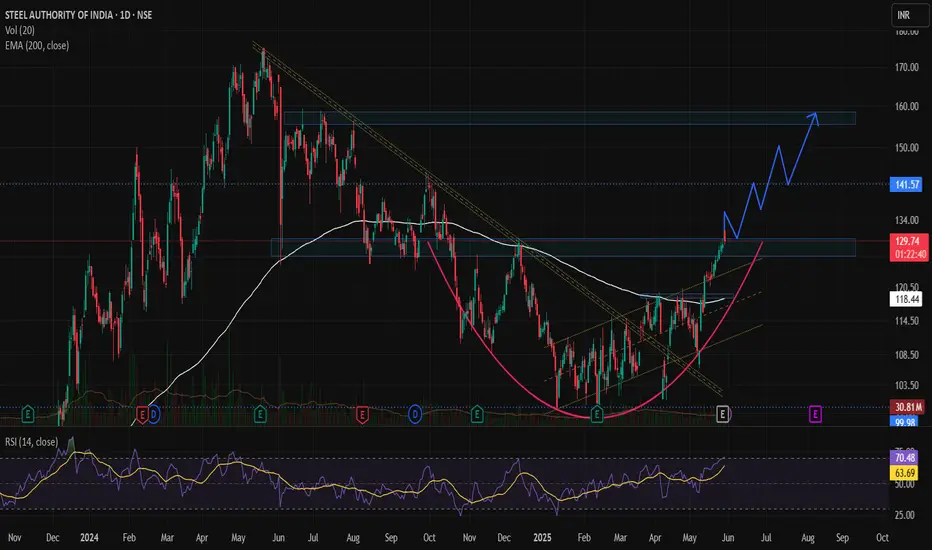
SAIL – Trend Reversal & Trade SetupA trend reversal appears to be taking shape in SAIL, indicating a potential shift from a downtrend to an uptrend. The stock has recently came out of a falling trendline and has closed above its 200-day EMA, placed at ₹117, signaling renewed strength and buyer interest.
🔄 Technical Outlook
- Breakout Zone: SAIL gave a technical breakout at ₹117, which aligns with its 200 EMA (Day), a widely tracked long-term moving average.
- Current Price Action: The stock is now trading at around ₹130, emerging from a rounding bottom pattern, which is a bullish continuation pattern indicating accumulation and base formation.
- Volume Analysis: Recent trading sessions have shown notable volume spikes, supporting the bullish breakout and trend reversal narrative.
- Fundamental Trigger: Q4 Results have been decent, providing a fundamental cushion to the technical setup. While not overly bullish, the results are good enough to support the ongoing trend reversal, especially if broader market sentiment remains stable.
📊 Support & Resistance Levels
- Crucial Support Zone: ₹127–₹130 — holding this zone is key for sustaining the bullish move.
- Key Breakout Zone: ₹127–₹130 — staying above this range will confirm the breakout and strengthen the upward move.
- Stop Loss: A protective stop-loss at ₹115, which lies just below the 200-day EMA, is advisable to manage downside risk.
🎯 Target Levels
First Target: ₹140
Second Target: ₹150
Final Target: ₹158
Time Frame: Expected to take 2–2.5 months to achieve the projected targets if momentum continues.
SAIL - At strong supportAt strong support
Strong support area 108 - 110
Upside strong resistance - 117
Next resistance - 125
Risk to reward - Excellent
Expecting to take support and finally break the trend line this time

Selected SAIL for Intraday
In this analysis of SAIL, we observe a potential bullish setup for intraday
Trigger Level: If the price breaks marked level, it may indicate further upside movement.
Target: Adjust based on price action dynamics.
⚠️ Disclaimer:
This analysis is for educational purposes only and is not a trading or investment recommendation. Please do your own research and consult a financial advisor before making any decisions.

*SAIL cmp 143.00 by Monthly Chart views**SAIL cmp 143.00 by Monthly Chart views*
- 150 to 160 Resistance Zone Price Band
- Weekly basis Support at 124 > 105 > 83 with Resistance at 160 > 181 > 200
- *Cup and Handle and/or Double Rounding Bottoms as one may read and interpret*
- *Volumes decreasing month on month indicative of the strongly effective retracement from Resistance Zone*

Verge of Breaking Falling Channel Closing above 100 EMANSE:SAIL is on the Verge of Closing above the Falling Channel; today it closed above Key Levels and with Good Volumes and it was able to close above 100 EMA. If it closes above the falling Channel and 156 Key Level Further Upside, it may go back to the accumulation zone if it fails.
Disclaimer: This analysis is intended solely for informational and educational purposes and should not be interpreted as financial advice. It is advisable to consult a qualified financial advisor or conduct thorough research before making investment decisions.

Sail on the Verge of Breakout..!Sail has been consolidating for a while. Taken support near 140 and waiting for triangle breakout. Can reach all time high if markets support..! maintain risk reward and follow strict stoploss..!

SAIL: Steel Authority of India Ltd - Breakout ViewDate : 8-Jul-2024
Rating : Buy - Positional View
LTP : Rs. 155.61 (on 5-Jul-2024)
Targets: (1) Rs. 175 --> (2) Rs. 188 --> (3) Rs. 210
SL : Rs. 140 on daily close basis
Technical View:
• NSE:SAIL is in it's primary uptrend and was recently going through it's secondary downtrend.
• After touching the high of 175.35 on 22-May-2024, it has retraced 29% to 124.80 level.
• On 5-Jul-2024, NSE:SAIL has broke out from its secondary down trend with higher than average volume.
• NSE:SAIL is trading above 20 DMA, 50 DMA and 21 DEMA.
• RSI is trading at 54.16 and MACD is about give cross over.
• Looking strong to start a new swing from here.
Disclaimer : I am not a SEBI registered analyst/consultant and not recommending anyone to take any BUY or SELL position in stock market. Investing in stock market is risky and one should do a self analysis and validation before investing in stock market. Ideas are published for learning purpose only.

SAIL Key Technical Levels and AnalysisI am sharing my analysis of key levels for these stocks. Please note that they may not be accurate, as I am still learning.

Breakout Soon in SAIL?Sail is trading near resistance zone and taking support of 9 and 21 moving average meanwhile volume is decreasing, closing above Resistance zone with good volume can give good upside.

SAIL ready for correction?NSE:SAIL has reached an important sell zone of 177/170 at the half yearly time frame with fresh buy zone created at 166/160 levels, if sail manages to break above 177 and give a daily closing and opening above 177 then we can see more upside in coming days but before that we may see a small correction till 166/160 zone before countinuing the upside trend.
if we see a break below 160 then we might see 150 level zone getting tested , do keeep watch at the levels and plan your trades accordingly.

Bullish Opportunity: SAIL Channel Breakout Above 160Details:
Asset: Steel Authority of India Limited (SAIL)
Pattern: Channel breakout
Breakout Level: Sustaining above 160
Potential Targets: Projection based on channel width or next significant resistance levels
Stop Loss: Below breakout level or as per risk tolerance
Timeframe: Medium to long-term
Rationale: Steel Authority of India Limited (SAIL) has experienced a channel breakout, indicating a potential shift in sentiment. The stock has shown strength by sustaining above the key level of 160. This breakout suggests the possibility of a significant bullish move in the near future.
Accumulation Opportunity: The current scenario may present an opportunity for investors to accumulate SAIL shares at advantageous levels, considering the potential for further upside.
Possibilities:
Bullish Momentum: Sustaining above 160 could attract further buying interest, potentially fueling a bullish momentum.
Projection Targets: Traders often project potential upside targets by measuring the width of the channel and extrapolating it from the breakout point. This provides an estimation of the potential target levels.
Confirmation: Confirmation of the breakout with sustained trading volume would enhance the validity of the bullish scenario.
Risk-Reward Ratio: Depends on individual risk appetite and stop-loss placement.
As with any investment decision, it's important to conduct thorough analysis and consider risk management strategies before accumulating the stock.

SAIL - Rounding Bottom PatternNSE:SAIL This Look like Good Rounding bottom pattern Add To Your Watchlist Set Your SL Small

#Sail Accumulate in PartsSlow move by SAIL. #Sail lacking #Momentum but the #Stock is in Uptrend as the Stock Made HigherHigh in Monthly Charts.

10+ Years of Consolidation Stock was in consolidation phase for 10+ years .....
Now it's bottomed out and ready to breakout anytime and also future data shows that accumulation taking place....
Keep in watch...

Steel Authority India Weekly Analysis NSE:SAIL Weekly Analysis for long duration
Wait for strong Breakout and sustain above 87
Trendline breakout is important
If gave clear breakout and sustained with LH LH structure can go for long with SL of 70
T1 100, T2 120, T3 140

SAIL Multiyear breakout with retest : A possible multibagger Exciting Bullish Pattern Alert! 🐂
📊 Pattern: Broadening Pattern Breakout
📌 Symbol/Asset: SAIL
🔍 Description: SAIL has made Broadening pattern from 2011 to 2020 and given breakout of the pattern.
Its a multiyear breakout and retest is also done.
We can see huge upside and might see returns in 3 digit percentage numbers !!
One need to just hold it for few weeks or months to come.
👉 Disclosure: We are not SEBI registered analysts, this is not a buy or sell recommendation.

SAIL DAILY CHART BREAKOUTSAIL Breakout possible in Daily Chart view.
:: Data Point ::
Breakout Level : @91.50 (If daily close above the price)
Target 1st : @96.00
Target 2nd : @102.00
Stoploss Level : @88.00
Note: SAIL Traded above 200 EMA.
Channel Break happend in 2nd week of Nevember.
Showing Good Volume.
Previous 5 Days Avg. Delivery Percentage 43.86%.

SAIL Swing/Positional Trading SAIL Swing Trading
These Targets are positional Holding for 1 year time horizon..
Buying/Accumulation levels 98 to 125
Stop Loss: Below 90
1st Target : 152
2nd Target: 180
3rd Target 215
Disclaimer:
I do not give any tips or buy sell recommendation I only teach trading strategies.
These levels are purely based on Price action/demand and supply zones & and consumed only for educational purpose & should not be taken as buy/sell recommendation. I will not be responsible for any loss/profit incurred if anyone takes trades based on my view.
Please consult your Financial Advisor before making any trading decision

SAIL Breakout Happend Today @88.70 on Daily and Weekly ChartSAIL Breakout Today @88.70 on Daily and Weekly Chart.
SAIL creating upside channel from May 2023, today if closes above @88.70 then it should be potential breakout.
In Daily charts 50 EMA (Yellow) cross over 200 EMA (White) as well.
SAIL Data Point:
Breakout Level: @88.70
1st Target Level: @93.00
Stoploss Level: @86.00
If SAIL sustain above 1st Target then go for 2nd target @96.00

SAIL possible Elliot wave counts with Multi parameters alignedHello Friends,
here we had shared analysis of stock from metal sector stock named SAIL, in which we had checked multi parameters which are aligned in same bearish bias as in current scenario.
As per Elliot wave counts we are in complex correction or we can say double threes or double zigzag correction which we had labled as ABC as a (W) then (X) and again ABC as (Y), as per wave principles (Y) should be equal to (W) so we have enough space towards south zones (down side) which is indicating bearish bias as per Elliot wave counts.
Trend identified by Dow theory is also giving same bearish bias because stock is forming lower highs and lower lows since last 22 months, which is aligned itself with same bearish bias.
Trend indicator like MACD on monthly, weekly and daily these all are in sell modes and aligned with each others, which are indicating same bearish bias.
As per Bollinger bands on all three time frames like monthly, weekly, and daily are also showing that stock is trading below 20 Monthly SMA, 20 Weekly SMA, and also 20 Daily SMA, which also indicates same bearish bias.
On bigger picture possibly we are in last leg of correction which is to complete or finish very soon, Overall wave structure is suggesting on higher degree we had completed wave ((1)) and currently we are in correction phase almost near verge of end as a wave ((2)), post ((2)) we can start fresh impulse of bigger degree as a wave ((3)) which can cross highs of wave ((1)) so we can say that, currently we assume this stock as a bearish and after finishing wave ((2)) we should change our bias from bearish to bullish after confirming with price actions and other parameters also.
I am not sebi registered analyst. My studies are for educational purpose only. Please Consult your financial advisor before trading or investing. I am not responsible for any kinds of your profits and your losses.
All major parameters are shared below as snapshots must watch
Thanks
This stock is forming lower highs & lower lows since last two years which is clearly bearish trend
Possible Elliot wave counts on daily time frame
Monthly macd negative
Weekly macd negative crossover
Daily macd negative
Price trading below 20MMA (monthly mid bollinger)
Price trading below 20WMA (weekly mid bollinger)
Price trading below 20DMA (daily mid bollinger)
Possible wave counts on hourly chart
Most investors treat trading as a hobby because they have a full-time job doing something else.
However, If you treat trading like a business, it will pay you like a business. If you treat like a hobby, hobbies don't pay, they cost you...!
Disclaimer.
I am not sebi registered analyst.
My studies are for educational purpose only.
Please Consult your financial advisor before trading or investing.
I am not responsible for any kinds of your profits and your losses.
