BUY TODAY SELL TOMORROW for 5%DON’T HAVE TIME TO MANAGE YOUR TRADES?
- Take BTST trades at 3:25 pm every day
- Try to exit by taking 4-7% profit of each trade
- SL can also be maintained as closing below the low of the breakout candle
Now, why do I prefer BTST over swing trades? The primary reason is that I have observed that 90% of the stocks give most of the movement in just 1-2 days and the rest of the time they either consolidate or fall
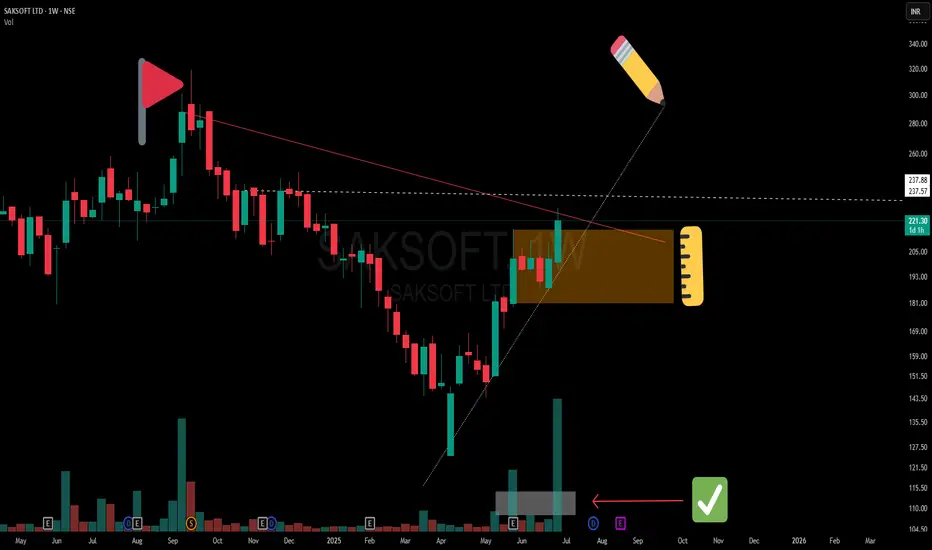
Trendline Breakout in SAKSOFT
BUY TODAY SELL TOMORROW for 5%
SAKSOFT

Precision Meets Patience | SAKSOFT Chart WTF🔻 A clean Control Trendline (CT) drawn from the all-time peak (🔺) on the Weekly Time Frame (WTF) shows a long-term price memory resistance finally getting tested.
📏 Overlapping that is a hidden horizontal resistance (⚪ dotted white line), representing the final hurdle before the stock can challenge the supply zone.
🟧 Mother Candle Structure: A powerful consolidation candle has now been broken with strength, giving us structure + intent in one move.
🔊 Volume speaks! We’ve seen two separate clusters of high volume, confirming active participation—not a lonely breakout.
📈 The trendline from bottom left is giving both body and wick supports—a technically clean angle where structure meets sentiment.
📝 Note:
This is a structural breakdown meant for educational and analytical purposes. Not a forecast or recommendation.
SAKSOFT - Horizontal Trendline Breakout🔊 SAKSOFT - Horizontal Trendline Breakout
⌛Duration - Short Term (1 Week to 4 Week)
📊📈 Trade Logic - Horizontal Trendline Breakout with Huge Volume
CMP - ₹321.75
Time Frame - Daily
🎯Target 1 : ₹350
🎯Target 2 : ₹360
🎯Target 3 : ₹380
🛑 Stop : ₹300
🏆 Risk/Reward Ratio (1: 2.5)
Disclaimer: The stock information shared above is not a recommendation to buy, sell, or hold. It reflects my own analysis and is intended solely for educational purposes. Any actions you take based on this information are your responsibility, and the admin of this channel is not liable for any financial gains or losses. Please consult a financial advisor before making any investment decisions. I am not a SEBI-registered advisor.

SAKSOFT - Picking up momentum My View on SAKSOFT :
+ve points :
Trend Ch + Today
Crossing 4 week High
Today 50 SMA crossed 200 SMA on daily time frame - Golded Cr
SMA 20 : Close is above Daily, Weekly and Monthly time frames SMA 20 Average
Monthly, Weekly and Daily RSI is > 60.
And Daily RSI crossed 2Days Back
If the market maintains current levels - we should see 350 and 403 levels quickly.

Saksoftbreakout for bear below parallel channel. Now level retest is pending. afterward if we have profit booking it may be party of bears.

SAKSOFT - Ichimoku BreakoutStock Name - Saksoft Limited
Ichimoku Cloud Setup :
1). Today's close is above the Conversion Line
2). Future Kumo is Turning Bullish
3). Chikou span is slanting upwards
All these parameters are showing bullishness at Current Market Price
and more bullishness AFTER crossing 345
#This is not Buy and Sell recommendation to any one. This is for education purpose and a helping hand to learn trading in Market.
#CloudTrading
#IchimokuCloud
#IchimokuFollowers
#Ichimokuexpert
I hope you all like my analysis.
Please do share your thoughts into comment section.
Please give a like, share & subscribe for daily analysis.

Breakout in SaksoftStock gives breakout on a daily timeframe .
CMP : 141
Target : 165
Stoploss : 127.50
This is not a buy or sell call, this analysis is shared for educational purpose.

SAKSOFT - Ichimoku Bullish Breakout Stock Name - Saksoft Limited
Ichimoku Cloud Setup :
1). Today's close is above the Conversion Line
2). Future Kumo is Turning Bullish
3). Chikou span is slanting upwards
All these parameters are showing bullishness at Current Market Price
and more bullishness AFTER crossing 167
#This is not Buy and Sell recommendation to any one. This is for education purpose and a helping hand to learn trading in Market.
# Cloud Trading
# Ichimoku Cloud
# Ichimoku Followers
I hope you all like my analysis.
Please do share your thoughts into comment section.
Please give a like, share & subscribe for daily analysis.


SAKSOFT | Good for Long NSE:SAKSOFT
Reason for Trade : Daily BO & Weekly BO
Cmp : 1064
Entry :Above 1180
Stop Loss: According to one's Risk Reward ratio
#Study, Learn & Earn.
If you love this post please like and comment your thoughts below. That will be a great motivation for me to post similar ideas ahead.
Disclaimer: All the information posting on this page are for the educational purpose only, we are not SEBI registered financial advisor. We wont recommend any BUY/SELL of stocks. Contact your financial advisor before taking any action

Saksoft Inverted Head & Shoulder Possible BreakoutTaking support at Monthly EMA21 & Pivot
Saksoft Inverted Head & Shoulder Possible Breakout
Long position with Stoploss below 820

Expecting a Bullish Momentum in SAKSOFTAs per the 2 Hour Chart of SAKSOFT, we have witnessed a Formation of a “Bullish Engulfing” Pattern on the downside levels of the stock.
Therefore, we are expecting to witness a bullish momentum in the stock in the upcoming trading sessions. Wherein, the stock is being expected to face a resistance initially at around the levels of 753.60, 777.50, and 814. Whereas, on the other hand, on the downside levels, the stock may face a support at the level of 719, on closing basis.
Closing Price (as on 10.05.22) : 740
Disclaimer: No financial information whatsoever published here, should be construed as an offer to buy or sell securities, or as advice to do so in any way whatsoever. All matter published here is purely for Educational and Information purposes only and under no circumstances should be used for making investment decisions. Viewers must consult their personal financial advisor before making any actual investment decisions, based on information published here. Any Investor or Trader taking decisions based on any information published here, does so entirely at its own risk. Investors and Traders should bear in mind that any investment in Stock Market is subject to unpredictable market-related risks.


Price Action SetupLOGIC,LEVEL AND TARGET WELL MENTIONED IN THE CHART
NOTE -The above interpretation from the chart is my personal view and doesn't guarantee any success.
(Do talk to your financial advisor before making any investment decisions)
please like, share and comment if you have any suggestion regarding this analysis.

Breakout in Saksoft...Chart is self explanatory. Entry, Targets and Stop Loss are mentioned on the chart.
Disclaimer: This is for demonstration and educational purpose only. This is not buying or selling recommendations. I am not SEBI registered. Please consult your financial advisor before taking any trade.

Target 1 (43%) achieved in Saksoft. Target 2 is ON...This is follow-up on Saksoft. Can check link to related ideas.
Target 1 achieved. More than 43%. Target 2 is ON.
Chart is self explanatory. Entry, Targets and Trailing Stop Loss are mentioned on the chart.
Disclaimer: This is for demonstration and educational purpose only. This is not buying or selling recommendations. I am not SEBI registered. Please consult your financial advisor before taking any trade.


SAKSOFT - CMP: 437Flag breakout on monthly chart, also conformation on daily chart. Expect Flag pattern target of 610 in Mid Term. All indicators and oscillators indicates bullish bios. Delivery volume also indicates continuation of bullishness.

Saksoft Ltd - Technical & FundamentalsStock P/E 10.3 vs Industry PE 23.9
Dividend Yield 1.14 %
ROCE 25.6 % vs ROCE3yr avg 24.9 %
ROE 20.3 % vs ROE 5Yr 19.4 %
OPM 16.2 % vs OPM 5Year 15.2 %
Promoter holding 72.9 %
Free Float Mkt Cap ₹ 112 Cr.
Pledged percentage 0.00 %
Debt to equity 0.12
I see a Bullish Divergence too.

#SAKSOFT #DIGITAL #IT #IoT #ML #AI #Breakout #SOFTWARE #bitcoin#SAKSOFT
NSE:SAKSOFT
Saksoft Ltd.
CMP: 353.30
Target: 454 ++
Time Frame: <2 month.
Breakouts better than all others!
Enter now and earn well!
If u need any help regarding current portfolio u can always message me here.
If u like my work, kindly LIKE SHARE & FOLLOW for latest stock recommendations.

SAKSOFT - Bullish Flag Pattern (SmallCap - IT Sector)Hi Investors,
SAKSOFT looking good with bullish flag. During flag pattern formation, volume was completely dried out it means only weak hands have taken out their money. Breaking out above 345-350 with volume could be a good sign to enter.
I hope you will benefit from this knowledge
-MetaVish
