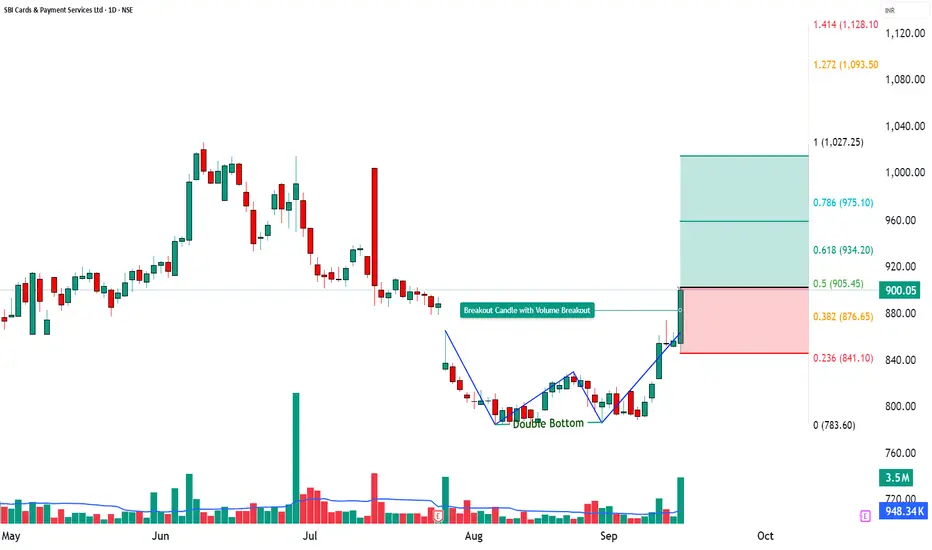
SBICARD Technical Analysis | Double Bottom Breakout Explained📊 SBICARD Trade Analysis
🔎 Price Action
SBICARD closed at ₹900.05 with a sharp +5.13% gain, backed by a volume of 35.03 lakh, far higher than its 20-day average of 9.48 lakh (VolX = 3.67x).
This massive surge in activity highlights aggressive buying and momentum revival after a consolidation phase.
________________________________________
📉 Chart Signals – Double Bottom Pattern Breakout
Strong bullish candle with heavy volumes.
RSI breakout + CCI strength confirming trend.
Bollinger Band breakout → signals upside continuation.
________________________________________
📍 Key Levels
Resistance: 919 – 938 – 974
Support: 863 – 827 – 808
________________________________________
📈 Investment Outlook
📈 Bullish Case – Why the stock could go up
High-volume breakout (VolX = 3.67x) signals strong participation.
Momentum indicators (RSI 74, CCI 238, Stochastic 98) confirm overbought strength.
Upside potential toward ₹959 – ₹1015 if buying sustains.
📉 Bearish Case – Potential downside risks
Failure to hold above ₹902 could lead to profit booking.
High RSI suggests short-term overbought → risk of pullback.
A break below ₹863 may drag toward ₹827 – ₹808.
⚡ Momentum Case – Short-term Trading Edge
Volume breakout + RSI strength highlight bullish edge.
Bollinger Band breakout points to strong near-term volatility.
Holding above ₹902–919 may fuel rally toward ₹958–₹1015.
📅 Short-term vs Long-term Perspective
Short-term (1–2 weeks): Likely to test resistances 919–974; supports 863–827 remain key.
Long-term (1–3 months): Stock in recovery phase; sustained volumes and trend strength could establish higher base above ₹900.
________________________________________
📝 STWP Trade Analysis
Outlook: Momentum: Moderate, Trend: Neutral
Entry: 902 | Stop-loss: 845.32
Target-1: 958.68 | Target-2: 1015.36
Risk/Reward: 1:6.08 | Risk: High | Volume: High
Demand Zone: 874 – 850.05 | SL: 848.95(Pullback Zone)
Learning Note: SBICARD is showing momentum revival with strong volumes; watch for sustainability above ₹900 to confirm trend continuation.
________________________________________
⚠️ Disclaimer – Please Read Carefully
The information shared here is meant purely for learning and awareness. It is not a buy or sell recommendation and should not be taken as investment advice. I am not a SEBI-registered investment advisor, and all views expressed are based on personal study, chart patterns, and publicly available market data.
Trading — whether in stocks or options — carries risk. Markets can move unexpectedly, and losses can sometimes exceed the money you have invested. Past performance or past setups do not guarantee future results.
If you are a beginner, treat this as a guide to understand how the market works — practice on paper trades before risking real money. If you are experienced, always assess your own risk, position sizing, and strategy suitability before entering trades.
Consult a SEBI-registered financial advisor before making any real trading decision. By engaging with this content, you acknowledge full responsibility for your trades and investments.
💬 Found this useful?
🔼 Give this post a Boost to help more traders discover clean, structured learning.
✍️ Drop your thoughts, questions, or setups in the comments — let’s grow together!
🔁 Share with fellow traders and beginners to spread awareness.
👉 “If you liked this breakdown, follow for more clean, structured setups with discipline at the core.”
🚀 Stay Calm. Stay Clean. Trade With Patience.
Trade Smart | Learn Zones | Be Self-Reliant 📊
Sbicardview
SBICARD Looks good...SBICARD looks good for reversal in weekly chart.
Can Accumulate between 700-750 zone. Might reach channel upper line in coming years. Targets are given.
Stoploss for longtermInvestors is given.
Note : No idea about fundamentals. View is completely based on technical view of chart.

SBI CARDS - Strong Straddle OpportunityStock stuck in zone, and may try to remain in the same
Upside resistance zone from 780 to 800
Downside support zone from 740 - 725
Final resistance at 815
Final support at 705
if opportunity arises and liquidity improves, straddle for next expiry (February) will be a good opportunity
Caution : Quarterly results still pending, Wait for that event to happen first

SBI CARD#SBICARD
stock holds abv the resistance
looking good for buying
weak below 690
upside targets 715-730

SBICARDS#SBICARD (1 Hour Time Frame)
SBICARD is currently at a
major support level and forming an inverse head
and shoulders pattern,
suggesting a potential bullish setup above 703.15.
Please note,
follow strict SL

SBI CARD BULLISH
SBI CARD is now available to us at very low price.
It broke a major support line and broke out failure.
A channel pattern is farmed as it descends.
This is a very strong demand zone where institutional players and big players are likely to enter.
If a daily candle closes above 710 we can look bullish from here.
First target@770
Second target@880
Stop loss@678
So please keep SBI CARDS in your watchlist for long term investment.
If yoy like my view, do support it with a boost whitch is valuable inspiration for me to post ideas like this in future. thank you friends!
Disclaimer:
I am not a SEBI Registered Analyst. Anything posted here is my own analysis and views. This is created for educational purposes only. Always consult your Financial Advisor before taking any decision or trade.
Happy trading.

SBI CardSupport trendline breakdown in SBI Card on weekly chart. But this looks like a fake breakdown. Confirmation will come around 890.
Disclaimer: Not SEBI registered. Showing analysis for educational purpose only. Consult a SEBI registered research analyst before taking any buy or sell decision.
