SBI Buy - Range Breakout - Technical analysis#State Bank of India - #TechnicalAnalysis - #sbin
Price: 948.85 |
#Technical Setup
Pattern: #Swing trade setup with All-Time High (ATH) breakout confirmed on monthly chart. #Pullback/base formation in progress before next upward move.
Strategy: Conservative buy on breakout on candle-closing basis
Entry: Buy above 973.30
Stop Loss: 944.45
**Key Levels:**
- Target 1: 1,025.00
- Target 2: 1,055.80
- Grand Target: 1,144.00
- Support: 961.78 - 944.45
#Technical Observations
1. **Range & ATH Breakout** confirmed on monthly timeframe
2. Current pullback/base formation before next leg up
3. **EMA's aligned** confirming uptrend structure
4. **Hidden Divergence (HD)** formed in RSI - trend continuation pattern
5. Price action remains constructive on daily chart
⚠️ DISCLAIMER
**This is NOT investment advice.** This analysis is for educational purposes only. Stock trading involves substantial risk of loss. Past performance and technical patterns do not guarantee future results. Always conduct your own research and consult a SEBI-registered financial advisor before making any investment decisions. The author assumes no responsibility for trading losses incurred.
Sbinanalysis

SBIN looking bullish on the weekly charts. (18/08/2025)State Bank of India is trading around the resistance zone after convincingly breaking the trendline and taking support from the weekly moving averages.
The stock has closed at 826.55 this week gaining 2.77% week on week.
If the stock starts trading above 833, there are chance of it travelling till 860 levels in the coming month.
SBIN has posted good result as well.
Major resistance :- 833, 865
Entry :- Above 833
SL :- Below 818
The stock looks bullish on the daily and the weekly charts.
Wait for the stock to close above the resistance levels on the daily chart frame.

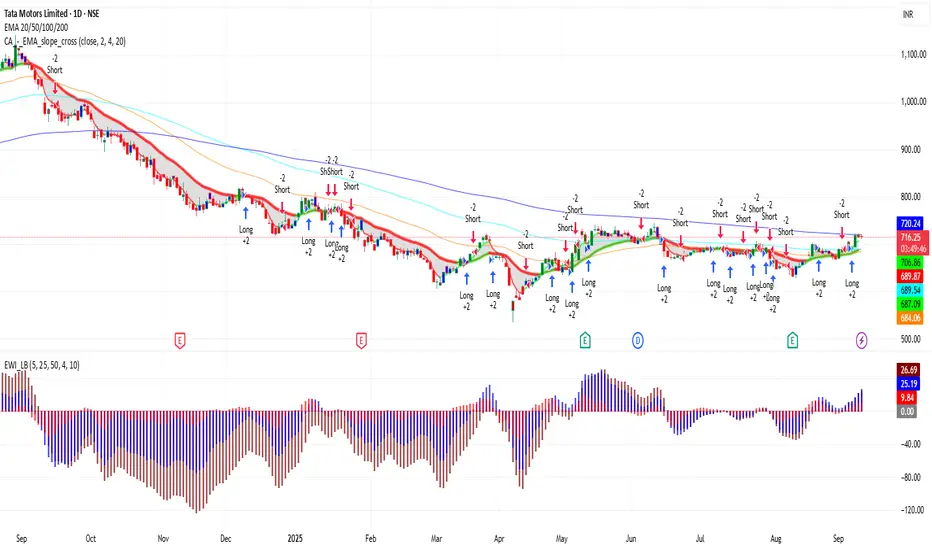
TATAMOTORS 1D Time frame📍 TATAMOTORS – 1D Important Levels (Current)
🔹 Support Zones
900 – 910 → Immediate daily support
870 – 880 → Strong support; buyers likely to defend here
835 – 850 → Major support; breakdown here may shift trend bearish
🔹 Resistance Zones
940 – 950 → Immediate daily resistance
970 – 980 → Strong resistance; breakout above this can fuel momentum
1,000 – 1,020 → Major psychological resistance; if crossed, bullish trend strengthens further
⚖️ Daily Trend Outlook
Tata Motors is in a bullish phase on the daily chart, making higher lows and sustaining above key supports.
As long as price holds above 900, the stock remains positive.
A breakout above 950 – 980 may open the path towards 1,000+.
A breakdown below 900 may lead to weakness toward 880 – 850.
SBI Price Action & Option Opportunity State Bank of India (SBI) is once again respecting its well-defined range on the daily chart, with price consolidating between the ₹780 and ₹840 support-resistance zone. Today, SBI closed at ₹807.85, down -1.05%, continuing its oscillation within this horizontal channel.
The chart shows potential for a bounce from the lower boundary near ₹800, with a dotted path illustrating a possible move back toward resistance. Traders may look for confirmation of reversal before initiating new long trades as the range continues to hold.
On the options side, the 30 SEP 2025 PUT 810 contract surged 41.67% today, closing at ₹13.60. This strike has given a move of ₹2.75 (over 20%) recently. This sudden spike suggests rising bearish sentiment or hedging activity, but also hints at possible premium profit-taking if SBI holds above support.
Trading Plan
Monitor SBI near ₹800 for signs of reversal or breakdown.
Long positions can target ₹840 if support holds, with stops below ₹780.
PUT options holders should watch for profit booking if a bounce appears.

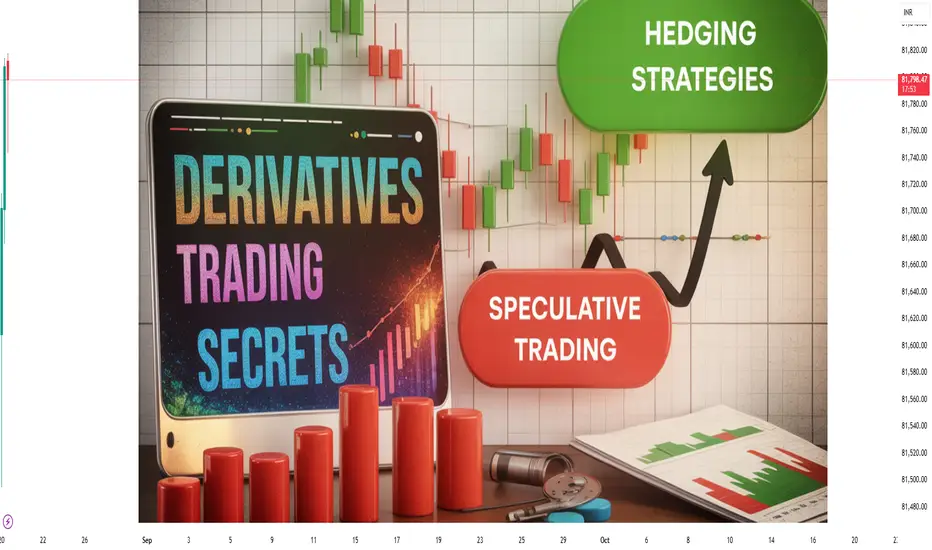
Futures & Derivatives TradingIntroduction
The financial world is full of instruments designed to manage risk, improve returns, or speculate on price movements. Among these, derivatives stand out as some of the most powerful yet complex tools. They have been both praised for providing risk management solutions and criticized for their misuse in speculative bubbles.
At the heart of derivative trading lies futures contracts, which are widely used in stock markets, commodities, currencies, and even cryptocurrencies today. For beginners, the idea of betting on future prices might seem abstract, but in practice, derivatives are an essential pillar of modern finance.
In this guide, we’ll break down what derivatives are, how futures work, their role in trading, strategies, advantages, risks, and real-world examples. By the end, you’ll have a strong grasp of this exciting domain.
1. What Are Derivatives?
A derivative is a financial contract whose value is derived from the price of an underlying asset.
Underlying assets can be stocks, bonds, commodities (gold, oil, wheat), currencies, indices (Nifty 50, S&P 500), or even interest rates.
The derivative itself has no intrinsic value—its worth comes purely from the asset it tracks.
Key Types of Derivatives:
Futures – Standardized contracts to buy/sell an asset at a predetermined future date and price.
Options – Contracts that give the buyer the right, but not the obligation, to buy/sell at a specific price within a certain period.
Forwards – Similar to futures but customized and traded over-the-counter (OTC).
Swaps – Agreements to exchange cash flows (e.g., fixed vs. floating interest rates).
Futures are the most actively traded derivatives worldwide, making them the cornerstone of modern derivative trading.
2. Understanding Futures Contracts
A futures contract is an agreement between two parties to buy or sell an asset at a future date for a price decided today.
Features of Futures:
Standardized: Contracts are uniform in terms of size, expiration date, and rules (unlike forwards).
Exchange-traded: Futures trade on regulated exchanges (like NSE in India, CME in the US).
Margin & Leverage: Traders don’t pay the full contract value upfront. Instead, they deposit a small margin, which allows them to control large positions with less capital.
Settlement: Contracts may be settled physically (actual delivery of the asset) or in cash (profit/loss paid without delivery).
Example:
Suppose you buy a Nifty 50 Futures contract at 22,000. If at expiry, Nifty is at 22,500:
You gain = 500 × lot size (say 50) = ₹25,000.
If Nifty falls to 21,800:
You lose = 200 × 50 = ₹10,000.
This leverage magnifies both profits and losses.
3. Why Futures & Derivatives Exist
Derivatives serve three main purposes:
Hedging (Risk Management)
Farmers use commodity futures to lock in crop prices.
Importers hedge currency risk using forex futures.
Stock investors hedge downside risk with index futures.
Speculation
Traders bet on the price direction of oil, stocks, or indices without owning them.
Speculators provide liquidity to the market.
Arbitrage
Traders exploit price differences between spot and futures markets for risk-free profit.
Without derivatives, markets would be less liquid, riskier, and less efficient.
4. Futures Market Structure
Futures trading involves multiple participants:
Hedgers – Reduce risk (e.g., a farmer locking wheat prices).
Speculators – Take risk to profit from price changes.
Arbitrageurs – Exploit mispricing between markets.
Exchanges – NSE, CME, ICE, etc., which standardize and regulate contracts.
Clearing Houses – Guarantee contract performance and manage counterparty risk.
This structure ensures trust, transparency, and liquidity.
5. Key Terminologies in Futures & Derivatives
Spot Price – Current market price of the underlying asset.
Futures Price – Price agreed for future delivery.
Margin – Initial deposit (usually 5-15% of contract value) to trade futures.
Mark-to-Market (MTM) – Daily settlement of profits/losses.
Lot Size – Minimum quantity per contract (e.g., Nifty Futures = 50 units).
Expiry Date – Last date on which the contract is valid.
Open Interest – Total outstanding contracts in the market.
6. Trading Futures: Step-by-Step
Let’s walk through how a futures trade happens:
Decide Asset: Choose whether to trade index, stock, commodity, or currency futures.
Select Contract: Pick expiry month (near-month, mid-month, far-month).
Check Margin: Ensure sufficient capital for margin requirements.
Place Order: Buy (long) if expecting rise, Sell (short) if expecting fall.
MTM Adjustments: Profits/losses credited daily to trading account.
Exit or Hold: Close position before expiry or hold till expiry for settlement.
This cycle repeats every expiry, creating continuous opportunities for traders.
7. Strategies in Futures Trading
(A) Hedging Strategies
Long Hedge: A company buying raw material futures to guard against price rise.
Short Hedge: A farmer selling wheat futures to protect against price fall.
(B) Speculative Strategies
Long Futures: Buy futures anticipating price increase.
Short Futures: Sell futures anticipating price decline.
(C) Spread Trading
Calendar Spread: Buy near-month futures, sell far-month futures.
Inter-Commodity Spread: Trade two related commodities (e.g., crude oil vs. heating oil).
(D) Arbitrage Strategies
Cash & Carry Arbitrage: Buy asset in spot, sell futures if futures are overpriced.
Reverse Arbitrage: Sell asset in spot, buy futures if futures are underpriced.
8. Futures in Different Markets
(i) Stock Index Futures
Most popular in India (Nifty, Bank Nifty).
Allow trading market direction without stock picking.
(ii) Single Stock Futures
Futures on individual stocks (e.g., Reliance, TCS).
Higher risk as volatility is stock-specific.
(iii) Commodity Futures
Gold, silver, crude oil, wheat, copper.
Essential for farmers, producers, and speculators.
(iv) Currency Futures
USD/INR, EUR/USD, GBP/INR.
Help businesses hedge forex risk.
(v) Interest Rate Futures
Bonds and Treasury futures.
Used by banks and institutions to manage interest rate risk.
(vi) Crypto Futures
Bitcoin, Ethereum futures on exchanges like CME and Binance.
Extremely volatile, attracting speculative traders.
9. Advantages of Futures & Derivatives
Leverage: Control large positions with small margin.
Liquidity: Futures markets are highly liquid.
Transparency: Exchange-traded and regulated.
Hedging: Protection against adverse price movements.
Arbitrage Opportunities: Ensure fair pricing between spot and futures.
10. Risks in Futures & Derivatives
Leverage Risk: Small price moves can cause huge losses.
Liquidity Risk: Some contracts may lack liquidity.
Market Risk: Prices may move unpredictably.
Margin Calls: Traders must add funds if losses reduce margin balance.
Speculative Excess: Misuse of leverage can lead to financial crises (e.g., 2008).
Conclusion
Futures & derivatives are double-edged swords. Used wisely, they provide powerful tools for hedging, speculation, and arbitrage. Misused, they can cause devastating losses.
For traders, understanding market structure, margin system, risk management, and strategies is key before jumping in. Futures are not just about predicting the market—they’re about managing uncertainty.
Whether you’re a farmer protecting crop prices, a company managing forex risk, or a trader chasing short-term profits, derivatives are central to modern finance. With discipline and knowledge, they can open doors to immense opportunities.
SBIN – Bearish Bias with Heavy CE Shorts and Weak Call Structure________________________________________________________________________________📈 SBIN – Bearish Bias with Heavy CE Shorts and Weak Call Structure
📅 Setup Date: 17.07.2025 | ⏱ Timeframe: Daily
📍 Strategy: Short-Term Bearish Momentum Setup with Defined Risk
________________________________________________________________________________
🔍 Overall View
Spot Price: ₹823.35
Trend: Mildly Bearish – Spot facing resistance at 830–840 with weak CE premiums
Volatility: IV ~18%–22% (stable to slightly elevated)
Ideal Strategy Mix: Bearish directional trades or credit spreads near resistance
________________________________________________________________________________
1️⃣ Bullish Trade (Contrarian Setup)
Best CE: Buy 820 CE @ ₹12.65
Why:
• ATM strike with highest delta (0.56) among CEs
• Smallest short build-up in CE chain (OI ↑0.73%, vs ~+4%–12% on other CEs)
• If spot reclaims 830+, this option will respond fastest
• IV is lowest (17.73%) = cheapest in premium vs other strikes
Contrarian Setup – Not ideal unless spot crosses 830 with strong volume
________________________________________________________________________________
2️⃣ Bearish Trade
Best PE: Buy 820 PE @ ₹8.65
Why:
• Strong Long Build-Up (+29.5% OI), volume-led spike (+46.6%)
• Solid delta (-0.44) with decent Vega → responds well to downside
• IV is relatively low (19.6%), allowing room for expansion
• Ideal strike as spot sits slightly above – quick delta pickup expected
________________________________________________________________________________
3️⃣ Strategy Trade (As per trend + OI data)
Strategy: Bear Put Spread → Buy 820 PE / Sell 800 PE
→ ₹8.65 / ₹3.00
Net Debit: ₹5.65
Max Profit: ₹20 – ₹5.65 = ₹14.35
Max Loss: ₹5.65
Risk:Reward: ≈ 1 : 2.54 ✅
Lot Size: 750
Total Risk: ₹4,237.50
Max Profit: ₹10,762.50
📊 Breakeven Point: ₹814.35
📉 Exit If: Spot closes above ₹832 (invalidates PE strength and bearish structure)
________________________________________________________________________________
Why:
• Heavy CE short build-up across 820–850 strikes (Bearish Call Ladder)
• 820 PE has strong long buildup + clean delta = momentum PE
• 800 PE still holding OI, good strike to sell for defined risk
• IVs are still in mid-range = spread cost low, R:R > 1:2.5
________________________________________________________________________________
📘 My Trading Setup Rules
Avoid Gap Plays
→ Check pre-open price action to avoid trades influenced by gap-ups/gap-downs.
Breakout Entry Only
→ Enter trades only if price breaks previous day’s High (for bullish trades) or Low (for bearish trades).
Watch Volume for Confirmation
→ Monitor volume closely. No volume = No trade.
Enter on Strong Candle + Volume
→ Execute the trade only if a strong candle appears with increasing volume in the direction of the trade.
Defined Risk:Reward Only
→ Take trades only if R:R is favourable (ideally ≥ 1:2).
Premium Disclaimer
→ Option premiums shown are based on EOD prices — real-time premiums may vary during execution.
Time Frame Preference
→ Trade with your preferred time frame — this strategy works across intraday or positional setups.
________________________________________________________________________________
⚠ Disclaimer (Please Read):
• These Trades are shared for educational purposes only and is not investment advice.
• I am not a SEBI-registered advisor.
• The information provided here is based on personal market observation.
• No buy/sell recommendations are being made.
• Please do your own research or consult a registered financial advisor before making any trading decisions.
• Trading involves risk. Always use proper risk management.
I am not responsible for trading decisions based on this post.
________________________________________________________________________________
SBIN (NSE:SBIN) Breakout Alert: Inverse H&S Targets 835/875
Timeframe: Daily
Key Levels: Resistance: 786 (neckline of Inverse H&S).
Pattern & Context:
-Inverse Head & Shoulders nearing breakout confirmation.
-Price stabilizing post-gap-down, signaling potential bullish reversal.
Confirmation Needed:
-Breakout Candle: Strong close above 786 with elevated volume.
Trade Setup (Post-Breakout):
Entry: Retest/close above 786 with volume support.
Targets: 835 (pattern-derived), 875 (next key resistance).
Broader Market Check:
-Ensure bullish alignment in indices (Nifty/Bank Nifty).
Risk: Failure to sustain above 786 negates the setup.
Wait for volume-backed breakout before trading.
This idea is for educational purposes only, not financial advice. Trading carries risk—only trade with capital you can afford to lose. Past performance doesn’t guarantee future results. Always conduct your own analysis or consult a SEBI-registered advisor before acting. The author assumes no liability for losses incurred.

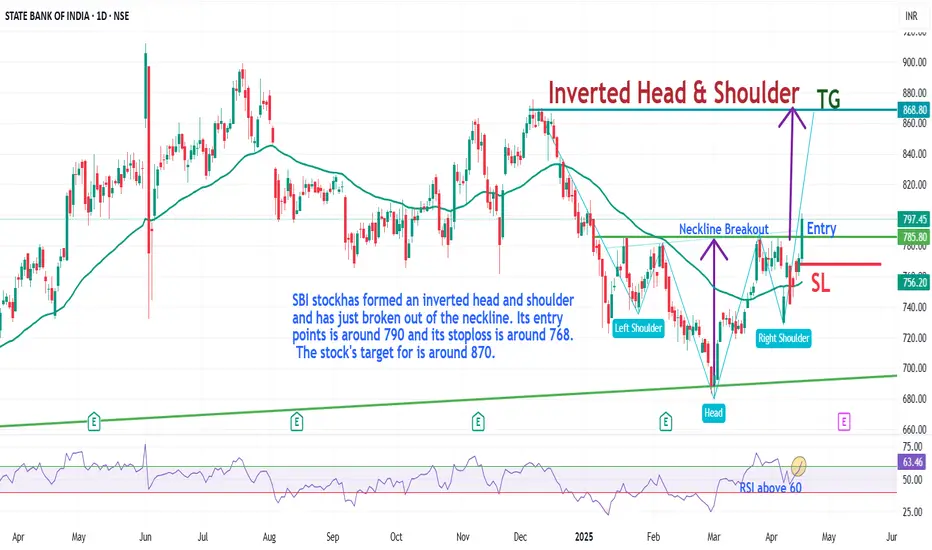
SBIN Stock has broken out an inverted head and shoulderSBI stockhas formed an inverted head and shoulder
and has just broken out of the neckline.
This stock has also broken out in 50 EMA and 200 Ema.
Its entry points is around 792 and its stoploss is around 768.
The stock's target for is around 868.
SBIN Upside potential with a Bullish Bias The Bank Index has been performing since few days
Also structure level SBIN is poised for an upmove, it has a pattern Inverse Head & Shoulders which is a bullish pattern and with a significant upside technically
Suggested to Buy at CMP or wait to retrace at 780s zone
SL 750s zone
Target 870s zone

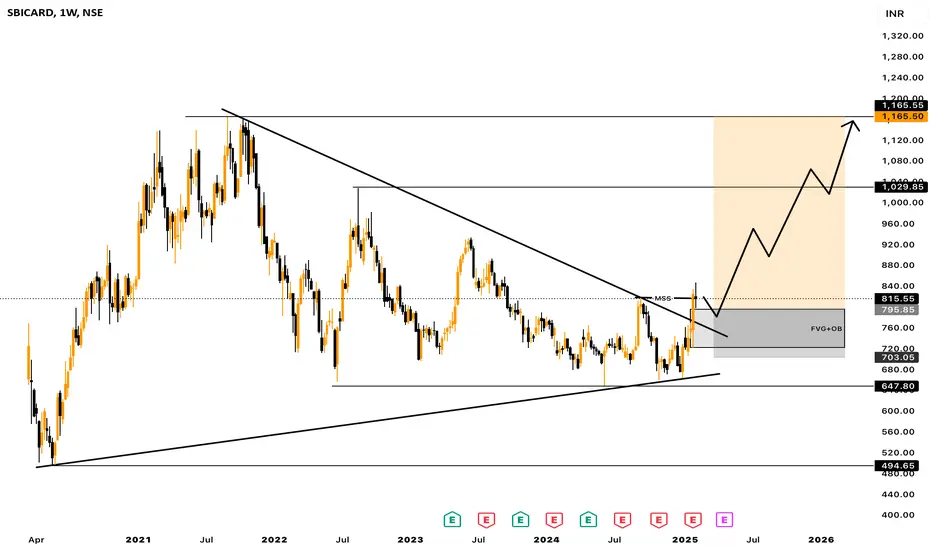
Technical Analysis: Symmetrical Triangle Breakout in SBICARD
• The weekly chart of SBI Cards (SBICARD) shows a symmetrical triangle pattern that has been forming since mid-2021.
• The stock recently broke out of this pattern, indicating a potential trend reversal or continuation move depending on broader market conditions.
• Resistance Breakout: The upper trendline, which acted as resistance, has been breached, and the stock is now retesting the breakout level (~800).
• Volume Confirmation Needed: To validate the breakout, an increase in volume would be ideal.
Fundamental Analysis: Mixed Earnings Performance
• Earnings Per Share (EPS) Trends:
• Q3 FY24 EPS came in at 4.25, missing estimates by 31.16%—a significant negative surprise.
• Q2 FY24 EPS also missed estimates by 4.51%, while Q1 FY24 had a 4.59% miss as well.
• The company has shown inconsistent earnings, which could cause volatility despite the technical breakout.
• Revenue Growth:
• Q3 FY24 revenue was ₹46.19B, exceeding estimates by 10.06%.
• Q2 FY24 revenue missed expectations by 3.01%, while Q1 FY24 was also slightly weak.
• This suggests that while top-line growth is strong, profitability (EPS) is under pressure due to either higher costs or operational inefficiencies.
Investment View: Cautious Buy with Risk Management
• Technical View: The breakout above the triangle is bullish, but the stock must sustain above 800-820 for confirmation. If it does, next resistance levels are 900 and 1000.
• Fundamental Concerns: Weak earnings growth is a risk factor. The next earnings (April 2025) will be crucial.
• Buying Strategy:
• Entry: If the stock holds above 800-820, it can be bought with a target of 900-1000.
• Stop Loss: 750-770 zone (below the breakout trendline).
• Risk Factor: If broader market sentiment weakens or earnings disappoint further, the breakout might fail.
Conclusion: A breakout trade is valid, but weak earnings make it a cautious buy with a tight stop loss. If fundamentals improve, the rally could sustain.
SBI Breakout Likely - Buy above 786.9, Target 799 -810 S.L 778 SBI Bank - looks like breaking out
IF it breaches the current resistance, it gan give good ultra short term swing
details on the chart
Buy above 787
Target 799-810
SL 780
This is Jan Futures, the RR looks very favourable, trade only once buy is triggered

SBIN SHOWING A GOOD DOWN MOVE WITH 1:20 RISK REWARD SBIN SHOWING A GOOD DOWN MOVE WITH 1:5 RISK REWARD
DUE TO THESE REASON
A. its following a rectangle pattern that stocked the market
which preventing the market to move any one direction now it trying to break the strong resistant lable
B. after the break of this rectangle it will boost the market potential for break
C. also its resisting from a strong neckline the neckline also got weeker ald the price is ready to break in the outer region
all of these reason are indicating the same thing its ready for breakout BREAKOUT trading are follws good risk reward
please dont use more than one percentage of your capitalfollow risk reward and tradeing rules
that will help you to to become a bettertrader
thank you

State Bank of India - Breakout OpportunityDate : 5-Dec-2024
LTP : Rs. 865.45
Targets: (T1) Rs. 912 --> (T2) Rs. 1,023
SL : Rs. 765
Technical View:
• NSE:SBIN is in primary uptrend and was recently going through it's secondary downtrend within primary uptrend.
• After touching the high of 912 on 3-Jun-2024, it has retraced 16% to 761.55 level.
• NSE:SBIN has breakout from it's secondary downtrend with high volume on 5-Dec-2024.
• NSE:SBIN is trading above 20 DEMA and 50 DEMA since last few sessions. 20 DEMA is also trading above 50 DEMA.
• RSI is in buy zone and trading at 62.74. MACD is bullish and trading at 10.63.
• Both RSI and MACD are showing positive divergence, indicating trend reversal.
• Looking good to start a new swing from here.
Liked the analysis? Boost/Like this idea and follow my ID.
Disclaimer: I am not a SEBI registered analyst/consultant and not recommending anyone to take any BUY or SELL position in stock market. Investing in stock market is risky and one should do a self analysis and validation before investing in stock market. My ideas are published for learning purpose only and are available to everyone at no cost/charge.

SBI cmp 847.65 by Daily Chart viewSBI cmp 847.65 by Daily Chart view
- Support Zone 834 to 841 Price Band
- Support at 814 > 781 > 751 with Resistance at 868 > 883 > ATH 912
- Stock Price is testing and Retesting the Support Zone over the past week
- Volumes seem steady showing intermittent spikes by demand based buying

Technical Analysis - Elliott Waves of SBINThis analysis is based on Elliott Wave theory and is for educational purposes only. It does not constitute financial advice.
Key Observations:
Ascending Diagonal Triangle: The price action appears to be forming an ascending diagonal triangle pattern, suggesting a potential bullish breakout.
Wave Structure: The current price movement could be interpreted as an impulse wave, with a strong possibility of a fifth wave extension.
Invalidation Level: The 732.00 level acts as a critical invalidation point. A break below this level would negate the bullish outlook.
Potential Target: A breakout above the triangle's upper boundary could lead to a significant price increase, with a potential projection around the 920.00 level and more
Overall Outlook:
The technical analysis based on Elliott Waves suggests a bullish bias for SBIN. However, it's essential to monitor the price action closely and be prepared to adjust the analysis if the market's behaviour deviates from the expected pattern.
I am not Sebi registered analyst.
My studies are for educational purpose only.
Please Consult your financial advisor before trading or investing.
I am not responsible for any kinds of your profits and your losses.
Most investors treat trading as a hobby because they have a full-time job doing something else. However, If you treat trading like a business, it will pay you like a business.
If you treat like a hobby, hobbies don't pay, they cost you...!
Hope this post is helpful to community
Thanks
RK
Disclaimer and Risk Warning.
The analysis and discussion provided on in.tradingview.com/u/RK_Charts/ is intended for educational purposes only and should not be relied upon for trading decisions. RK_Charts is not an investment adviser and the information provided here should not be taken as professional investment advice. Before buying or selling any investments, securities, or precious metals, it is recommended that you conduct your own due diligence. RK_Charts does not share in your profits and will not take responsibility for any losses you may incur. So Please Consult your financial advisor before trading or investing.

SBIN Swing Long Setup - State Bank Of India is currently Trading at 790.85
- We are currently in a good zone if you are looking to build longs
- All PSU banks moved up except for State Bank of India
- Peers are performing quite nicely hence we might see SBIN following and doing the same
- Invalidation of this swing will be below 765

SPX Levels // 45 MinHello Everyone 👋
Support Levels:
First Support: 4,500
Second Support: 4,480
Third Support: 4,460
Resistance Levels:
First Resistance: 4,520
Second Resistance: 4,540
Third Resistance: 4,560
These levels are derived from technical analysis and can help identify potential entry and exit points for trading

TRENDING DAYS IN SBIN AHEADHello Traders !
SBIN currently change in structure observed from the new move.
Started creating HH pattern with increasing volume.
About to Break ATH levels & for a Trending Move ahead.
Education purpose only.
Thanks
Prince

TRENDING DAYS IN SBIN AHEADHello Traders !
SBIN currently change in structure observed from the new move.
Started creating HH pattern with increasing volume.
About to Break ATH levels & for a Trending Move ahead.
Education purpose only.
Thanks
Prince

SBIN Weekly Update 14/JUN/24Hello Traders ,
Am small Magical boy has the Power to move further with the trend continuation.
Last week update we have Recognise a patter forming thats rising wedge pattern & SBIN able to recover it close above trendline.
Candlestick indicates THE BULLISH HARAMI , a strong trend further is Evolving in mothers womb.
RSI indicates super bullish bias as it holds the level of > 70 levels.
Wait for the candlestick pattern identification so one can build up on Daily Chart.
HAPPY TRADING

SBIN ON URGE TO BREAKOUTSBIN holding the trend line from Last Few Months.
The Panic breakout is of trendline has been Recovered & It looks good Above 850 Levels.
Having a Bullish bias right now Because all higher Timeframe indicates Bullishness.
Wait for the Move Confirmation.
HAPPY TRADING

SBIN - Classic Textbook Pattern!It is a risky bet since it made a huge doji on Weekly TF and the selling volume is huge on that candle though the prices are sitting at a good level, one can plan a LONG position with 10-15% MAX SL. However, the RRR doesn't look good to me honestly...
Trade details:
Entry - CMP 840
SL - 799
TP - 850,900
- Stay tuned for further insights, updates and trade safely!
- If you liked the analysis, don't forget to leave a comment and boost the post. Happy trading!
Disclaimer: This is NOT a buy/sell recommendation. This post is meant for learning purposes only. Please, do your due diligence before investing.
Thanks & Regards,
Anubrata Ray

SBIN Weekly Update 07/JUN/24SBIN is Crrently not good at Levels to plan Entries.
A Rising wedge pattern is Recognised on WEEKLY TIMEFRAME. More dips to come soon.
As it did not break above The 3rd june Pqnic High.
A regular Bearish divergence on RSI to be found with the pattern.
MONTHLY RSI > 60
WEEKLY RSI > 60.
DAILY RSI < 60.
Will sit back & regognise the pattern formations.
HAPPY TRADING
