VWAP Flip Strategy–Most Accurate Setup for Intraday Trend Shift!Hello Traders!
One of the cleanest signs of intraday trend shift happens right at the VWAP — the volume-weighted average price. Most traders use VWAP as a trend guide, but they miss one powerful signal called the VWAP Flip .
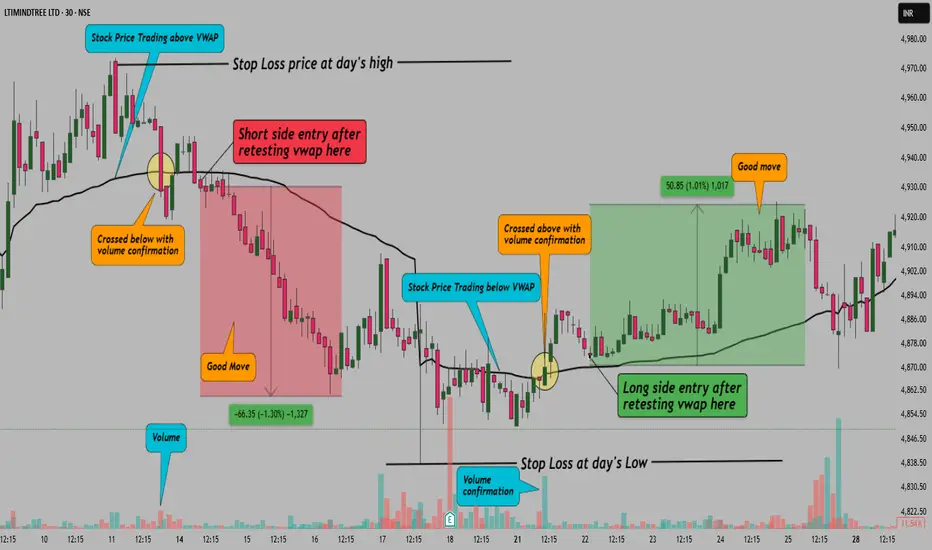
When price flips from staying below VWAP to breaking above and holding — or vice versa — it often marks the start of a fresh trend. And if volume supports the move, the accuracy becomes even stronger.
What is the VWAP Flip?
It’s when price has been consistently staying on one side of VWAP, and then crosses over with conviction and starts respecting the other side.
For example, if price was trading below VWAP all morning and then breaks above with a solid candle, retests, and holds — that’s a bullish VWAP flip.
Why This Strategy Works
VWAP reflects average trader sentiment: When price flips above, it shows buyers are gaining strength
It filters false breakouts: Flip + retest helps avoid fake moves during sideways markets
Volume confirms conviction: A flip with increasing volume shows strong intent behind the shift
How to Trade the VWAP Flip
Step 1: Identify whether price is respecting VWAP from one side
Step 2: Wait for price to flip — clean break and candle close on opposite side
Step 3: Look for a retest of VWAP. Entry should be near VWAP with small stop loss
Step 4: Exit at previous day’s high/low or next support/resistance zone
Entry + SL + Target (Example Setup):
Entry: On candle close and retest above VWAP
Stop Loss: Below retest candle low
Targets: 1:2 RR minimum or trail till trend continues
Note:
This setup has been identified using the 5-minute timeframe, as it offers better intraday structure for the VWAP Flip strategy. However, since TradingView does not allow drawings below 15-minute timeframe for sharing or publishing, I initially marked the levels and structure on the 5-minute chart, took a screenshot, and then placed it over the 30-minute chart for visual representation.
Rahul Tip:
Use VWAP Flip only in trending environments. Avoid it in flat days. Combine it with 5 EMA or volume spikes for extra confirmation. Also, mark high-impact news times to avoid random flips.
Conclusion:
VWAP Flip is one of the cleanest, low-risk, high-reward intraday setups when used with proper structure and confirmation. Practice spotting it in real time — and it might become your new favorite setup.
Have you used VWAP Flip before? Let me know your win rate or drop a chart example in comments.
Scalpingstrategy
GOLD 16/07 Minor Pullback Before PPI? Bears May Reclaim Control!GOLD 16/07 – Minor Pullback Before PPI? Bears May Reclaim Control!
🌍 Market Overview: Inflation Softens, But Risk Remains
Gold is currently trading around $3,334 after a sharp correction earlier this week. While core US CPI data for June came in lower than expected, institutions like BlackRock are signaling concerns:
The impact of new tariffs is only starting to show.
Consumer prices on appliances and electronics are rising.
As inventories shrink, businesses may pass on costs directly to consumers.
➡️ This reinforces Gold’s long-term value as a safe-haven asset, especially with rising macroeconomic risks and uncertainty around the Fed's next move.
📉 Technical Insight: Pullback or Trend Continuation?
Yesterday’s CPI release triggered a sharp drop, pushing price back to the 332x zone.
This created a Fair Value Gap (FVG) on the H1 chart.
Around the 3347–3349 level, we see a Continuation Pattern (CP) forming, hinting that the main downtrend might resume after a temporary bounce.
💡 If price returns to the 334x–336x supply zones during the London or New York session, these will be critical SELL zones. Expect price to potentially target the FVG liquidity area below 329x if bears regain control.
📊 Key Trade Setups
🔵 BUY ZONE: 3,296 – 3,294 (Liquidity Trap Zone)
SL: 3,290
TP: 3,300 → 3,304 → 3,308 → 3,312 → 3,316 → 3,320 → 3,330
🔴 SELL SCALP: 3,347 – 3,349 (CP Reaction Area)
SL: 3,353
TP: 3,343 → 3,340 → 3,336 → 3,330 → 3,325 → 3,320 → 3,310 → 3,300
🚨 SELL ZONE: 3,358 – 3,360 (VPOC Zone)
SL: 3,364
TP: 3,354 → 3,350 → 3,346 → 3,340 → 3,330 → 3,320 → 3,300
⚠️ Strategy Note:
With the PPI data release expected to move markets today, price may spike upward in early sessions. Watch closely for bearish rejection candles around CP and VPOC zones before entering. Use proper SL and TP levels to protect capital.
💬 What’s Your Outlook Today?
Do you see gold breaking below 329x to fill deeper liquidity, or will macro risks support a fresh rally?
👇 Drop your thoughts and let’s discuss trade ideas in the comments!

Is a Pullback Coming or Will the Bulls Continue?Gold Faces Resistance at 3300 – Is a Pullback Coming or Will the Bulls Continue?
Market Overview: USD Gains Pressure Gold as Trade Deals Unfold
Gold has been under pressure recently due to the strong recovery of the US dollar. Positive developments in global trade talks and agreements between major nations, including the US, have been a key driver for the USD, which in turn has weighed on gold.
US inflation data continues to show signs of easing, providing the Fed more room to hold off on rate hikes, strengthening the USD.
FOMC meeting minutes due this week will provide further insight into the Fed’s approach to interest rates.
With geopolitical tensions easing and trade deals stabilizing, the demand for safe-haven assets like gold is slightly reduced.
In the short-term, the market is testing crucial levels, and while gold remains bullish in the long run, the current market conditions suggest potential for a pullback before further upside.
Technical Analysis: Gold in a Range-Bound Market
Looking at the H1 timeframe, gold has formed a clear downward channel between 3360 and 3290, which could signal further corrective action if the price remains within this range. If gold fails to break above resistance at 3360, a dip to 3250 might occur, especially if the USD strength continues to put pressure on gold.
However, waiting for confirmation patterns before entering a trade is key. False breakouts can be a risk when price moves quickly through key levels without sustaining momentum.
Buy Bias in Short-Term with Caution on Bearish Moves
Given the current market structure, there is more room for buy opportunities than for selling at the moment. Watch out for a potential bounce back in the 3320-3325 region as gold might test these levels before continuing its rise. The rejection wick on yesterday's D1 candle shows that the sellers are losing control, and buying pressure is starting to build again.
In the M30 chart, there's a continuation pattern forming around the 16-14 zone, which could be an ideal place to enter a buy position if it holds.
Resistance and Support Levels:
Key Resistance Levels: 3302 – 3310 – 3324 – 3335 – 3361
Key Support Levels: 3275 – 3259 – 3248
Trading Strategy – Buy and Sell Zones
BUY ZONE:
3250 – 3248
Stop Loss: 3244
Take Profit: 3254 → 3258 → 3262 → 3266 → 3270 → 3280 → ????
SELL SCALP:
3303 – 3305
Stop Loss: 3310
Take Profit: 3298 → 3294 → 3290 → 3286 → 3280 → 3270 → 3260
SELL ZONE:
3334 – 3336
Stop Loss: 3340
Take Profit: 3330 → 3326 → 3320 → 3315 → 3310 → 3305 → 3300 → ????
Key Updates to Watch: FOMC and Trade Policy News
With FOMC minutes due and trade policy developments on the horizon, it’s crucial to stay alert for any shifts in market sentiment. Ensure you stick to TP/SL levels to protect your account from any unexpected volatility.

Master This 9-21 EMA Setup & Ride Every Intraday Trend Like Pro!
Hello Traders!
If you’ve ever struggled to time entries during fast-moving markets, today’s post is for you. The EMA 9-21 Bounce Setup is a momentum-based strategy that gives high-probability entry points — especially in trending markets. Whether you’re a day trader or swing trader, mastering this EMA combo can help you ride the trend with better precision.
What is the EMA 9-21 Bounce Setup?
EMA 9 & EMA 21 Combination: These two exponential moving averages help identify short-term trend direction and dynamic support/resistance.
Bounce Confirmation: When price pulls back to the zone between EMA 9 and EMA 21 and shows a bullish or bearish reversal candle (like a hammer or engulfing), it often indicates continuation.
Trend Filter: Only trade in the direction of the overall trend (i.e., price above both EMAs in uptrend, below both in downtrend).
Live Chart Example from 20–21 May 2025 (Nifty50 Index):
Bearish Setup – 20th May, 11:15 AM:
-EMA 21 crossed above EMA 9 → Bearish crossover
-Price traded fully below both EMAs
-Index fell –246 pts (-0.99%)
-PE 24900 Option shot up +46.65%
Bullish Setup – 21st May, 9:30 AM:
-EMA 9 crossed above EMA 21 → Bullish crossover
-Price stayed above both EMAs
-Index gained +202 pts (+0.82%)
-CE 24900 Option gave +62.90% return
How to Trade It Effectively
Entry Point: Wait for the price to touch the EMA 9–21 zone and form a bullish reversal pattern (for long trades) or bearish pattern (for short trades).
Stop Loss: Place below the most recent swing low or high (depending on trade direction), slightly beyond the EMA 21.
Profit Target: Use previous swing highs/lows or a fixed risk-reward (like 1:2 or 1:3), depending on market volatility.
Volume Confirmation: Look for a volume spike on the bounce candle for stronger confirmation.
Why It Works So Well in Fast Markets
Dynamic Support/Resistance: EMAs adapt quickly to price movement, giving real-time guidance.
Momentum-Friendly: This setup thrives when trends are strong and pullbacks are short-lived.
Quick Signals: Perfect for scalpers and intraday traders needing fast setups in volatile sessions.
Rahul’s Tip
Avoid sideways markets! This strategy works best when there’s momentum. Always confirm the trend on a higher timeframe and never chase — wait for the bounce to come to your zone.
Conclusion
The EMA 9-21 Bounce Setup is a powerful addition to any trader’s toolkit. Simple, effective, and clean — it allows you to enter high-probability trades with confidence during trending markets.
Have you used this EMA combo in your strategy? Let’s discuss your experience in the comments!
If you found this post valuable, don't forget to LIKE and FOLLOW!
I regularly share real-world trading setups, actionable strategies, and learning-focused content — all from real trading experience, not theory. Stay connected if you're serious about growing as a trader!

How I Use Relative Volume (RVOL) to Find Intraday Movers!Hello Traders!
If you're looking for stocks that actually move during the day — not those that sit flat and waste your time — Relative Volume (RVOL) is your best friend. It helps you spot where the action is, where smart money is flowing, and where momentum is building.
Let me share how I personally use RVOL to filter intraday trades with high potential — and how you can use it too.
What is Relative Volume (RVOL)?
RVOL measures today’s volume vs. its average volume:
It tells you whether a stock is trading with more or less activity than usual.
Formula:
RVOL = Current Volume / Average Volume (typically 10 or 20-day average)
Why it matters:
Higher RVOL = Higher interest = More volatility = More opportunity
How I Use RVOL in My Intraday Setup
Look for RVOL above 2.0 before 10 AM:
This shows early momentum and strong interest — a great sign for day trading setups.
Combine RVOL with price action at key levels:
If a stock is breaking resistance/support with high RVOL, it’s more likely to follow through.
Avoid low RVOL stocks:
If RVOL is below 1.0, I usually skip the trade — the move might be too slow or fake.
Watch for spikes on news-based RVOL:
Earnings, upgrades/downgrades, or big headlines often fuel big RVOL spikes — prime for breakout scalps.
Rahul’s Tip
Volume validates price. No matter how beautiful the setup looks, if there’s no volume — it’s just noise. Use RVOL as your momentum filter.
Conclusion
RVOL is a simple yet powerful tool to find real intraday movers . It helps you trade stocks where participation is high and moves are clean. Add it to your pre-market watchlist routine and you’ll notice the difference in your trade quality.
Do you use RVOL in your strategy? Or do you rely on scanners only? Let’s chat in the comments!

PNB, Intraday View for 7-JuneThe price is rejected by the LTMA band.
The probability of a red candle is high, more than 60% on the probability scale.
The level of 120.75 is important to consider for tomorrow's intraday trade.
Disclaimer : This is my pre market analysis and my trading journal. Not a suggestion to buy or sell.
