Concor looks Highly Bullish! #Candlestick PatternConcor looks very bullish for the below reasons,
1. Bullish Harami #candlestick Pattern
2. Confirmation after #candlestick Pattern.
Search in ideas for "CANDLESTICK"

1 DAY TRADE (watch candlestick that are underlined carefully)Remember this for stort term trade watch candlestick that are underlined 45 minutes candlestick buy in good position Bullish recommended

Banknifty Short Term Consolidation(2-3 Sessions)In 4 Hour CandleStick Chart , banknifty tested resistance of 26700 and pulled back.
In 1 Day CandleStick Chart , Banknifty formed Shooting star + Doji Pattern.
This can lead to mild Consolidation for some session.
On Monday(11-06-2018) if Banknifty trades negative for 1-2 hours , then Short with target placed around near term support 26075.
If Trades Positive then don't take Short trade , before initiating long wait of 26700 Breakout for 27100 Target.

Bharti Airtel -Morning Star-Talents/Patterns can't be hidden@398Morning Star –Talents / Patterns cannot be hidden@ 398-408
Fold your hands & say thank you to Morning Star- They will feel nice.
Talents/ Patterns cannot be hidden for long, they are like bubble or soda pop in the fizzy water.
Megha Mishra, A talented kid for the music industry is all set with her mind blowing song "Who am I" for an upcoming movie- Secret Superstar.
As talents, patterns also can’t be hidden – you feel it & It will explode. As I, felt when pattern was about to rise like the bubble in the half way session for 11th Sep2017.
What is a 'Morning Star'
A morning star is a bullish candlestick pattern that consists of three candles. The first bar is a large/small red candlestick located in a defined downtrend shown by downside arrow, the second bar is a small-bodied candle (either red or green) that closes below the first red bar, and the last bar is a large green candle that opens above the middle candle and closes near the centre of the first bar's body or above high of the 1st red candle. In later case, it suggest that bulls control the situation for that moment.
In the chart, the Morning star pattern or Meghna Mishra Talent was shown using an oval shape.
We have a channel in which price is moving & we expect price to touch 408-411 zone where 408 is the rejection zone level & 411 is the upper edge of the channel. Likely we see price testing the zone as suggested above & if you feel, it is getting resistance, don’t forget to sell for targets 398-395-390 later this week but not on emotional grounds only if you get bearish confirmation on top end/close to the channel top.
Key levels downside - 398.50
Previous Analysis - Falling from 438 to 395 - Game of Patience

Nifty candlestick data Hi Guys ,
Need some help on candlestick data .
After the market closes at 3.30, there is a final candlestick data added (As per my understanding as the market closes , the execution engine still has few trades to execute , so it reports that data after the 3.30 pm tick).
I wan't to know how much significance you give to this data ? On daily chart it adds a quite significance sometime to nature of candelstick especially if there is breakout or breakdown etc.
Refer to 15 min nifty today's chart above , Somehow tradingview doesn't show that data on 15 min chart , but the daily chart data has that value incorporated .

Nifty Forming Gravestone Doji - Indicating Change In TrendOn weekly Chart, it is been observed that there is a formation of Gravestone Doji candlestick that indicates bearishness. It forms in uptrend market to suggest change in trend. As showed in the chart, Nifty -0.96% is been trending up forming new upside breakouts and waves for a while, it is been now observed with a Gravestone Doji, that indicates change in trend or "Party over for bulls" for a short time.
Gravestone Doji :
1. Formed when opening and closing price are almost equal.
2. Long upper shadow suggests that buying pressure was countered by high selling pressure, rejecting higher prices
3. This candles indicates turning point of a trend, known as bearish reversal candlestick
In all, bulls pressure to take prices up has been completely rejected by sellers waited at resistance, indicating change in trend.

ICICI BANK ( 1D ) 🎯 TRADING PLAN 🎯
✔ Price Action shows strong support
At the 78.60% Fibonacci Retracement
With a Bullish Harami Candlestick
Pattern.
✔ RSI being Oversold adds weight to
The setup.
💡 Success in trading doesn't come from
Predicting the future ; it's come from
Disciplined decision making.
Disclaimer : All information is for
Educational & Informational
Purpose Only. Not a buy / sell
Recommendation. You are
Solely responsible for your
Trading & Investment decisions

TITAN COMPANY LIMITED ( 1D ) 🎯 TRADING PLAN 🎯
✔ Price Action shows strong
Resistance at the 61.80% Fibonacci
Retracement with a Bearish Harami
Candlestick Pattern.
✔ RSI being Overbought adds weight to
The setup.
💡 Trade your plan not your emotion.
Disclaimer : All information is for
Educational & Informational
Purpose only. Not a buy / sell
Recommendation. You are
Solely responsible for your
Trading & Investment decision.

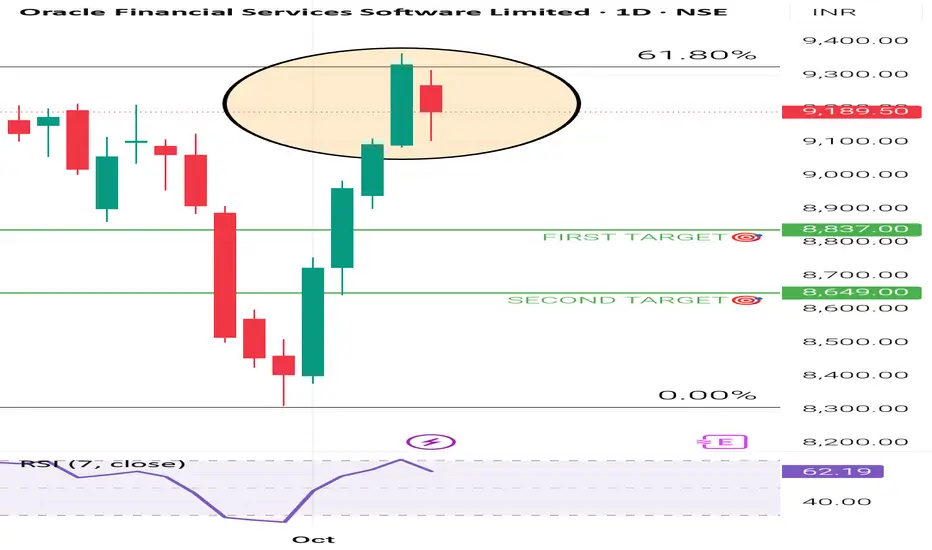
ORACLE FINANCIAL SERVICES SOFTWARE ( 1D ) 🎯 TRADING PLAN 🎯
✔ Price Action shows strong
Resistance at the 61.80% Fibonacci
Retracement with a Bearish Harami
Candlestick Pattern.
✔ RSI being Overbought adds weight to
The setup.
💡 Good Trader's focus on protecting their
Money. Bad Trader's focus on making
Money.
Disclaimer : All information is for
Educational & Informational
Purpose only. Not a buy / sell
Recommendation. You are
Solely responsible for your
Trading & Investment decision.
BHARTI AIRTEL LIMITED ( 1D ) 🎯 TRADING PLAN 🎯
✔ Price Action shows strong support at
the 78.60% Fibonacci Retracement
with a Bullish Engulfing Candlestick
pattern.
✔ RSI being Oversold adds weight to
the setup.
💡 Great Traders Have Extreme Discipline &
Patience.
Disclaimer : All information is for
Educational & Informational
Purpose Only. Not a buy / sell
Recommendation. You are
Solely responsible for your
Trading & Investment
Decisions.

INDIAN HOTELS🎯 TRADING PLAN 🎯
✔ Price Action shows strong support
At the trend line with a Bullish Harami
Candlestick Pattern.
✔ RSI being Oversold adds weight to the
Setup.

SHRIRAM FINANCE LIMITED ( 1D ) 🔑 KEY LEVELS 🔑
✔ Fibonacci Retracement 50%
✔ Trend Line Act as Resistance.
✔ RSI Also Overbought Zone.
🎯 TRADING PLAN 🎯
✔ Near the key levels , Bearish Engulfing
Candlestick Pattern has formed.
✔ The Entry Point is @ 625.45
✔ The Stoploss Point is @ 638.00
✔ The First Target is @ 577.00
✔ The Second Target is @ 553.00
💡 A Trader must be Strategic , Patience ,
Confident , Discipline & Protective. Like
A Lion.
Disclaimer : All Information is for
Educational & Informational
Purpose Only. Not a Buy / Sell
Recommendation. You are
Solely responsible for your
Trading & Investment
Decisions.

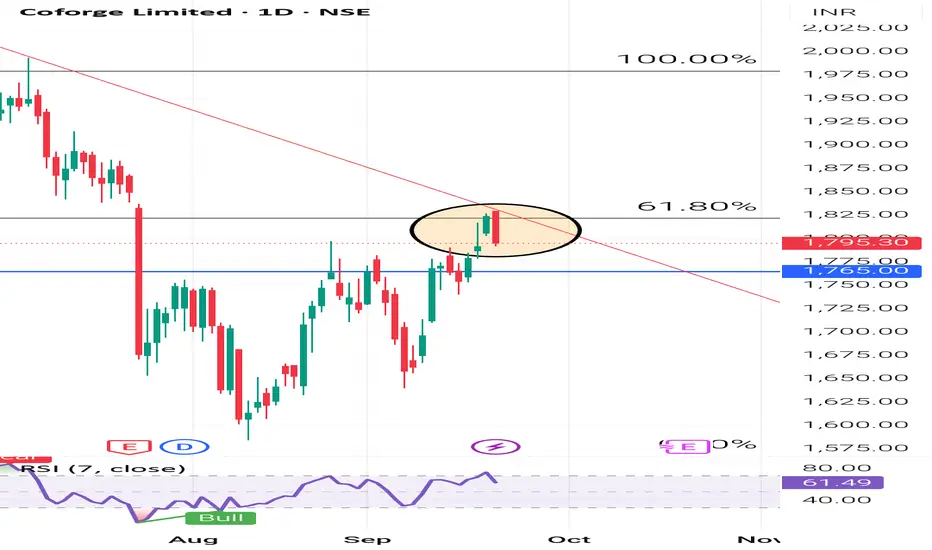
COFORGE LIMITED ( 1D ) 🔑 KEY LEVELS 🔑
✔ Fibonacci Retracement 61.80%
✔ Trend Line Act As Resistance.
✔ RSI Also Overbought Zone.
🎯 TRADING PLAN 🎯
✔ Near the key levels , Bearish Engulfing
Candlestick Pattern has formed.
✔ The Entry Point is Below @ 1792.10
✔ The Stoploss Point is @ 1830.00
✔ The First Target is @ 1681.00
✔ The Second Target is @ 1601.00
💡 Never, ever argue with your trading
System.
Disclaimer : Educational & Informational
Purpose Only. Not a Buy / Sell
Recommendation.
ASIAN PAINTS LTD ( 1D ) 🔑 KEY LEVELS 🔑
✔ Fibonacci Retracement 38.20%
✔ Trend Line Act as Support.
✔ RSI Also Oversold Zone.
🎯 TRADING PLAN 🎯
✔ Near the key levels , Bullish Harami
Candlestick Pattern has formed.
✔ The Entry Point is Above @ 2496.90
✔ The Stoploss Point is @ 2474.50
✔ The First Target is @ 2601.00
✔ The Second Target is @ 2705.00
💡 Discipline is the bridge between goals &
accomplishment.
Disclaimer : Educational & Informational
Purpose Only. Not a Buy / Sell
Recommendation.

BRITANNIA INDUSTRIES LTD ( 1D ) 🔑 KEY LEVELS 🔑
✔ 6240 - 6300 Selling Zone.
✔ Trend Line Act As Resistance.
✔ RSI Also Overbought Zone.
🎯 TRADING PLAN 🎯
✔ Near the key levels , Bearish Harami
Candlestick Pattern has formed.
✔ The Entry Point is @ Below 6207.00
✔ The Stoploss Point is @ 6319.50
✔ The First Target is @ 5929
✔ The Second Target is @ 5777
💡 The goal of successful trader is to make
the best trades. Money is secondary.
Disclaimer : Educational & Informational
Purpose Only. Not a
Buy / Sell Recommendation.

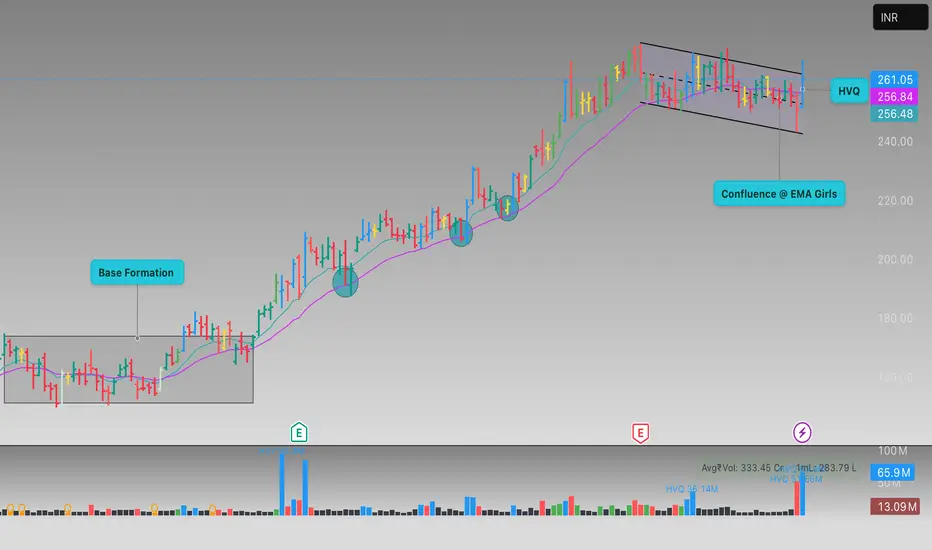
RBLBANK Daily Price Action & Key Technical PatternsThis TradingView chart displays the daily candlestick price movement of RBLBANK in INR, highlighting important technical patterns and zones. The chart features a “Base Formation” region, an upward breakout followed by steady bullish momentum, and a consolidation phase (flag channel) at higher levels. Key technical elements include two Exponential Moving Averages (EMAs), support and resistance zones, and high volume clusters (HVQ) indicating significant trading activity. Annotations such as “Confluence @ EMA” and volume bars further assist in identifying potential entry and exit points for traders.
Positional or longterm opportunity in CESCGo Long @ 139.6 for Targets of 165, 185.8, and 276.5 with SL 124.2
Reasons to go Long :
1. On a Weekly timeframe if we draw the Fibonacci retracement tool from the recent swing low (point A) to the recent swing high (point B) then we see stock took support from the 0.618 Fibonacci level.
2. Besides, a bullish candlestick pattern Bullish Engulfing (marked with orange) is formed around the 0.618 Fibonacci level.
3. Also there is a strong Trendline (marked with green color) which earlier was acting like resistance but now is providing support to the stock.

Abondoned baby candlestick in upward trendThe price has taken some breather and may resume it's upward run
Decent entry with strict target and stoploss offers you a good Risk Reward ratio

BRITANNIA INDUSTRIES LTD. – TECHNICAL INSIGHT________________________________________________________________________________
📊 BRITANNIA INDUSTRIES LTD. – TECHNICAL INSIGHT
📆 Date: July 8, 2025 | 🕒 Daily Chart
📍 Symbol: NSE: BRITANNIA
💡 Educational Breakdown – For Study & Learning Only
________________________________________________________________________________
🔹 Price Action Overview:
Britannia closed at ₹5,884.00, up by +1.95%, forming an “Above the Stomach” bullish continuation pattern just below a key resistance zone.
________________________________________________________________________________
🔴 Top Range (Resistance): ₹5,899.50
📉 Bear Strength: 53
The price has approached a previous supply zone where sellers have shown resistance. Watch this level closely for either a breakout or rejection.
________________________________________________________________________________
🟢 Bottom Range (Support): ₹4,506
📈 Bull Strength: 77
This zone acted as a strong demand base in the past, initiating a rally with a sharp volume spike.
________________________________________________________________________________
🔍 Pattern Focus: Above the Stomach
A bullish candle has opened above the midpoint of the previous red candle, suggesting buyer strength. This often signals momentum continuation, especially near breakout levels.
________________________________________________________________________________
🎯 What to Watch For:
✅ Breakout Confirmation Zone:
If price closes decisively above ₹5,900 with volume expansion, it may indicate strength and fresh upside continuation.
________________________________________________________________________________
🚫 Failure Zone:
If price faces rejection near ₹5,900–₹5,920 and forms a bearish engulfing or strong upper wick, short-term profit booking could occur.
________________________________________________________________________________
📌 Risk Management Tip:
Traders typically look for entry above breakout candle high with a stop below recent swing low or candle low. Volume confirmation is essential before considering directional bias.
________________________________________________________________________________
🔍 Contextual Takeaway:
This is a textbook example of price consolidating just below a resistance after a strong trend and forming a bullish candle setup. A breakout or failure here can define the next leg of the move.
________________________________________________________________________________
📚 Stay objective, wait for confirmation, and let the price lead.
________________________________________________________________________________
Entry Above ₹5,905–₹5,920 (on breakout)
Stop Loss ₹5,765
Risk Reward 1:1 | 1:2 +
________________________________________________________________________________
⚠️ Disclaimer:
This analysis is for educational purposes only.
STWP is not a SEBI-registered advisor.
No buy/sell recommendations are made.
Please consult your financial advisor before trading.
STWP is not responsible for trading decisions based on this post.
________________________________________________________________________________
What’s your view on BRITANNIA ? Comment below ⬇️
🔁 Share this if you're tracking the stock
✅ Follow STWP for clean Price Action + Candlestick patterns
🚀 Be Self-Reliant | Trade with Patience | Learn with Logic
________________________________________________________________________________

Positional or Longterm Opportunity in ABBGo Long @ 5432.1 for Targets of 6510, 7015, 7520, and 8024.7 with SL 439.15
Reasons to go Long :
1. On a Weekly timeframe if we draw the Fibonacci retracement tool from the recent swing low (point A) to the recent swing high (point B) then we see stock took support from the 0.5 Fibonacci level.
2. Besides, a bullish candlestick pattern Bullish Engulfing (marked with orange) is formed around the 0.5 Fibonacci level.
3. In addition to this there is a strong demand zone (marked with purple) which earlier was acting like resistance but now is providing support to the stock.

Positional or Longterm Opportunity in Axis BankGo Long @ 1005.05 for Targets of 1123, 1182, 1275.35, and 1320.4 with SL 960
Reasons to go Long :
1. On a Weekly timeframe if we draw the Fibonacci retracement tool from the recent swing low (point A) to the recent swing high (point B) then we see stock took support from the 0.382 Fibonacci level.
2. Besides, a bullish candlestick pattern Bullish Engulfing (marked with orange) is formed around the 0.382 Fibonacci level.
3. Also there is a strong Trendline (marked with green color) which supports the stock.

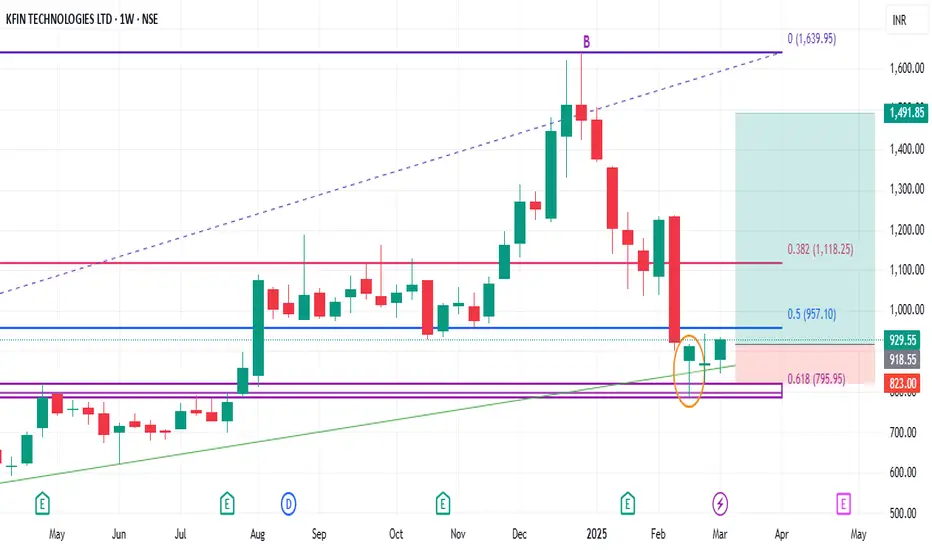
Positional or Longterm Opportunity in KfinechGo Long @ 918.55 for Targets of 1109.65, 1205.2, 1300.75, and 1491.85 with SL 439.15
Reasons to go Long :
1. On a Weekly timeframe if we draw the Fibonacci retracement tool from the recent swing low (point A) to the recent swing high (point B) then we see stock took support from the 0.618 Fibonacci level.
2. Besides, a bullish candlestick pattern Bullish Hammer (marked with orange) is formed around the 0.618 Fibonacci level.
3. In addition to this there is a strong demand zone (marked with purple) which earlier was acting like resistance but now is providing support to the stock.
4. There is also a strong Trendline (marked with green) that is providing support to the stock.
Kalyani Steels trendline breakout - D timeframeKalyani Steels after achieving the target of 1179.50 exited parallel channel and held support at 700 range. Bullish reversal happened at 704.20 (mar 3) and bullish reversal confirmation at 721 (mar 17). Dec 17 '24 ATH to Mar 3 '25 precisely 44.86% fall as anticipated. Now price chart in daily timeframe showing double bottom with inverted hammer (Mar 19) along with RSI double bottom breakout. Weekly chart piercing line (i think) candlestick pattern along with RSI +ve divergence.
