Is Crude Oil rallying its way to hit $140?Commodity Samachar, Pune – On Monday, we saw a drop in the crude oil rate just in the afternoon, but the reason behind it is something truly exciting.
On Monday, the price of oil fell $2 just 2 days ahead of the US. FED meet. This was coupled with the concern about China’s fuel demand growth and Russian crude supply weighted on the market.
As per several indications from market sources, they expect that the US central bank will leave interest rates unchanged when it concludes its 2-day monetary policy meeting happening this Wednesday.
In other news, Goldman Sachs has lowered its price estimate for Brent crude to under $90 per barrel by the end of 2023 after 2 previous reductions. This has been done due to the weak data arrived from China, one of the world’s biggest oil importers.
The final blow to crude oil came from news arriving from Iran. Oil prices fell in the Asian trade after Iran’s supreme leader said that the country was open to a deal with the West over its nuclear programme.
Ayatollah Ali Khamenei, the Supreme leader mentioned that a deal was a possibility if Iran’s nuclear infrastructure was kept intact. The comment by Khamenei paved the way for fear pertaining to a nuclear deal among oil traders given that it could flood the market.
Monthly Chart Outlook – Crude Oil:
On Monday, technical analysts at Commodity Samachar witnessed a rally going on up to a higher level from a lower level.
From that point onward, it hit a high of 123.66 points. After consecutive highs, there was a significant fall in crude oil prices. Currently, it is trading at a rate of $68.
However, we expect that it shall remain in between the $65 – $61 range and there will be a buying opportunity with a positional stop loss of $40.
Traders can initially see an upside target of $110 and it will stretch to $125. Finally, crude oil will rally and reach a magnificent high of $140. Traders will be able to see such a high level in the market.
All traders should anticipate something big on the way. A Fibonacci extension is being seen in the current crude oil chart.
The Fibonacci extension that’s forming will hit its first target of 0.38%, then it will follow the trend and hit 0.50% and the final target would be 0.61%.
For crude oil to reach its target, it shall be completing 24-36 months. We are expecting crude oil to reach a target of $140.
Crude oil’s Initial resistance at $75
many questions remain to be answered. We’ll be back with updates on this sensational news.
Commodity Samachar
Learn and Trade with ease
Search in ideas for "COMMODITY"

Natural Gas Analysis: Commodity TradingNatural Gas go hand in hand both in international market as well as Indian market. Here we present natural gas Elliott Wave Analysis. It is showing a 5 wave decline as wave A and again will go up for a three wave B, then again come down in a C wave.
You can correlate this chart with MCX Natural gas. Both are the same. Hope it will enlighten your commodity trading.
:) Please like and share our ideas.
:) For any query comment please.

Commodity Analysis: Silver – Potential Short-Term UpsideHello, Traders! 👋
Silver is shaping up for an interesting move:
📈 Technical Overview:
🔹 Higher low formed on the weekly chart, suggesting potential accumulation.
🔹 My ILTF indicator has already signaled a BUY, but the price remains sideways for now.
🔹 A breakout above 92,000 could trigger a short-term upmove toward the all-time high (ATH).
💡 Current Plan:
I’m not holding any position currently but closely watching for momentum on the daily chart. If a breakout occurs, I may consider initiating a pilot position to capture the move.
⚠️ Disclaimer:
🔹 I am not a SEBI-registered advisor.
🔹 This analysis reflects my personal views and is not a recommendation to buy or sell.
🔹 Shared purely for learning purposes—please conduct your own research or consult a professional before trading.
Keep an eye on Silver—things might get shiny soon! 💡

[Commodity] Crudeoil Channel and Market OverviewIn continuation of the previous trade , We need to close the trade and wait for re-entry on the selling point again or reversal of the trade.
Personally, I will root for the buy trigger.

Crude Oil-current contract analysislevels mentioned in the chart
if u want learn commodity trading.
just start with(just follow) only one commodity.this it better optoin for making money from the commodity market.

Cup & Handle Pattern Breakout Seen in Guar GumHello Guy's, i have brought analysis for Commodity lovers on Guar Gum. Chart is clearly showing a Cup and Handle breakout on daily timeframe and it is supported by rising volume. MACD is sustaining above zero line and has formed a bullish crossover. All these observations are seen in the daily timeframe chart. A long trade can be taken in this Guar Gum for healthy upside. Well i have written everything on chart, but still writing here.
Important levels in Guar Gum:-
Buy between in the range of 13300-13000 levels.
Targets we can see in upside 14078/15166/15836.
Keep stop loss at 12538.
Bullish Crossover in MACD supports the bullish view.
So, Guy's according to Price action and MACD bullish crossover, a rally is expected towards 15000+ levels. So trade accordingly.
Disclaimer:- Please always do your own analysis or consult with your financial advisor before taking any kind of trades.
Dear traders, If you like my work then do not forget to hit like and follow me, and guy's let me know what do you think about this idea in comment box, i would be love to reply all of you guy's.
Thankyou.

GOLD Future Trend analysis commoditytraGold Future trading at consolidation range
Already double bottom and recovery from there...
GOLD Future BUY above 50538
once the trend line breakout go long in Gold Future .

NATURAL GAS analysis current contractlevels mentioned in the chart.
just started commodity trading thats why I posting commodity chart
we can learn together guys.
I am also just started...u can ask me any doubts.if i know i will tell u okay
keep supporting guys
short term equity calls+multi bagger call are coming mean working in background.
will post.okay thanku guys


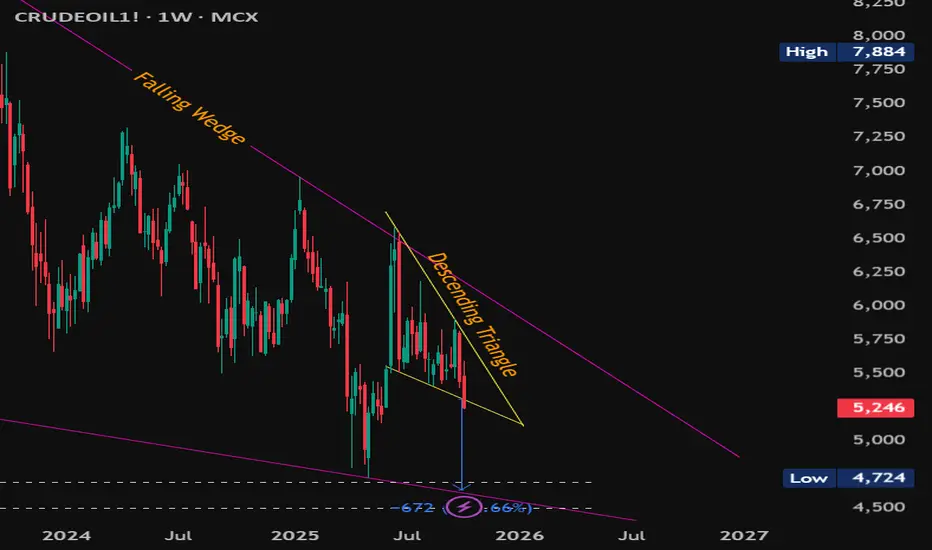
#MCXCrudeOil Weekly – Breakdown into Major Support Zone#MCXCrudeOil Weekly – Breakdown into Major Support Zone
CMP: 5,246
Crude Oil has broken down from a descending triangle with a confirmed weekly close below 5,308 , triggering target of 4,636 . This move unfolds within a larger falling wedge pattern , adding confluence and signaling potential volatility ahead.
This breakdown aligns with two key confluences :
📉 The falling wedge lower trendline.
🟠 A major historical demand zone at 4,692 – 4,499 , which was previous resistance turned strong support on multiple occasions.
This make-or-break support zone could act as:
🔄 A reversal zone , potentially triggering a bullish breakout from the wedge.
📉 Or, if breached, it may invalidate the wedge and lead to extended downside.
Key Levels:
Resistance: 5,903 & 6,184 (price action + wedge top)
Support: 4,692 – 4,499 (confluence zone)
Breakdown Target: 4,636 (descending triangle pattern)
Watch weekly candle behavior near this zone closely for signs of either rejection or continuation .
#CrudeOil #MCXCrude #ChartPatterns #FallingWedge #DescendingTriangle #PriceAction #BreakdownAlert #SwingTrading #CommodityTrading
📌 Disclaimer: This analysis is shared for educational purposes only. It is not a buy/sell recommendation. Please do your own research before making any trading decisions.
Silver going for 72000+ ? #silverInverse Head and Shoulder pattern formation in Silver commodity.
Potential targets 72000+.

NATURAL GAS LOOKING GOOD IN 4HR TIME FRAMENatural gas is looking bullish
REASONS
1. Recently given a breakout of its flag and pole pattern.
2. Breakout of an inverted head and shoulder pattern.
Reasons for the target and stop-loss
1. the high of this commodity has been taken as a target as per the rules of the pattern.
2. volume profile is also supporting this commodity and also the 50ema.
3. so with the support of both indicators stop loss had been set.

Sell Copper with a Stop Loss of 731.20Sell copper near ₹ 727 with a Stop Loss of ₹ 731.
I analys Indian commodity market on a regular basis. I just earned 4800 points in SilverM, 2400 Points in GoldM and 240 Points in Crude Oil, however i wrongly entered in short position in nifty that made me some losses. But i believe losses are part of good trades.


2020's Uptrend Channel Is Everything For MCX NickelMCX Nickel is following the above uptrend channel from 23 Jan 2020. And making a good trade opportunity for commodity traders. Nickel's upward trend is not over yet. But we may see a downfall below the control price, and it can be up to 1686 - 1620 .
But what happens if it breaks the control price?
It's a 100% sign for a buy signal. But intraday or short-term investors should confirm that breakout before proceeding. And they must look out for candle's fakeout. Afterward, be ready for the targets of 1800 - 1840 - 1876+ .


Silver Commodity - Breakout in Day TimeFrameSince September, silver futures have been consolidating, indicating a period of price stability and indecision among traders. As of today, January 30, 2025, the market has experienced a breakout from the established trendline, signaling a potential shift in momentum. This breakout could suggest renewed buying interest and the possibility of upward price movement, making it an opportune time for traders to reassess their positions and strategies in light of this development.

Looking for trade setup on Gold. Have a look at this. XAU/USD.XAU/USD on daily timeframe has switched from bullish to bearish but it’s still Bullish on weekly. We will take about weekly later but daily chart itself is speaking a lot of things.
We marked the market structure and it can be seen that there are multiple Orderblocks and Fvg that are pending and has to be mitigated before getting into Bullish bias.
For buy our plan would be to wait for any continuation trend on smaller time frame usually in 1Hr or 15min. For sell setup we would wait for a market structure shift on 1HR or 15min time frame. We are neutral for now & we need more validations. We have weekend coming. Forex & Commodity market doesn’t really have the volatile Mondays.
For a really nice setup we would have to be patience and need to follow our plan of action.
Follow us any stay updated with more setups tuning in.
Appreciate you’ll time.
Note this is for educational purposes only.

9500 to 19000| Turmeric's Resurgence Sparks New Trading Buzz!Turmeric has emerged as a notable script in recent months, experiencing a substantial rally from 9500 to 19000. This impressive performance has reignited interest in the commodity. Presently trading at Rs 12500, a level significantly below its recent high of Rs 19500, Turmeric has garnered renewed attention.
Our strategic trading plan involves closely monitoring Turmeric's price action. Should it find support within the range of 11590 to 11860 , we are inclined to consider an entry point. In this scenario, our stop-loss will be set below 10300 to manage risk effectively.
We invite you to stay tuned for further updates as we navigate potential opportunities in the Turmeric market. Your continued engagement is valued on this exciting journey.
Best regards,
Rahul Khandelwal
WEALTH BY TRADE

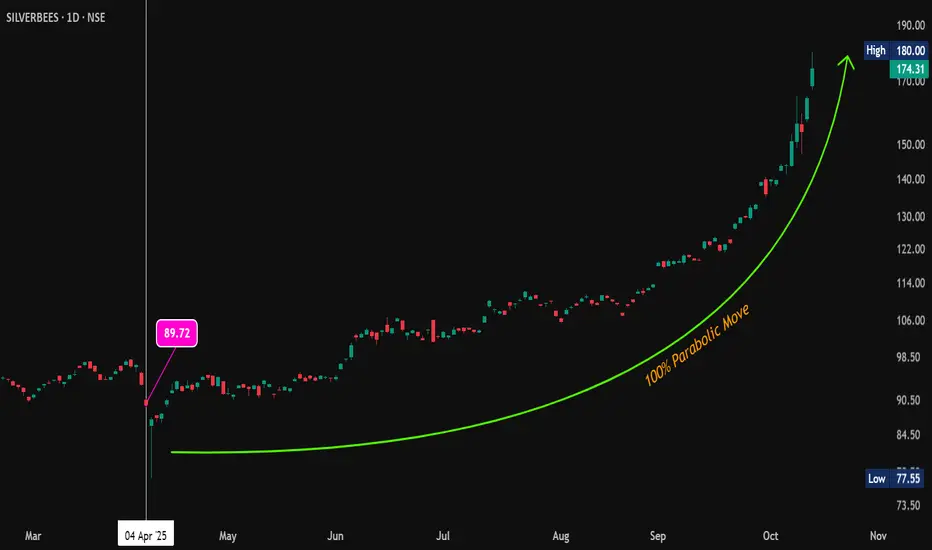
#SilverBees Doubled – Parabolic Move! #SilverBees
🚀 #SIP Strategy Delivers 💯%+ Returns 🥈🔥
On April 4, 2025 , suggested starting SIP in SilverBees at 89.72.
📉 The very next trading day , it dipped to 77.55 , a quick test of conviction.
📈 Since then, it’s been a parabolic rally to 180, with no looking back!
✅ Patience paid off
✅ SIP in commodities works, just like in stocks ( if started at the right time )
✅ Real assets like silver can be powerful wealth creators
⚠️ Going forward, be prepared for volatility.
After such a sharp move , price swings and corrections are normal. Stay disciplined and focus on your strategy.
🥈 Silver continues to shine. Are you riding the trend?
#SilverBees | #SilverETF | #Silver | #SIP | #ETF | #CommodityInvesting | #SmartInvesting
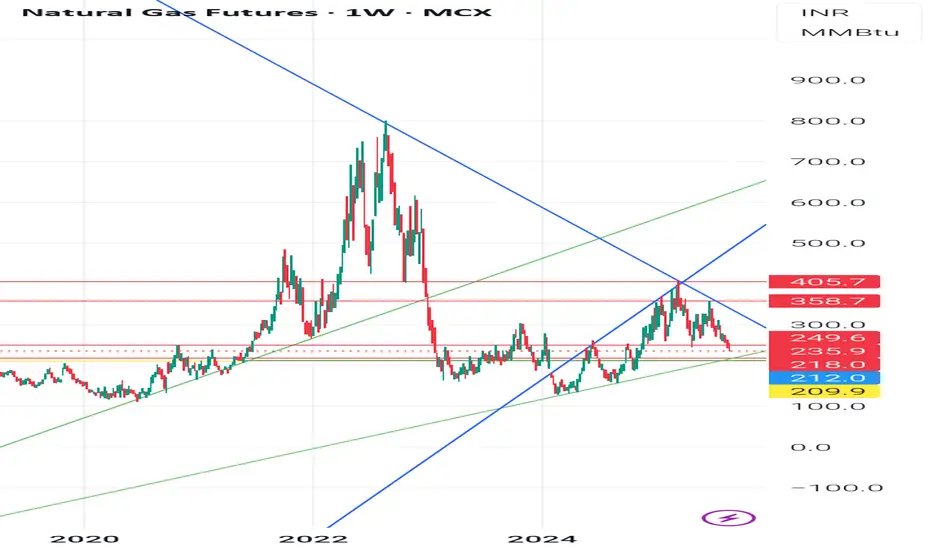
Natural Gas Futures (INR) Weekly Chart pattern analysisNatural Gas Futures (INR) Weekly Chart pattern analysis.
For the students, We will include chart structure, patterns, demand-supply zones, and precise support/resistance levels based on what is seen on the charts :
- Chart OverviewTimeframe: Weekly (1W)Current Price: 244.7 (down -5.30%)Price is near an important ascending trendline support (green line) after a strong correction from recent highs. Structure shows earlier breakout above descending trendline (blue) followed by a retest and rejection.
🧭 1. Trend Analysis- Long-Term Trend:From 2022 highs (900+), Natural Gas was in a sharp downtrend (blue descending trendline).Downtrend broke in late 2023, initiating a mid-term uptrend within an ascending channel.
Short-Term Trend:Since the 405.7 high (early 2025), prices are in a correction phase.Price now testing demand zone near 244-212.
📈 2. Chart Patterns,Ascending Channel: Price has been moving between parallel green lines since late 2023.Breakdown Risk: Price is testing the lower channel line; breakdown could trigger more downside.Head & Shoulders Possibility: The highs around 405-358 resemble a left shoulder-head-right shoulder formation, with neckline near 249-244. A confirmed break below could accelerate selling.
Supply Zone Rejection: Strong selling emerged from 358-405, marking it as a supply zone.
3. Key Technical Levels: Rejection Level: High Significance 405.7
-Major Supply 2025 high, strong rejection point 358.7
Secondary Supplying- Recent swing high before sell-off
249.6-244.7
- Current Zone - Channel support & neckline zone
218.0 - Demand Zone Past consolidation & buying interest
212.0 - Strong Support Historical demand zone floor
209.9
- Critical Support
If broken, opens path to 180-160⚖ 4. Demand & Supply ZonesDemand Zones:218-212 (weekly accumulation area)180-160 (last major base before rally)
Supply Zones:358-405 (heavy selling area)280-300 (minor supply if bounce occurs)
5. Possible ScenariosScenario
1 Support Holds:If 244-212 holds, expect a bounce towards 280 and 300.A close above 300 could re-test 358.
Scenario
2 - Breakdown:A close below 212 could lead to a quick drop towards 180-160.
👉 Disclaimer:
This is for educational purposes only, not trading advice. Futures & commodities are highly volatile; manage risk and consult a registered financial advisor.
#naturalgas #technicallevels #chartpatternabalysis #commoditytrading