MCX ,1D formed shooting starNSE:MCX Multi Commodity Exchange of India Ltd is a commodity exchange based in India. It was established in 2003 by the Government of India and is currently based in Mumbai. It is India's largest commodity derivatives exchange.
MCX formed shooting star at daily timeframe (and gave closing below it) on resistance of parallel channel.
Entry : 1796
Target : 1648
SL : 1885
RR : 1.66
Search in ideas for "COMMODITY"

Silver May Futures #Intraday25-Apr 4:41 PM
Silver May Futures #Intraday
Sell at CMP- 74250
Stop loss - 74760
Target- As par strategy indicates
*For regular updates DM me*
Disclaimer- We are not SEBI registered advisor.
Charts and views are only for educational purpose.
#NSE #stockstowatch #stockstobuy #swingtrading
#MCX #commodities #commoditytips

Gold June Futures #Intraday11-Apr 11:04 AM
Gold June Futures #Intraday
Buy at CMP- 60390
Stop loss - 60225
Target- As par strategy indicates
Disclaimer- We are not SEBI registered advisor.
Charts and views are only for educational purpose.
#NSE #stockstowatch #stockstobuy #swingtrading
#MCX #commodities #commoditytips

Silver May Futures #Intraday6-Apr 7:47 PM
Silver May Futures #Intraday
Sell at CMP- 74105
Stop loss - 74460
Target- As par strategy indicates
Disclaimer- We are not SEBI registered advisor.
Charts and views are only for educational purpose.
#NSE #stockstowatch #stockstobuy #swingtrading
#MCX #commodities #commoditytips

BHEL Spot #Intraday6-Apr 12:03 PM
BHEL Spot #Intraday
Buy at CMP- 69.9
Stop loss - 69.1
Target- As par strategy indicates
Disclaimer- We are not SEBI registered advisor.
Charts and views are only for educational purpose.
#NSE #stockstowatch #stockstobuy
#MCX #commodities #commoditytips

RBL bank Spot #Shortterm6-Apr 11:16 AM
RBL bank Spot #Shortterm
Buy at CMP- 143.1
Stop loss - 140
Target- As par strategy indicates
Disclaimer- We are not SEBI registered advisor.
Charts and views are only for educational purpose.
#NSE #stockstowatch #stockstobuy
#MCX #commodities #commoditytips

Msumi Spot #Shortterm6-Apr 10:55 AM
Msumi Spot #Shortterm
Buy at CMP- 50.15
Stop loss - 48.3
Target- As par strategy indicates
Disclaimer- We are not SEBI registered advisor.
Charts and views are only for educational purpose.
#NSE #stockstowatch #stockstobuy
#MCX #commodities #commoditytips

Zensar tech Spot #Shortterm6-Apr
Zensar tech Spot #Shortterm
Buy at CMP- 281
Stop loss - 273
Target- As par strategy indicates
Disclaimer- We are not SEBI registered advisor.
Charts and views are only for educational purpose.
#NSE #stockstowatch #stockstobuy
#MCX #commodities #commoditytips

Learn from it #traderlife #tradingskills #forextrader #crudeoiltrader #stockmarkettrader #fulltimetrader #daytrading #intradytraing #swingtrading #cryptotrader #commoditytrader #technicalanalyst #fulltimetrader #trader #traderlife
FINANCIAL MARKETS HAVE CERTAIN AMOUNT OF RISK BEFORE TAKING ANY STEP IN THE MARKETS HAVE PROPER KNOWLEDGE & CONSULT ANY PROFESSIONAL . ANY STEP YOU TAKE IN THE MARKET WOULD BE AT YOUR OWN RISK ! ,

What you think #traderlife #tradingskills #forextrader #crudeoiltrader #stockmarkettrader #fulltimetrader #daytrading #intradytraing #swingtrading #cryptotrader #commoditytrader #technicalanalyst #fulltimetrader #trader #traderlife
FINANCIAL MARKETS HAVE CERTAIN AMOUNT OF RISK BEFORE TAKING ANY STEP IN THE MARKETS HAVE PROPER KNOWLEDGE & CONSULT ANY PROFESSIONAL . ANY STEP YOU TAKE IN THE MARKET WOULD BE AT YOUR OWN RISK ! ,

Just sharing what I like#traderlife #tradingskills #forextrader #crudeoiltrader #stockmarkettrader #fulltimetrader #daytrading #intradytraing #swingtrading #cryptotrader #commoditytrader #technicalanalyst #fulltimetrader #trader #traderlife

Crude took support at 50 EMA. Now slightly bullishCrude, after touching a peak, fell and took support at 50 EMA. Now slightly bullish. Overall trend looks bullish over last few months. Same expected to continue . Indicated as per this report too www.spglobal.com

#Gold Short ( 01 Aug)#Gold Short ( 01 Aug)
RSI-49
Gap down, RSI divergence
Sell at CMP- 51380
SL- 51550
Target- 51185, 51060
Join us, Learn more, Earn more
Disclaimer- We are not SEBI registered advisor.
Charts and views are only for educational purpose.
#mcx #commodities #commoditycall

Gold Price Predictions for 2022In the previous trading session, MCX Gold made a high of 51538 and closed at 51343 ( +444 ). A question is, is it moving upward?
To identify uptrend:
There are two hurdles to continuing the uptrend. It should break out the 5th May high or settle above the control line.
According to the above chart, Gold is forming a bullish flag pattern. And we're waiting for a breakout of the flag pattern. This breakout will skyrocket the gold price, and we can see 6400+ points of bullish movement here. Long-term target for gold 58000 - 60000 .
Gold downtrend confirmation:
But if gold breaks the support trendline (invalidation), then a downtrend may start. And if it happens, I will update you asap.
At present, intraday traders can keep buying for targets of 51500 - 51800+ levels.
Watch significant releases or events that may affect the movement of gold, silver, and crude oil.
Monday, May 09, 2022
04:30 FOMC Member Bostic Speaks - Medium Impact
11:00 Investing.com Gold Index - Medium Impact
18:15 FOMC Member Bostic Speaks - Medium Impact
Tuesday, May 10, 2022
17:10 FOMC Member Williams Speaks - Medium Impact
18:00 FOMC Member Bostic Speaks - Medium Impact
21:30 EIA Short-Term Energy Outlook - High Impact
Wednesday, May 11, 2022
00:30 FOMC Member Mester Speaks - Medium Impact
02:00 API Weekly Crude Oil Stock - Medium Impact
04:30 FOMC Member Bostic Speaks - Medium Impact
18:00 Core CPI (MoM) (Apr) - Medium Impact
20:00 Crude Oil Inventories - High Impact
22:31 10-Year Note Auction - Low Impact
23:30 Federal Budget Balance (Apr) - Low Impact
Thursday, May 12, 2022
10:30 Natural Gas Storage - Low Impact
13:30 IEA Monthly Report - Medium Impact
Friday, May 13, 2022
08:30 Import/Export Price Index (MoM) - Low Impact
11:00 FOMC Member Kashkari - Medium Impact
12:00 FOMC Member Mester Speaks - Medium Impact
13:00 U.S. Baker Hughes Oil Rig Count - Medium Impact

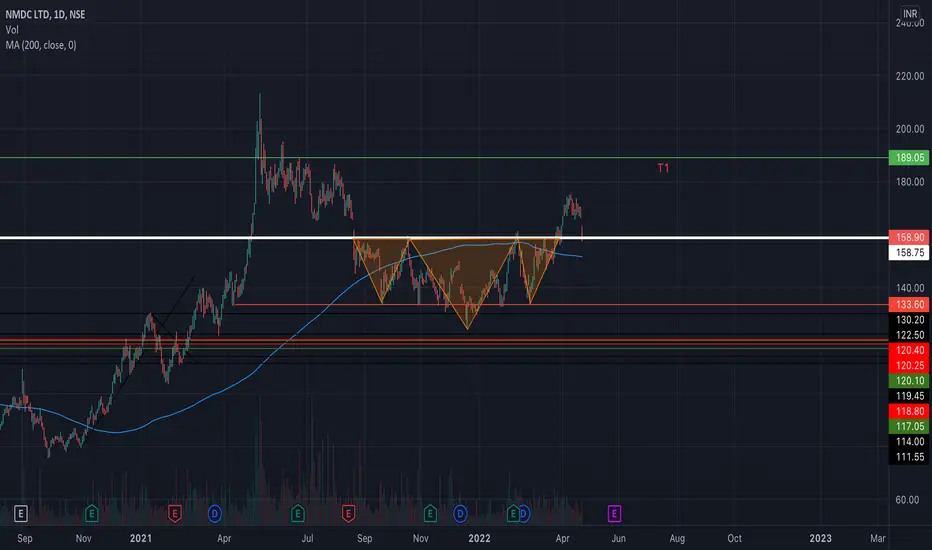
NMDC: Perfect Inverted H&S on Daily TimeframeFundamental Understanding: Higher commodity prices command a greater profitability to the miners. NSE:GMDCLTD rose by 150% in the last 4 months 75 trading sessions for the same reason. NSE:NMDC has a ROCE of 29.6 % and ROE 21.8 % and is almost debt-free (Debt to Reserves is quite low).
The chart forms a perfect head and shoulders pattern on daily timeframe. The price has broken out the neck and is now retesting with reasonable (low to say) volumes. FIIs have increased their stake by 30% QoQ and the navratna PSU looks clean to benefit from the rising commodity prices. Expecting a good upmove due to rise in commodity prices over the Jan-March 2022 quarter. Look out!
For FnO trades, one can take a risky trade with 147 daily closing SL and for the target of 189. For Cash trades, keep adding till ATH for new aggressive moves beyond that.
06OCT2021Global markets (Last Session):
🟢 US markets closed higher paring most of the losses of previous session. But Rusell 2000, smallcap index closed lower.
🟢 European markets opened posItive & maintained the gains till end of sessions. Closed higher with 0.95% to 1.25% gain.
🔴 US 10YR yield rose 3.17%. DXY re to 93.97 mark. Crude oil shoots up another 1.53% and trading above 82.5 at 3YR high.
🔴 DXY after 3 days of cool off has started rising again and trading above 94.02. Seems like it was BO retest after BO.
News And Additional Data:
🔴 Investors optimism outbit worry about the rising commodity prices, inflation, tax hike & tapering, Evergrande crisis.
🟠 Indian equity markets have complete disconnect with the global markets & have outperformed its global peers by miles
🔴 Rising commodity prices & surging crude oil above 82 will turn out to be a major concern for the emerging economies.
Indian Indices Last Session:
🟢 #Nifty opened gap down but seen strong buying interest at lows. #Nifty closed the day near day high with 0.7% gain.
🟢 #BankNifty had a gap down too and remained volatile for the first half. Later joined #Nifty to close with 0.34% gain.
🔴 #Long buildup seen in #Nifty with PV breakout above PDH, Both indices closed strongly near the highest point of day.
🔴 FII's were net seller of 3185+ cr ignoring option figures which could be for hedging. DII were net buyers of 1868 cr.
Technicals:
🟢 Nifty RSIStairs cooled off in daily TF but it remains overbought in W/M. D(67.00), W(75.45), M(79.74) & ADX D(39.66)
🟢 #Nifty trading above all the major moving averages 20/50/100 in D/W time frame. Took support near the 20 DEMA 17503.
🟢 #BankNifty also trading above all the major averages 20/50/200 DEMA. #RSIStairs on verge of a fresh breakout above 60.
🟠 With quarterly results ahead, market may not be in hurry to correct anytime soon. May consolidate for first 2 weeks.
Global markets (Morning Cues @07.45 AM):
🔴 Asian markets trading lower. SGX trading trading flat indicating a muted opening in the Indian benchmark indices
🔴 US & Europe futures trading lower after strong buying in previous session. Rising commodity price remains a concern.
Intraday Index Futures Levels
🟢#Nifty Fut 17556/17618/17690/17746-17875/17905/17935/17975. RDX Score- 15M(+6*)/75M(+5*)/1D(+5*)/1W(+6*) #Bullish
🟢 #BankNifty 37185/37375/37525/37749-37913/38048/38173/38345. RDX Score- 15M(+4*)/75M(+2*)/1D(+3*)/1W(+4*) #Bullish
#MarketOutlook #TradePlan #PreOpenUpdate #IndexFutLevels #01OCT2021 (View all levels only at 15M candle closing basis)
Intraday Index Trade Plan
🟠 After 2 days of strong gains, Indian benchmark indices may consolidate or see some profit booking near supply zone.
🟠 #Nifty trading & sustaining below 17747 on 15 MCB will become weak. Profit booking can be done around 17935 levels.
🔴 We will #Hold & #TrailSL the bullish #BTST #BullishBrokenWingStraddle (-2x ATM PE, -1x ATM/OTMCE) created yesterday.
🟠 New trades to be taken basis stairs signal in 75M which automatically updates in the telegram channel through bot.

Story Of Metals From 2005 to 2021.Metals had followed a clear cyclical pattern.
2004-08 was the longest bull run where it gave returns of over 321%.
The current bull run is still a year old and had already given returns of 275 percent.
How long will this party run?
RSI is at 78 and had broken all previous ATH except the RSI of 2008 bull run which peaked at 90 before cooling off.

Natural Gas: Why You Need to Buy and Hold Gold NowNatural gas is out from the supply zone. If it doesn't come down to the supply area, a solid uptrend is waiting ahead. We may see crude oil prices at 280 - 300 - 320+ in the upcoming months.

The long-term outlook of MCX CopperLook at the above weekly chart of MCX Copper. It has created an ascending channel pattern without breakout. This channel started in the previous year's April month. At present, it's falling after making a tail. But how much it can go down? Copper may fall more from here, and that can be up to 728 - 710.6 levels.
But overall, it's on an uptrend. So, soon it will start marching for the following levels:
760 - 780 - 800 - 820 - 840+

MCX Gold: Descending Channel Pattern with Breakout at UpsideMCX gold will keep moving further advance up to the targets of 50000 - 51000 levels. But after the first target, gold will try to take a reversal for 0.382 to 0.236 levels of retracement.
Long-term Targets: 51575 - 52492+

MCX : Flag Pattern - Long TermStrong Flag pattern in Weekly charts with MACD just ready to move upside. Strong Targets awaiting.

