MCX Lead Hourly Chart, Elliott Wave, & TipsAs per the following chart, MCX lead will remain in an uptrend. It could fly up to 144 - 146 levels.
Search in ideas for "COMMODITY"

NATURAL GAS LOOKING BULLISH...! 09-06-2020NATURAL GAS IMP LEVEL IS 1.80 (CURRENT SUPPORT)
BUY ABOVE 1.83
TARGET 1.98
SL 1.75
INTRADAY TRADE FOR TOMORROW

expertcrudeoil :Kuwait investigates with India to lessen on oilOil rich Kuwait is investigating to new segments of monetary organization with India to execute Kuwait's improvement plans with less reliance on hydrocarbon.
Kuwait Ambassador to India Jassim Al-Najim, tended to national meeting as boss visitor in the esteemed Jamia Millia Islamia University in New Delhi. The tradition, themed "India, China and the Arab World Exploring New Dynamics," was sorted out by Indo Arab Cultural Center at the college, in collaboration with the Kuwait Embassy
India and the Arab world relations are not limited to exchange and financial aspects but rather additionally incorporates expressive arts, design and model as a gathering of artifacts found on Kuwaiti island of Failaka demonstrates, the Ambassador noted.
"Exchange among India and Kuwait thrived since the nineteenth century as of not long ago and Kuwait has been a vital exchanging accomplice for India with complete exchange of $ 5.6 billion of every 2016-17 and seventh biggest unrefined petroleum provider to India in a similar period," he included.

Let me help u in intraday trading commoditiesIt's brief to explain how to trade, but i just want to help u in intraday, for only who is losing in commodity.... Just wait for my updates entry-level and sl and targets

LiamTrading - XAUUSD: SCENARIO AHEAD OF FOMCLiamTrading - XAUUSD: SCENARIO AHEAD OF FOMC - The $3840 Mark Awaits a Bottom Catch Reaction Wave
Hello trading community,
The Gold market is exhibiting a strong and sustainable downtrend. We are witnessing a crash after the price broke through key support zones. With the upcoming FOMC event, our strategy is to seek Buy opportunities at deep liquidity zones and continue to Sell when the price recovers to retest the broken trend.
📰 MACRO ANALYSIS & CASH FLOW CONTEXT
Gold is currently under dual pressure:
Bearish Pressure 🔴: Optimism about the US-China trade progress has significantly weakened the demand for Gold, traditionally a safe-haven commodity. Spot Gold prices have fallen below $3950, hitting a three-week low, down about 0.78% on the day (28/10).
Short-term Support 🟢: Bets on the possibility of Fed rate cuts continue to weaken the US Dollar (USD), which is the only factor that could potentially support this precious metal.
Conclusion: This tug-of-war makes bottom identification challenging. The bearish scenario remains the top priority.
📊 TECHNICAL ANALYSIS: THE DOWNWARD WAVE CONTINUES
Based on the H4 chart (image_5fa7fa.png):
Current Trend: The price has successfully broken the key liquidity support zone near $3950 and is continuing its downward momentum.
Current Fibonacci Level: The price is touching and reacting at the 1.618 Fibonacci level (around $3950).
Next Target: The next target for Gold will be the 2.618 Fibonacci area (around $3840), which is a large liquidity zone expected to see strong reactions.
Main Strategy: We focus on two scenarios: Catching the bottom reaction at 3840 and continuing to Sell when the price rebounds.
🎯 DETAILED TRADING PLAN (ACTION PLAN)
We have two detailed scenarios based on the current price level:
🟢 BUY Reversal Scenario
We wait for the price to hit the deep liquidity bottom at 3840 to execute a buy order with the expectation of a technical recovery.
Entry Zone: 3840
Stop Loss (SL): 3832 (tight SL)
Take Profit Targets (TP): TP1: $3872 | TP2: $3898 | TP3: $3925 | TP4: $3950
🔴 SELL Retest Scenario
If Gold recovers without breaking the downtrend structure:
Entry Zone: Watch for a Sell retest at $4091
Stop Loss (SL): $4099
Take Profit Targets (TP): TP1: $4065 | TP2: $4033 | TP3: $4004 | TP4: $3965
SUMMARY & DISCIPLINE (Steven's Note)
Gold is in a strong decline ahead of the FOMC, with significant volatility expected. Capturing deep Fibonacci and Liquidity zones is key.
Note: Always adhere to the set Stop Loss. Capital management is the top priority, risking only 1-2% of the account per trade.
Wishing traders a successful and disciplined new trading week!

SILVER/SILVERM/SILVER MICRO (MCX) — BIG SELL OPPORTUNITY ???
💥 **SILVER — BIG SELL OPPORTUNITY LOADING!** 💥
⚠️ *Not a call — just my technical overview!*
Silver is showing signs of a **major trend reversal**, and the chart is screaming **“Be Careful, Bulls!”**
Here’s what I’m observing 👇
📉 **Two types of trades possible:**
1️⃣ **Aggressive Entry:**
Sell **below ₹1,49,381**
🎯 Targets — ₹1,45,300 → ₹1,36,800 → ₹1,25,000
🚫 Stop Loss — ₹1,50,700
⚠️ Silver might retest **₹1,51,500** once before dropping. That’s your caution zone!
2️⃣ **Safe Entry (for positional or conservative traders):**
Wait for a **daily candle close below ₹1,47,400** — that’s when real confirmation kicks in!
📊 **Scalper’s Plan:**
Short below **₹1,45,900**, target **₹1,45,122**
If ₹1,45,150 (major support) breaks — free fall possible till **₹1,37,000 – ₹1,26,700**
🕯️ **Technical Clue:**
A clean **Evening Star candle** has formed on the 4-hour chart — a strong bearish pattern hinting at exhaustion of the uptrend.
Remember — this is **not a financial call**, just my **technical view** based on chart structure and price action.
💭 My personal bias?
If ₹1,45,150 breaks convincingly, I won’t be surprised to see Silver heading toward **₹1,37,000** levels.
#SilverAnalysis #CommodityTrading #PriceAction #TechnicalAnalysis #SilverSellSetup #EveningStarPattern #TradersCommunity #ChartReading #SwingTrading #MarketOverview #TradeSmart #TradingInsights #LearnWithCharts

GOLD → Structural Rebalance Before Next Bullish LegGOLD → Structural Rebalance Before Next Bullish Leg
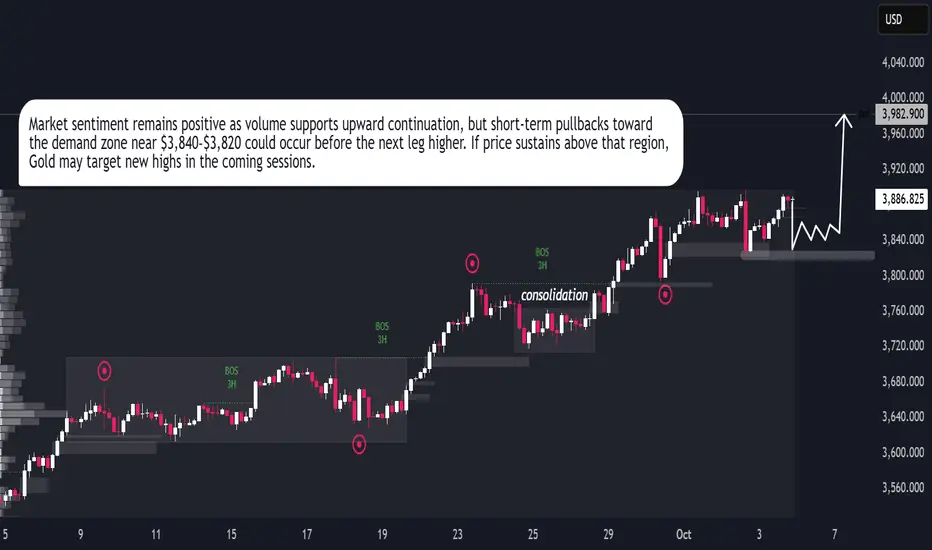
Gold remains in a strong bullish structure, showing consistent higher highs and steady momentum after each correction. The market has been consolidating above the $3,800 zone, where buyers continue to absorb liquidity and prevent deeper declines. This zone acts as a solid base for potential upward expansion. Current market behavior indicates controlled accumulation, suggesting that institutional buyers are maintaining dominance. If gold holds above $3,840–$3,820, the next bullish leg may target the $3,960–$4,000 region. A short-term retracement could occur, but overall momentum favors continuation. The price structure and volume behavior both support further upside, reflecting strong buyer control and stable sentiment in the market.
Swing Trade Journey – Trade 8: Copper FuturesTrade 8 Log
Long in #CopperFut at ₹972 on 03/10/2025
Gap-up entry executed as per alert.
Reasoning:
Price triggered the alert on a gap-up opening, confirming strength after consolidation. Trend remains intact above short-term averages with momentum favouring continuation. Setup offered a clean entry with limited downside risk.
Tracking this as part of my swing trade journey — recording setups, risks & outcomes.
#TradingJourney #CommodityTrading #SwingTrading #Copper #Futures

Gold Market Outlook – Bullish Trend Building MomentumGold continues to follow a structured bullish cycle, where each consolidation phase has been followed by a breakout and expansion. Market behavior shows liquidity being collected in sideway ranges, then released to fuel upward momentum.
At the current stage, price is trading around $3,870, showing signs of a potential short-term pullback to gather liquidity from the mid-zone. Once this corrective move stabilizes, the chart suggests a renewed bullish impulse with a projected upside target toward the $3,965 level.
This pattern highlights that the market remains in a controlled bullish phase, where temporary retracements are acting as setups for continuation rather than reversal. The underlying flow still favors higher levels as long as buyers maintain activity after corrections.

XAUUSD Forecast – Gold Price Action and Market InsightsXAUUSD Forecast – Gold Price Action and Market Insights
Gold is showing signs of stabilization after recent fluctuations, with price consolidating around the mid-range levels. The chart highlights repeated sequences of structural breaks and shifts, indicating that liquidity has been actively swept on both the buy and sell side.
The latest market move shows a controlled decline, followed by an attempt to absorb selling pressure. Current positioning suggests the possibility of a short-term liquidity grab to the downside, which could fuel a stronger recovery leg in the sessions ahead.
The projected outlook favors a scenario where buyers regain momentum, aiming to retest the upper price zones. If this momentum develops, the market may establish a renewed upward leg in alignment with the broader bullish cycle observed across higher timeframes.
From a macro perspective, gold continues to be supported by demand for safe-haven assets amid ongoing global financial uncertainty and shifting monetary policies. This backdrop enhances the probability of gold sustaining its mid-term bullish trajectory despite temporary corrective phases.

Gold Breaking Limits – Trend Speaks for ItselfGold Breaking Limits – Trend Speaks for Itself
Gold Market Outlook
Gold continues to demonstrate a well-structured bullish cycle, characterized by steady momentum and clean trend development. The market has transitioned from a prolonged consolidation phase into a sustained directional move, where each breakout is validated by controlled retracements. This reflects strong participation and confidence from larger players.
The sequence of market shifts and break-of-structure signals highlight how short-term pullbacks are consistently absorbed, turning into fuel for further expansion. Price action is orderly, with no signs of erratic volatility, showing that buyers remain in control and liquidity is being managed efficiently.
Overall, gold is moving in line with the broader macro sentiment. The rhythm of accumulation, expansion, and continuation suggests that the current cycle has not yet exhausted its potential. While interim pauses are expected, the structural integrity of the trend continues to favor upside development over the medium term.

Gold – Reversals to TrendsOur system thrives on dual strength — catching reversals at the turn and riding the trend that follows.
MCX:GOLDM1! has been the perfect example.
Precision entries on reversals, disciplined trailing on momentum.
This edge has delivered multiple double-digit “R” trades.
Risk stays small, reward compounds big.
That’s the power of rules executed with patience.

$MCX:GOLDTENU2025 – Back in the GamePrevious trade closed at a stellar 29R.
Now re-entered MCX:GOLDTENU2025 with fresh momentum.
Risk controlled, structure intact.
No predictions, just rule following.
Stops in place, trend will decide.
Let’s see how this one unfolds.
XAU/USD – Market awaits JOLTS, Gold holds safe-haven role⚓️ Captain Vincent – XAU/USD: US–Venezuela tensions push Gold as safe haven
1. Market News 🌍
US Secretary of State Marco Rubio confirmed that the US military attacked a drug ship departing from Venezuela, as Washington steps up pressure on the Maduro government.
Earlier, Trump offered a $50 million bounty to force Venezuela’s President out of power, while deploying military forces near the Caribbean coast.
👉 These moves raise fears of a potential regional conflict, making Gold the top safe-haven asset. The strong rally this morning reflects safe-haven flows returning to GOLD.
📌 Tonight’s focus (3/9 – 21:00): JOLTS Job Openings report – a key gauge of US labour market health.
If the data comes weaker than expected → USD may face more pressure → Gold could accelerate higher.
2. Technical Analysis ⚙️
On the H1 chart, Gold has formed multiple BOS (Break of Structure), showing the bullish trend remains in control.
Buy Zone 3,478 – 3,480: Aligns with a major Order Block, strong support for pullback entries.
Sell Zone 3,577 – 3,579: Near fib extension 1.618, potential resistance where profit-taking may appear.
Key Support – Resistance zones:
Support: 3,528 – 3,507
Resistance: 3,562 – 3,585
3. Trade Scenarios 📌
🔺 BUY Zone (Priority)
Entry: 3,478 – 3,480
SL: 3,470
TP: 3,483 → 3,486 → 3,489 → 349x → 35xx
🔻 SELL Zone (Resistance)
Entry: 3,577 – 3,579
SL: 3,586
TP: 3,573 → 3,570 → 3,567 → 3,560 → 35xx
4. Conclusion ⚓
Gold continues to benefit from US–Venezuela geopolitical tensions, while maintaining a bullish structure with consecutive BOS signals.
In the short term, traders may:
Look to BUY around 3,478 – 3,480 to follow the main trend.
Watch for short-term SELL at 3,577 – 3,579 if price retests strong resistance.
👉 With geopolitical risks rising and US economic data (JOLTS) due tonight, Gold remains the No.1 safe-haven asset.

FED dovish, Gold stays bullish; SELL only for scalps⚓️ Captain Vincent – Gold Plan XAU/USD
1. Market Wave 🌍
The probability of a FED rate cut in September surged to 96.6% (vs 90.4% earlier) after the JOLTS report showed weakening job prospects.
Several FED officials, from Kashkari to Bostic, shifted dovish. Only Musallim maintained a hawkish stance with a scenario of just one cut.
👉 Result: Capital flows returned to Gold as the No.1 safe haven, pushing prices strongly higher overnight.
📌 Key data today (04/09 – US time):
ADP Nonfarm (7:15)
Jobless Claims (7:30)
ISM Services PMI (9:00)
➡️ This trio of data will be crucial catalysts for GOLD volatility.
2. Technical Analysis ⚙️
On M30/H1, Gold continues to form bullish BOS, keeping the main trend upward.
Golden Harbor 🏝️ (Buy Zone 3,477 – 3,479): Old Order Block, strong support if price pulls back.
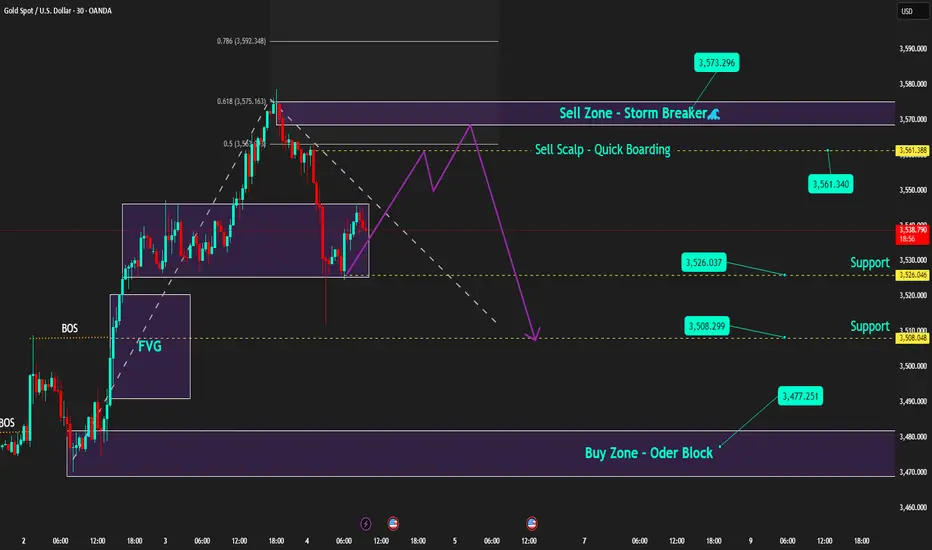
Quick Boarding 🚤 (Sell Scalp 3,561 – 3,563): Only for short-term scalps.
Storm Breaker 🌊 (Sell Zone 3,573 – 3,575): Aligned with Fibo 0.618–0.786, strong resistance with potential selling pressure.
Captain’s Shield 🛡️ (Support): 3,526 – 3,515 – 3,508
3. Captain Vincent’s Map – Trade Scenarios 🪙
🔺 Golden Harbor 🏝️ (BUY – Priority)
Entry: 3,477 – 3,479
SL: 3,470
TP: 3,480 → 3,483 → 3,486 → 3,491 → 349x → 35xx
🚤 Quick Boarding (SELL Scalp – Short Ride)
Entry: 3,561 – 3,563
SL: 3,569
TP: 3,558 → 3,555 → 3,552 → 354x
🌊 Storm Breaker (SELL Zone – Strong Resistance)
Entry: 3,573 – 3,575
SL: 3,581
TP: 3,570 → 3,565 → 3,560 → 3,555 → 35xx
4. Captain’s Note ⚓
"The golden sail is filled with wind as the FED turns dovish. Golden Harbor 🏝️ (3477) remains the safe haven to align with the bullish trend. SELLs are just Quick Boarding 🚤 scalps at Storm Breaker 🌊 , not long voyages."
Gold consolidates as new alliances emerge | Captain Vincent 1. News Wave 🌍
At the two-day summit in Shanghai, Prime Minister Modi and President Xi Jinping announced that India and China will become development partners rather than competitors.
The meeting also included Russia and four Central Asian nations, aiming to form a Southern Hemisphere bloc to counterbalance the US and the West.
👉 This signals a shift in geopolitical power, heightening concerns of global polarization → Gold continues to hold its safe-haven position.
2. Technical Analysis ⚙️
On the H2 chart, Gold has formed a Higher High after the recent strong breakout.
Storm Breaker 🌊 (Sell Zone 3511 – 3518): Strong resistance, potential for supply if price retests.
Golden Harbor 🏝️ (Buy Zone 3450 – 3448): Confluence with FVG + Fibonacci 0.5/0.618, a key support for pullback entries.
Main Trend: Gold likely to move sideways between 3450 – 3510 before choosing a major direction.
3. Captain Vincent’s Map – Trade Scenarios 🪙
🔻 Storm Breaker 🌊 (SELL Reaction)
Entry: 3511 – 3508
SL: 3518
TP: 3505 → 3500 → 3497 → 349x → 348x
🏝️ Golden Harbor (BUY Zone – Strong Support)
Entry: 3450 – 3448
SL: 3440
TP: 3453 → 3456 → 3459 → 3462 → 346x
4. Captain’s Note ⚓
"Political news continues to stir the golden sea 🌊. Bears are waiting at Storm Breaker 3511, but the safe harbor remains Golden Harbor 3450 – 3448. In such unpredictable waters, prioritise short-term sells to flow with safe-haven demand, rather than recklessly facing the storm."

GOLD 08/21 – BULLISH TREND CONFIRMEDGOLD 08/21 – BULLISH TREND CONFIRMED
Gold has confirmed its bullish momentum – today the market opens with strong upside potential.
Market Context
Gold surged yesterday and is now consolidating around the 334x zone, confirming the strength of buyers.
The Fed’s latest announcement kept rates unchanged, with the Chairman maintaining a cautious stance despite heavy political pressure from President Trump. Analysts agree that holding rates steady is necessary at this stage.
Currently, price is hovering near 3340 for liquidity collection. While some sell positions remain in the 332x–333x range waiting to exit, buying pressure is stronger, leaving many traders cautious but watching for confirmation of the trend.
Technical Overview
EMA34–89–200: All aligned bullish, confirming the uptrend.
Fibonacci & Trendline: Price holds firm above key levels, supporting continuation.
MACD: Expanding bullish momentum.
Elliott Wave: Ongoing wave structure shows room for further upside.
The bullish bias remains valid as long as price holds above the key support at 3312. Only a confirmed break below this level would negate the buy setup.
Trade Setups for 08/21
🔹 Buy Strategy (Priority):
Buy 3328–3330, SL 3324, TP 3336 → 3345 → 3355 → 3370
Buy 3316–3318, SL 3311, TP 3325 → 3336 → 3345 → 3355 → 3370
🔹 Sell Setup (Countertrend):
Sell 3369–3371, SL 3376, TP 3363 → 3355 → 3345 → 3333
Focus on scalping with the main trend to improve profit probability.
Watch price action carefully at 3312 (key support) and 3370 (resistance) for confirmation of the next move.
#Gold #XAUUSD #IndiaTrading #MarketAnalysis #ForexIndia #CommodityTrading #PriceAction

Gold Outlook After FOMC NewsGold Outlook After FOMC News
The recent FOMC meeting did not bring any new policy measures to support the economy. Chair Powell stated that conditions remain stable, and interest rates were kept unchanged. As a result, markets stayed quiet, with expectations now shifting towards September for potential updates.
On the charts, gold completed wave A after reacting strongly to the trendline on the daily timeframe. I expect the market to now form an ABC corrective structure, which would complete a medium-term Elliott cycle. The recent rally also broke above the descending trendline on H4, confirming that the bullish momentum could be more sustainable.
Currently, price is showing a mild pullback since the Asian session. A retracement of around 40–50% on the recent H4 candle would be a healthy move, and it could retest the broken descending trendline. If confirmed, this would establish a stronger bullish Dow structure, opening room for a longer cycle, at least until wave C completes.
The H4 chart also supports this view, with MACD averages pointing upward and trading volume showing steady growth.
Buy Zone: Around 3334 on the H4 candle, in line with the trend for holding medium- to long-term positions.
Sell Zone: Around 3365, once wave C completes and a new cycle begins.
Gold is now showing clearer technical direction. I hope this scenario helps traders align with the market trend. Wishing you all successful trades.
#XAUUSD #Gold #TechnicalAnalysis #PriceAction #ElliottWave #Fibonacci #MACD #CommodityTrading #FOMC

Gold Update – Asian Session Ahead of FOMCGold Update – Asian Session Ahead of FOMC
After yesterday’s sharp decline below 3312, gold found strong support and is now consolidating sideways, building liquidity for the next move. From the current outlook, a short-term rebound is likely before the broader downtrend continues.
Looking at structure, the descending channel remains intact with price respecting the trendline, and yesterday’s break out of the triangle formation reinforced the bearish bias.
From an Elliott Wave perspective, the market may now be forming wave 4. If this rebound carries price back towards the 3325–3330 zone, it will retest a strong resistance area that has repeatedly capped price before. Should that happen, wave 5 could begin — and by theory, it is often the strongest leg.
Fibonacci projections highlight the next support near 3295. If tonight’s FOMC meeting delivers a hawkish outcome in favour of the US dollar, gold could even extend lower towards 3280.
For short-term trading, buyers may consider positions near 3316 with a tight stop just below the recent low, aiming to capture the corrective move of wave 4. On the flip side, if price reacts around 3325–3330, this may provide an opportunity to sell into the expected wave 5, with potential targets extending 40–50 dollars lower if momentum strengthens.
A sustainable trend always alternates between retracements and impulses. Patience in waiting for the right wave often leads to more effective trades than rushing to pick tops or bottoms.
Do you think the FOMC this month will announce a positive interest rate outlook? Share your thoughts in the comments.
#XAUUSD #Gold #TechnicalAnalysis #PriceAction #Fibonacci #ElliottWave #MACD #ForexIndia #CommodityTrading #FOMC

Gold Plan 18/08 – Captain VincentBackground
For the past two days, Gold has repeatedly tested the 3332 – 3334 zone and slipped down to 3323, showing that buyers at this level are losing strength.
The broader trend still leans bullish, but the market is heavily influenced by geopolitics and news events:
📰 US–Russia preparing for a new round of Ukraine talks (15 Aug, Alaska).
🌐 Trump’s tariff stance remains unclear, adding volatility to Gold.
💵 Fed is likely to cut 25bps in September, keeping Gold in “defensive but ready to break out” mode.
➡ With this backdrop, today’s plan requires flexibility: Buy with trend, Sell scalp at key resistances.
1. Buy Scalp – Quick Boarding 🚤
Entry: 3324 – 3326
SL: 3320
TP: 3328 → 3332 → 3336 → 33xx
Note: Only suitable for quick scalps, avoid holding longer.
2. Main Buy Zone – Safe Harbor ⚓
Entry: 3313 – 3311
SL: 3304
TP: 3314 → 3319 → 3325 → 3330
Meaning: This is the main launchpad for buyers if price corrects deeper.
3. Sell Scalp Zone – Storm Breaker 🌊
Entry: 3366 – 3377
SL: 3383
TP: 3362 → 3355 → 33xx
Meaning: Short-term resistance, ideal for quick reaction sells.
4. Main Sell Zone – Watchtower ⛩
Entry: 3396 – 3394
SL: 3402
TP: 3390 → 3385 → 3380 → 33xx
Meaning: Strong resistance zone, highly likely to trigger a bearish reaction.
If broken, Gold may extend further into 34xx.
Today’s Scenarios
If price dips to 3324 – 3326 → Quick Buy Scalp.
If price drops deeper → Prefer to Buy at Safe Harbor (3313 – 3311).
If price rises to 3366 – 3377 → Short-term Sell Scalp.
If price tests 3396 – 3394 → Stronger Sell, this is the main resistance.
Captain’s Note:
"The Gold ship still sails North ⚓ today, but each time it hits Storm Breaker 🌊 or Watchtower ⛩, the sails will drop for a quick strike before retreating. Waves from Trump–Putin headlines and the Fed’s next move may stir up rough seas. Remember, mates: better to miss one trade than let the waves sink the ship." 🏴☠️

GOLD 08/18 – DOWNTREND BROKENGOLD 08/18 – DOWNTREND BROKEN
Market Context
This week, all eyes are on Wednesday’s FOMC meeting. Key updates around the rate-cut trajectory are likely to get clearer during the first two trading days.
In the Asian session this morning, gold dipped but quickly bounced back, even breaking the previous high with strong momentum and large volume, pushing towards the trendline. Price is showing some reaction here, but the chances of a deep correction remain low.
The next target zone could be around 3394–3396, where a major untested Volume Profile cluster sits. If price reaches this area and breaks the medium-term H4 trendline, the priority strategy will be to buy pullbacks and ride the continuation of the uptrend.
On the geopolitical side, the recent Alaska meeting ended without any agreement, signalling global tensions may continue to rise.
Trading Plan for 08/18
Bullish Setup
Buy Entry: 3345–3347
Stop Loss: 3340
Take Profit: 3355 → 3362 → 3370 → 3385
Bearish Pullback Setups
Sell Entry: 3372–3374
SL: 3378
TP: 3365 → 3360 → 3352 → 3340
Sell Entry: 3394–3396
SL: 3400
TP: 3388 → 3380 → 3372 → 3365
Note
Watch price action closely around 3394–3396. The main downtrend channel has been broken, so the bias remains towards buying with the trend.
#GoldAnalysis #XAUUSD #TradingViewIndia #FOMC #RateCuts #PriceAction #TechnicalAnalysis #CommodityTrading #IndianTraders #ForexIndia

GOLD 08/14 – TRADERS WAIT FOR PPI DATAGOLD 08/14 – TRADERS WAIT FOR PPI DATA
Market Overview
Today, the USD PPI data will be released during the US session, with forecasts pointing to a better figure than the previous month. However, in my view, the chances of a strong reading are relatively low.
Gold is currently in a sustainable corrective uptrend, with market sentiment indicating that traders have become more willing to buy at higher levels. Volume Profile shows a significant liquidity zone still present above, which is understandable since gold traded in a wide range throughout last week.
There’s also the possibility of a fake downside break below the trendline, followed by a rebound. In the Asian session today, gold bounced upon touching this trendline and continued to maintain the upward channel on H1–H4 timeframes.
Technical Outlook
The primary scenario for today is that gold may rise first, followed by a potential short-term pullback. Entries will be planned around price action and reactions at key support and resistance levels.
Trading Plan
Buy Setups
Buy Entry: 3352–3354
SL: 3348
TP: 3360 → 3378 → 3385 → 3390
Buy Entry: 3332–3334
SL: 3327
TP: 3340 → 3355 → 3360 → 3378 → 3390
Sell Setups
Sell Entry: 3378–3380
SL: 3386
TP: 3370 → 3360 → 3355 → 3342
Sell Entry: 3395–3397
SL: 3402
TP: 3390 → 3385 → 3370 → 3360 → 3355
Notes
Monitor price behaviour at key technical levels.
Prioritise higher timeframes (H1, H4) to avoid noise from short-term fluctuations.
#GoldAnalysis #XAUUSD #TradingViewIndia #CommodityTrading #ForexIndia #PPIdata #PriceAction #TechnicalAnalysis

GOLD 08/13 – SIDEWAYS TREND AWAITING A PUMPGOLD 08/13 – SIDEWAYS TREND AWAITING A PUMP
Market Overview
Following yesterday’s CPI release, investor sentiment seems to have adapted to data not aligning with forecasts. The US Dollar Index (DXY) fell sharply, yet gold maintained its position as the 3359 resistance level held firmly.
If the price manages to break this level today, a strong pump could follow, targeting around 3390.
At this stage, traders should focus on short-term profit-taking to avoid psychological pressure from the current narrow sideways range. The 3329–3331 zone reacted well yesterday; if you still hold long positions from this zone, consider keeping a small portion open.
Technical Outlook
If gold sees a sharp decline, the next key demand area lies near 3300 — the price level seen during the last NFP release, which still holds significant liquidity due to misplaced market expectations.
The nearest potential sell zone is around 3366, a former support level that now coincides with a price gap. From a market psychology standpoint, if the price breaks through the strong 3359 resistance, it will be logical for traders to take profits here, especially for those stuck in buy positions at this level.
Trading Plan for Today
Sell Setups
Sell Entry: 3365–3367
SL: 3371
TP: 3360 → 3352 → 3335 → 3310
Sell Entry: 3392–3394
SL: 3399
TP: 3385 → 3373 → 3366 → 3352
Buy Setups
Buy Entry: 3321–3323
SL: 3316
TP: 3330 → 3336 → 3350 → 3366
Buy Entry: 3298–3300
SL: 3293
TP: 3312 → 3325 → 3336 → 3350 → 3366
Trading Notes
Price is still moving sideways, awaiting a breakout to confirm the next trend. The last two weeks have shown clear caution among traders in gold, so patience and waiting for strong confirmation levels is key before increasing position size.
#GoldTrading #XAUUSD #IndiaMarkets #ForexIndia #CommodityTrading #GoldAnalysis
