GOLD 08/11 – UPTREND CHANNEL BREACHEDGOLD 08/11 – UPTREND CHANNEL BREACHED
Market Overview
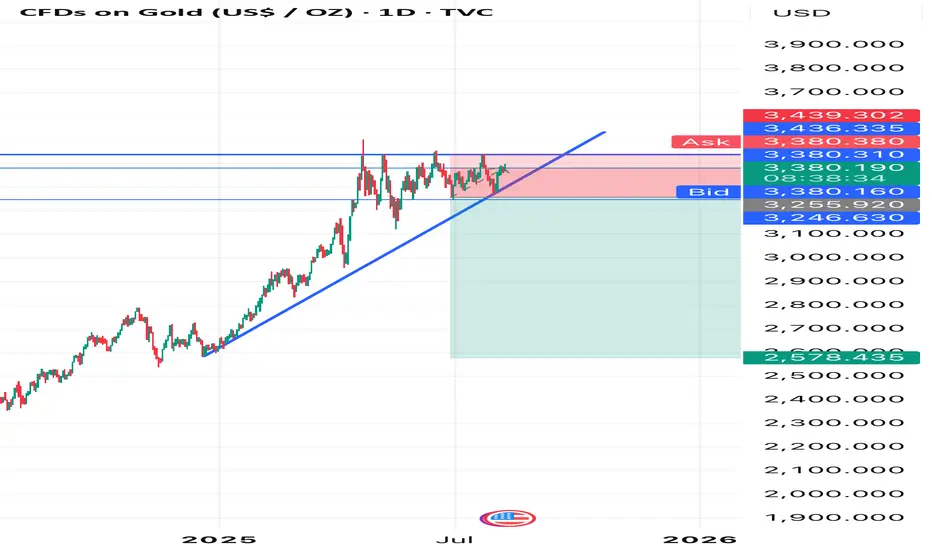
As the new week begins, gold has shown clear changes in trading volume and price structure. The short-term uptrend has been violated as price broke below the H4 trendline and touched the 3378 level.
If the H4 candle closes below this area, it would confirm a short-term bearish bias, favouring sell setups. However, the key level remains around 3350–3358 – this is the zone that would confirm a medium-term downtrend if broken.
That said, the dominant trend is still bullish for now. The next upside target lies at Fibonacci 2.618, a zone that resisted a breakout last week despite 8 H4 candle tests. Beyond that, the further target is the Fibonacci 3.618 area around 3448–3452.
Macro Factors
This week, the USD could face significant volatility from key economic data:
CPI release on Tuesday
PPI release on Thursday
Expect potential sharp moves if the results deviate from forecasts.
Trading Plan for 08/11
Buy Scenarios
Buy: 3354–3356 | SL: 3349 | TP: 3362 → 3370 → 3388 → 3400
Buy: 3343–3345 | SL: 3338 | TP: 3350 → 3362 → 3370 → 3388 → …
Sell Scenarios
Sell: 3404–3406 | SL: 3411 | TP: 3395 → 3488 → 3470 → 3462
Sell: 3432–3434 | SL: 3440 | TP: 3425 → 3415 → 3405
Note:
Bias remains bullish overall, but watch price action closely at key technical levels.
ge risk carefully ahead of major news events.
Wishing you a profitable trading session with this plan.
#GoldAnalysis #XAUUSD #ForexIndia #CommodityTrading #PriceAction #TechnicalAnalysis #IndianTraders #MCXGold #GoldForecast
Search in ideas for "COMMODITY"

Trade Type: Gold Sell (Short Position)📌 Entry: Sell Below 3380
🛑 Stop Loss: 3440
🎯 Targets:
• 3200
• 3000
• 2800
• 2600
📈 Risk-Reward: Up to 13:1
📍 Positional Setup
🚨 Trail SL after each target hit
📆 Suitable for Swing/Positional Traders
🧠 Always use proper risk management. Trade at your own discretion.
#Gold #XAUINR #GoldShort #SwingTrade #PositionalTrade #CommodityTrading #TradingSetup #RiskReward #PriceAction #ShortSetup #SellGold #MCXGold #TechnicalAnalysis
Silver Futures – Bearish Reversal in Progress
Silver Futures – Bearish Reversal in Progress
Description:
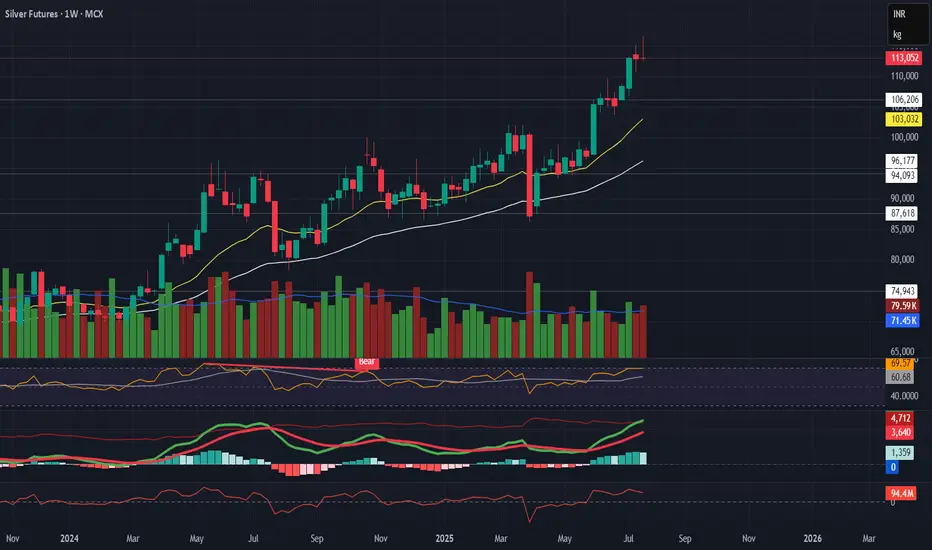
Silver is showing a strong technical reversal across timeframes. Short-term correction looks likely.
Technical Setup:
Daily:
Evening Star + Bearish Engulfing
Flattening EMAs
Volume and MACD confirming momentum slowdown
Weekly:
Gravestone + Southern Doji near resistance
RSI close to overbought
EMA slope still up, but weakening signs visible
Macro View:
No major bearish macro trigger — Fed dovish, USD stable, inflation low.
→ This is likely a technical pullback, not a fundamental reversal.
Trade Plan:
🔻 Breakdown Level: ₹114,560
🎯 Targets: ₹107K → ₹101K → ₹93K
🛑 SL: ₹116,000+
Caution: No position without breakdown confirmation.
Trade Setup – BUY WTI Crude Oil (USOIL)✅ Trade Setup – BUY WTI Crude Oil (USOIL)
📅 Date: July 2–3, 2025
🕒 Timeframe: 1H
🎯 Trade Parameters:
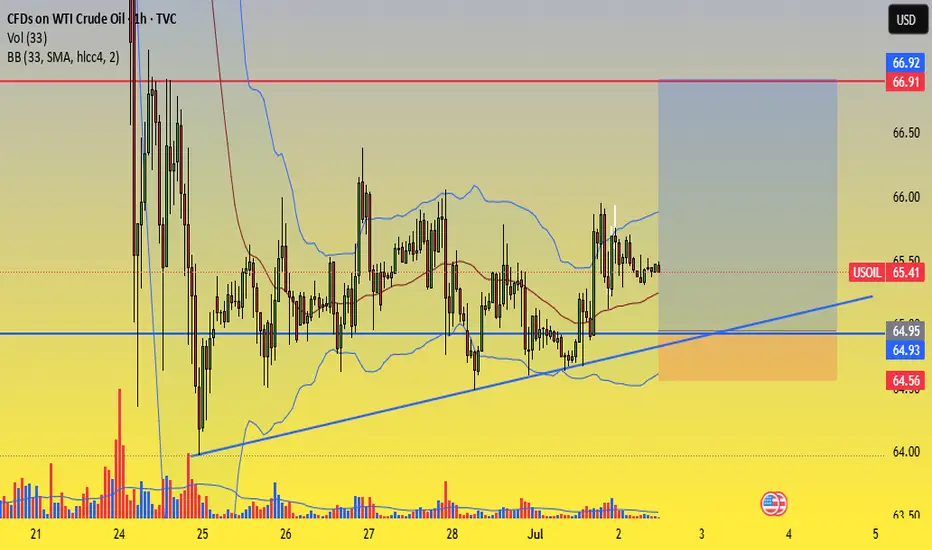
Buy Zone (Entry): 65.00 – 64.90 USD/barrel
Stop Loss (SL): 64.55 USD (below rising trendline and lower Bollinger Band)
Take Profit (TP):
• TP1: 66.50 USD
• TP2: 67.00 USD
📊 Technical Analysis Highlights:
Rising trendline from June 24 continues to hold, forming a solid support area around 64.9–65.0.
Bollinger Bands are narrowing, indicating potential volatility expansion. Price is consolidating near the mid-band (MA20), often a precursor to bullish breakout.
Volume shows signs of accumulation around the trendline, suggesting buying interest at key support.
Multiple rejections from 64.90 without breakdown reinforces this level as near-term support.
🧭 Strategy Notes:
Enter on price pullback to the 65.00–64.90 zone with confirmation (e.g. bullish pin bar, engulfing pattern, volume spike).
Suggested position management:
• Take 50% profit at 66.50
• Hold the remaining 50% toward 67.00 if momentum is strong.
If price breaks below 64.55 with strong volume, exit the trade to preserve capital.
Good luck Everybody! Fl me here and ytb ! Thanks
GoldGold ( OANDA:XAUUSD ) – Bearish Wyckoff Distribution (Unorthodox) in Play
Gold is currently trading around $3273/oz and appears to be in Phase D of a Bearish Wyckoff Distribution Schematic #1 (Unorthodox) on the 4H chart. The price is showing signs of weakness, but a final upthrust toward $3370 can’t be ruled out before a deeper breakdown.
Key level to watch:
⚠️ Breakdown confirmation below $3260–3200 could open the gates for a sharper decline.
Bearish structure still unfolding – traders should stay alert for signs of a last bull trap before distribution completes.
#Gold #XAUUSD #Wyckoff #TechnicalAnalysis #CommodityTrading #PriceAction

Gold Trading Strategy for 25th april 2025📈 GOLD INTRADAY TRADE PLAN – STRATEGY BASED ON 15-MIN CANDLE
🔸 Buy Setup
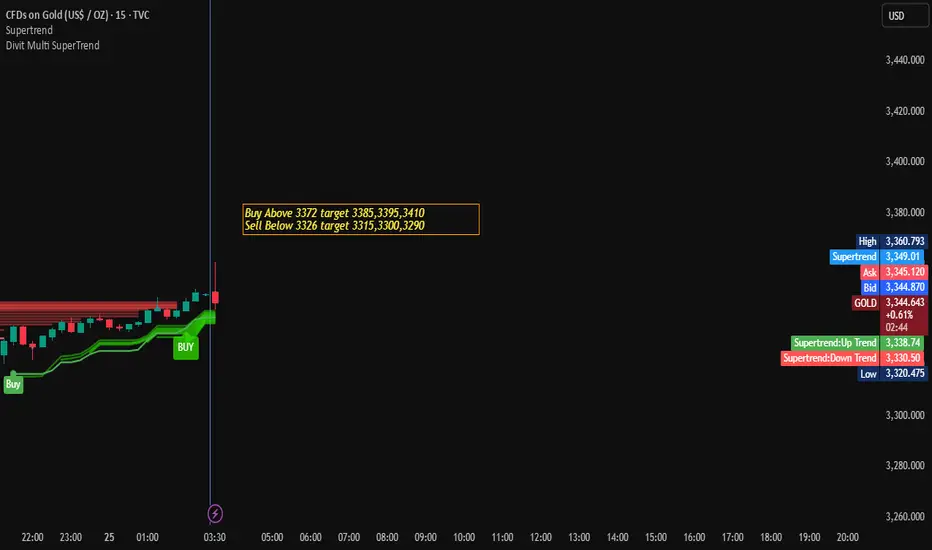
Buy Above: The high of the 15-minute candle, only if the candle closes above ₹3372
Entry Confirmation: Wait for a bullish 15-minute candle to close above ₹3372
Targets:
Target 1: ₹3385
Target 2: ₹3395
Target 3: ₹3410
Stop Loss (Suggested): Below the low of the same breakout candle or a fixed SL based on your risk appetite.
🔸 Sell Setup
Sell Below: The low of the 15-minute candle, only if the candle closes below ₹3326
Entry Confirmation: Wait for a bearish 15-minute candle to close below ₹3326
Targets:
Target 1: ₹3315
Target 2: ₹3300
Target 3: ₹3290
Stop Loss (Suggested): Above the high of the breakdown candle or a fixed SL as per your risk tolerance.
📌 Additional Notes
Use proper position sizing according to your risk management plan.
Avoid trading during high-impact economic news or volatile events.
Ensure confirmation with volume or other technical indicators if required.
⚠️ Disclaimer
This analysis is for educational and informational purposes only. It does not constitute financial advice or a recommendation to buy or sell any security or commodity. Trading in gold and other financial instruments involves significant risk and may not be suitable for all investors. Always conduct your own research or consult with a qualified financial advisor before making any trading decisions. The author is not liable for any losses incurred as a result of using this information.
CRUDE OIL MCX – INTRADAY TECHNICAL ANALYSIS (14-Apr-25 | Monday)🛢️ CRUDE OIL MCX – INTRADAY ANALYSIS (14-Apr-25 | Monday)
With 6+ years of research and proven success in trading indices and commodities, I bring you high-probability intraday levels to help you stay ahead in the market. Follow these precise setups and trade with confidence!
✅ Day Range Trigger Point: 5310 | ✅ Expected Move: 193
📈 Buy Above: 5249 | ✅ Average Buy Position: 5227
🎯 Target1: 5429 | Target2: 5503
⛔ Stoploss: 5185
📉 Sell Below: 5204 | ⛔ Stoploss: 5268
🎯 Target1: 5191 | Target2: 5117
📊 Trading Strategy & Key Insights:
🔹 Retest for confirmation: Let the price retest the level before entering.
🔹 Ideal Entry Timing:
Before 10:30 AM or after 5:00 PM: Enter as soon as the level breaks.
Between 10:30 AM and 5:00 PM: Enter as close to the stoploss as possible, as the market often revisits stoploss zones during non-peak hours.
💡 Trading is a game of patience and precision. Follow tested strategies and let the market do the rest! 📈
🔥 Like, share, or boost this post if you found it helpful! Your engagement keeps me motivated and brings a smile to my face. Drop a comment if you visited my profile—I’d love to hear from you! 😊
#CrudeOilTrading #MCX #IntradayTrading #TechnicalAnalysis #CommodityTrading #PriceAction #NumroTrader #TradingSignals #TradingTips 🚀

Natural Gas MCX Future Technical Analysis – 14-Apr-25🚀 Natural Gas MCX Future Technical Analysis – 14-Apr-25 🚀
With 6+ years of research and proven success in trading indices and commodities, I bring you high-probability intraday levels to help you stay ahead in the market. Follow these precise setups and trade with confidence!
✅ Day Range Trigger Point: 304.30 | ✅ Expected Move: 15.20
📈 Buy Above: 302.59 | ✅ Average Buy Position: 300.80
🎯 Target1: 313.69 | 🎯 Target2: 319.50
⛔ Stoploss: 297.53
📉 Sell Below: 299.01 | ⛔ Stoploss: 304.07
🎯 Target1: 294.91 | 🎯 Target2: 289.10
📊 Trading Strategy & Key Insights:
🔹 Retest for confirmation: Let the price retest the level before entering.
🔹 Ideal Entry Timing:
Before 10:30 AM or after 5:00 PM: Enter as soon as the level breaks.
Between 10:30 AM and 5:00 PM: Enter as close to the stoploss as possible, as the market often revisits stoploss zones during non-peak hours.
💡 Trading is a game of patience and precision. Follow tested strategies and let the market do the rest! 📈
🔥 Like, share, or boost this post if you found it helpful! Your engagement keeps me motivated and brings a smile to my face. Drop a comment if you visited my profile—I’d love to hear from you! 😊
#NaturalGasTrading #MCX #IntradayTrading #TechnicalAnalysis #CommodityTrading #PriceAction #NumroTrader #TradingSignals #TradingTips 🚀

Gold MCX Future Technical Analysis - 14-Apr-25🚀 Gold MCX Future Technical Analysis - 14-Apr-25 🚀
With 6+ years of research and proven success in trading indices and commodities, I bring you high-probability intraday levels to help you stay ahead in the market. Follow these precise setups and trade with confidence!
✅ Day Range Trigger Point: 93887 | ✅ Expected Move: 1477
📈 Buy Above: 93376 | ✅ Average Buy Position: 93202
🎯 Target1: 94800 | 🎯 Target2: 95364
⛔ Stoploss: 92883
📉 Sell Below: 93027 |⛔ Stoploss: 93520
🎯 Target1: 92974 | 🎯 Target2: 92410
📊 Trading Strategy & Key Insights:
🔹 Retest for confirmation: Let the price retest the level before entering.
🔹 Ideal Entry Timing:
Before 10:30 AM or after 5:00 PM: Enter as soon as the level breaks.
Between 10:30 AM and 5:00 PM: Enter as close to the stoploss as possible, as the market often revisits stoploss zones during non-peak hours.
💡 Trading is a game of patience and precision. Follow tested strategies and let the market do the rest! 📈
🔥 Like, share, or boost this post if you found it helpful! Your engagement keeps me motivated and brings a smile to my face. Drop a comment if you visited my profile—I’d love to hear from you! 😊
#GoldTrading #MCX #IntradayTrading #TechnicalAnalysis #CommodityTrading #PriceAction #NumroTrader #TradingSignals #TradingTips 🚀

Silver MCX Future Technical Analysis - 14-Apr-25🚀 Silver MCX Future Technical Analysis - 14-Apr-25 🚀
With 6+ years of research and proven success in trading indices and commodities, I bring you high-probability intraday levels to help you stay ahead in the market. Follow these precise setups and trade with confidence!
✅ Day Range Trigger Point: 94300 | ✅ Expected Move: 2894
📈 Buy Above: 93788 | ✅ Average Buy Position: 93447
🎯 Target1: 96088 | 🎯 Target2: 97194
⛔ Stoploss: 92824
📉 Sell Below: 93106 | ⛔ Stoploss: 94070
🎯 Target1: 92512 | 🎯 Target2: 91406
📊 Trading Strategy & Key Insights:
🔹 Retest for confirmation: Let the price retest the level before entering.
🔹 Ideal Entry Timing:
Before 10:30 AM or after 5:00 PM: Enter as soon as the level breaks.
Between 10:30 AM and 5:00 PM: Enter as close to the stoploss as possible, as the market often revisits stoploss zones during non-peak hours.
💡 Trading is a game of patience and precision. Follow tested strategies and let the market do the rest! 📈
🔥 Like, share, or boost this post if you found it helpful! Your engagement keeps me motivated and brings a smile to my face. Drop a comment if you visited my profile—I’d love to hear from you! 😊
#SilverTrading #MCX #IntradayTrading #TechnicalAnalysis #CommodityTrading #PriceAction #NumroTrader #TradingSignals #TradingTips 🚀

Zinc MCX Future Technical Analysis - 14-Apr-25🚀 Zinc MCX Future Technical Analysis - 14-Apr-25 🚀
With 6+ years of research and proven success in trading indices and commodities, I bring you high-probability intraday levels to help you stay ahead in the market. Follow these precise setups and trade with confidence!
✅ Day Range Trigger Point: 254.55 | ✅ Expected Move: 3.75
📈 Buy Above: 254.92 | ✅ Average Buy Position: 254.48
🎯 Target1: 256.87 | 🎯 Target2: 258.30 ⛔ Stoploss: 253.67
📉 Sell Below: 254.03 | ⛔ Stoploss: 255.28
🎯 Target1: 252.23 | 🎯 Target2: 250.80
📊 Trading Strategy & Key Insights:
🔹 Retest for confirmation: Let the price retest the level before entering.
🔹 Ideal Entry Timing:
Before 10:30 AM or after 5:00 PM: Enter as soon as the level breaks.
Between 10:30 AM and 5:00 PM: Enter as close to the stoploss as possible, as the market often revisits stoploss zones during non-peak hours.
💡 Trading is a game of patience and precision. Follow tested strategies and let the market do the rest! 📈
🔥 Like, share, or boost this post if you found it helpful! Your engagement keeps me motivated and brings a smile to my face. Drop a comment if you visited my profile—I’d love to hear from you! 😊
#ZincTrading #MCX #IntradayTrading #TechnicalAnalysis #CommodityTrading #PriceAction #NumroTrader #TradingSignals #TradingTips 🚀

Copper MCX Future Technical Analysis - 14-Apr-25🚀 Copper MCX Future Technical Analysis - 14-Apr-25 🚀
With 6+ years of research and proven success in trading indices and commodities, I bring you high-probability intraday levels to help you stay ahead in the market. Follow these precise setups and trade with confidence!
🔥 Like, share, or boost this post if you found it helpful! Your engagement keeps me motivated and brings a smile to my face. Drop a comment if you visited my profile—I’d love to hear from you! 😊
✅ Day Range Trigger Point: 839.45 | ✅ Expected Move: 18.15
📈 Buy Above: 835.42 | ✅ Average Buy Position: 833.28
🎯 Target1: 850.67 | 🎯 Target2: 857.60
⛔ Stoploss: 829.37
📉 Sell Below: 831.13 | ⛔ Stoploss: 837.18
🎯 Target1: 828.23 | 🎯 Target2: 821.30
📊 Trading Strategy & Key Insights:
🔹 Retest for confirmation: Let the price retest the level before entering.
🔹 Ideal Entry Timing:
Before 10:30 AM or after 5:00 PM: Enter as soon as the level breaks.
Between 10:30 AM and 5:00 PM: Enter as close to the stoploss as possible, as the market often revisits stoploss zones during non-peak hours.
💡 Trading is a game of patience and precision. Follow tested strategies and let the market do the rest! 📈
#CopperTrading #MCX #IntradayTrading #TechnicalAnalysis #CommodityTrading #PriceAction #NumroTrader #TradingSignals #TradingTips 🚀

Gold MCX Intraday Technical Outlook for 9-Apr-25!Here’s your structured Gold MCX Intraday Technical Outlook for 9-Apr-25 (Wednesday):
With 6+ years of sharp experience in commodities trading, I provide high-accuracy intraday setups to help you make informed, confident trades. 🔥
🔥 Boost, Follow, Like, Share if this helped you trade smarter! Drop a comment—I’d love to hear from you. 😊
✅ Day Range Trigger Point: 87648 | ✅ Expected Move: 1091 Points
📈 Buy Above: 88027 | 🎯 Target1: 88322 | 🎯 Target2: 88739
✅ Average Buy Position: 87899 | ⛔ Stoploss: 87664
📉 Sell Below: 87770 | 🎯 Target1: 86974 | 🎯 Target2: 86557
⛔ Stoploss: 88133
📊 Entry Timing Insights:
Before 10:30 AM or after 6:30 PM: Enter as soon as the level breaks.
After 10:30 AM or before 5:00 PM: Try to enter near the stoploss—markets often test these zones.
💡 Pro Tip: Let price retest your level for confirmation. Stick to risk management and follow your plan.
#Gold #MCX #CommodityTrading #IntradayTrading #TechnicalAnalysis #PriceAction #MarketAnalysis #DayTrading #NumroTrader #TradingSignals #TradingTips

Natural Gas MCX Intraday Outlook – 9th April, 2025!Here’s your ⚡ Natural Gas MCX Intraday Outlook – 9th April, 2025!
With 6+ years of sharp experience in commodities trading, I provide high-accuracy intraday setups to help you make informed, confident trades. 🔥
❤️ Like, Share, and Drop a comment if this helped you—I’d love to hear from you!
✅ Day Range Trigger Point: 303.70 | ✅ Expected Move: 25.20 Points
📈 Buy Above: 316.97 | 🎯 Target1: 319.27 | 🎯 Target2: 328.90
✅ Average Buy Position: 314.00 | ⛔ Stoploss: 308.57
📉 Sell Below: 311.03 | 🎯 Target1: 288.13 | 🎯 Target2: 278.50
⛔ Stoploss: 319.43
📊 Intraday Strategy & Timing Tips
🔹 Before 10:30 AM or after 6:30 PM: Enter as soon as the level breaks.
🔹 Between 10:30 AM and 5:00 PM: Try to enter near the stoploss zone for optimal risk-reward.
💡 Stay disciplined, manage your risk, and let the market reward your patience.
❤️ Like, Share, and Drop a comment if this helped you—I’d love to hear from you!
#NaturalGasTrading #MCX #CommodityTrading #IntradayTrading #PriceAction #TechnicalAnalysis #NumroTrader #TradingTips #TradingSignals #CrudeOilTrading #MarketAnalysis 🚀

Crude Oil MCX Futures – Intraday Technical Levels for 7th Apr.🚀 Crude Oil MCX Futures – Intraday Technical Levels for 7th Apr., 2025 (Monday)!
Backed by 6+ years of experience in trading commodities and indices, here’s your precision-driven intraday setup for Crude Oil Futures. Stick to the plan, manage your risk, and trade with clarity. 🔍
✅ Day Range Trigger Point: 5311 | ✅ Expected Move: 462 Points
📈 Buy Above: 5505 | 🎯 Target1: 5597 | 🎯 Target2: 5773
✅ Average Buy Position: 5450 | ⛔ Stoploss: 5351
📉 Sell Below: 5395 | 🎯 Target1: 5025 | 🎯 Target2: 4849
⛔ Stoploss: 5549
📊 Pro Entry Tips:
Retest is Key: Let the price retest breakout/breakdown zones for better confirmation.
Entry Strategy by Time:
Before 10:30 AM or after 5:00 PM? Enter as soon as the level breaks.
Between 10:30 AM and 5:00 PM? Try entering near stoploss—markets often test these zones.
💡 Success = Strategy + Patience. Trust the process.
🔥 If you find this helpful, boost, like, or share! Your support fuels my daily market insights.
💬 Been here? Drop a comment—I’d love to know how it helped you! 😊
#CrudeOilTrading #MCX #CommodityTrading #IntradayTrading #TradingTips #TradingSignals #TechnicalAnalysis #PriceAction #DayTrading #MarketAnalysis #NumroTrader 🚀

Gold MCX Intraday Technical Analysis – 4th Apr., 2025!🚀 Gold MCX Intraday Outlook – 4th Apr., 2025!
With 6+ years of expertise in commodities and indices, I bring you precise intraday levels to help you trade smartly and profitably.
✅ Day Range Trigger Point: 90057 | ✅ Expected Move: 2696 Points
📈 Buy Above: 90393 | 🎯 Target1: 91723 | 🎯 Target2: 92753
✅ Average Buy Position: 90075 | ⛔ Stoploss: 89494
📉 Sell Below: 89757 | 🎯 Target1: 88391 | 🎯 Target2: 87361
⛔ Stoploss: 90656
📊 Pro Trader’s Insights:
Before 10:30 AM or after 6:30 PM? Enter as soon as the level breaks.
After 10:30 AM or before 5:00 PM? Try to enter near the stoploss—markets often test these zones.
💡 Precision and patience are key in trading. Stick to the plan, manage risk, and let the market do the rest! 📈
🔥 Boost, Follow, Like, Share this post if you found it helpful! Your engagement keeps me motivated. Drop a comment if you visited—I’d love to hear from you! 😊
#Gold #MCX #CommodityTrading #IntradayTrading #TechnicalAnalysis #NumroTrader 🚀

Natural Gas MCX Intraday Technical Analysis – 4th Apr., 2025!🚀 Natural Gas MCX Intraday Outlook – 4th Apr., 2025!
With 6+ years of expertise in trading commodities and indices, I deliver precise intraday levels to help you trade smartly and profitably.
✅ Day Range Trigger Point: 353.80 | ✅ Expected Move: 18.70 Points
📈 Buy Above: 352.06 | 🎯 Target 1: 365.36 | Target 2: 372.50
✅ Average Buy Position: 349.85 | ⛔ Stoploss: 345.82
📉 Sell Below: 347.64 | 🎯 Target 1: 342.24 | Target 2: 335.10 |
⛔ Stoploss: 353.88
📊 Pro Trader’s Insights:
🔹 Retest for Confirmation: Let price revisit key levels before entering for better accuracy.
🔹 Optimal Entry Timing:
Before 10:30 AM or after 6:30 PM? Enter as soon as the level breaks.
After 10:30 AM or before 5:00 PM? Try to enter near the stoploss—markets often test these zones.
💡 Success in trading comes from patience, precision, and execution. Stick to the plan, and let the market do the work! 📈
🔥 Like, share, or boost this post if you found it helpful! Your engagement keeps me motivated. Drop a comment if you visited—I’d love to hear from you! 😊
#NaturalGas #MCX #CommodityTrading #IntradayTrading #TechnicalAnalysis #NumroTrader 🚀

break and retest entry BUY 3027 , Gold growthXAU / USD trend forecast March 27, 2025
⚠️Traders now turn their attention to Thursday’s US economic calendar, which includes the final Q4 GDP report, Weekly Initial Jobless Claims, and Pending Home Sales data. Additionally, speeches from key FOMC members are expected to influence USD demand and create short-term trading opportunities for the commodity.
However, the primary focus remains on Friday’s release of the US Personal Consumption Expenditure (PCE) Price Index, which could offer insights into the Federal Reserve’s future interest rate-cut trajectory. This, in turn, will be a crucial factor in shaping the next directional move for both the US Dollar and the non-yielding yellow metal.
⚠️ The sideway price zone 3031 is broken, gold price will continue to recover and grow. Heading towards the highest price zone in history.
🚨/// BUY XAU : zone 3029-3026
SL: 3021
TP: 50 - 150 - 300pips (3056)
Safe and profitable trading

SILVERHello & welcome to this analysis
Since May 2024, Silver (Comex) has surpassed $32.5 only once and failed on 4 attempts (including Fri - 14th Feb). Silver (MCX) has surpassed 96500 only once and failed on 3 attempts (one less due to $:INR impact).
Is this setup a complex H&S in the making (multiple shoulders)? I have my doubts on that because the weekly and monthly patterns are of a cup and handle formation with the latter in the process of currently shuffling out weak hands.
A daily close above 32.50 / 96500 would lead to a strong rally. Strong support now at $31 / 93500
Medium to long term view bullish, short term volatile - waiting for breakout
Regards

Big Move Ahead? Copper Futures Breakout Trade Setup!Hello everyone i hope you all will be doing good in your life and your trading as well. Today i have brought a Copper Futures (MCX, 1D) trading idea, earlier it has broken out of a Symmetrical Triangle Pattern , and given signal of a strong bullish move . after the breakout copper has given good move and finally trading above the all near term resitance zone like NECKLINE , Buyers are stepping in aggressively. If the price holds above the 895-880 zone, we could see a rally towards 913, 937, and even 986 in the coming sessions. But remember, risk management is key! A strict stop loss at 858 will help protect against any unexpected reversals. The structure looks solid, momentum is building up—now let’s see if the bulls take charge!
Disclaimer: This analysis is for educational purposes only. Please consult a financial advisor before making investment decisions.
If you Found this helpful? Don’t forget to like, share, and drop your thoughts in the comments below.

Silver is ready FlySilver formed w pattren it seems bullish can show new life time high in commin days

XAU/USD - Gold about to give 20 dollars move?Key Observations:
1. Trendline Breakout:
- The price has broken above a descending trendline, signaling a potential bullish reversal.
2. Demand Zone:
- A strong supply/resistance zone is evident around $2,639–$2,644, which has acted as a base for the breakout.
3. Bullish Trade Setup:
- A long position can be taken, if the price breaks out of resistance zone and retests, targeting the following levels:
- Target 1: $2,649.53
- Target 2: $2,657.36
- Target 3: $2,664.13
- Target 4: $2,668.70
- Stop-Loss: Below $2,639.65.
4. Alternate Bearish Scenario:
- If the price re-enters below the demand zone and fails to sustain the breakout, bearish momentum could push the price toward lower levels near $2,627.50.
---
Trading Scenarios:
1. Bullish Continuation:
- If the price holds above $2,646, there is a strong likelihood of testing higher resistance levels up to **$2,668.70**.
2. Bearish Rejection:
- A move below $2,636.5 could invalidate the bullish scenario, indicating a potential retest of lower supports.
---
Always use proper risk management when executing trades.
Disclaimer:
This analysis is for informational purposes only and does not constitute financial advice. Trading involves substantial risk, and past performance is not indicative of future results. Always conduct your own research and consult a financial advisor before making investment decisions. Trade responsibly.

SILVER FUTURES - INTRADAY In silver futures, 88,800 has been acting as a support level since December 23. Currently, the price is near this support line and hovering around the Weekly CPR (blue dotted lines). Silver can be considered for intraday trading now, with a stop-loss below the blue line or 88,600.
