NCC Bullish view- Short & Mid term viewPls refer chart.. View given based on indicators.. Daily and weekly indicators are in bullish mode..
Vijayaraghavan.K,
Chennai.
Search in ideas for "COMMODITY"

Karnataka Bank-Short to Mid term view- BearishRefer Chart .. Round top formation breakout done. Indicators also showing weak signals on day and weekly chart. Target and stoploss given as per pattern.
Vijayaraghavan.K,
Chennai.

NMDC - Bullish view -Short term to Mid term ivewRefer chart.. V formation done and indicators showing positive signals.. So it may increase on upcoming days..

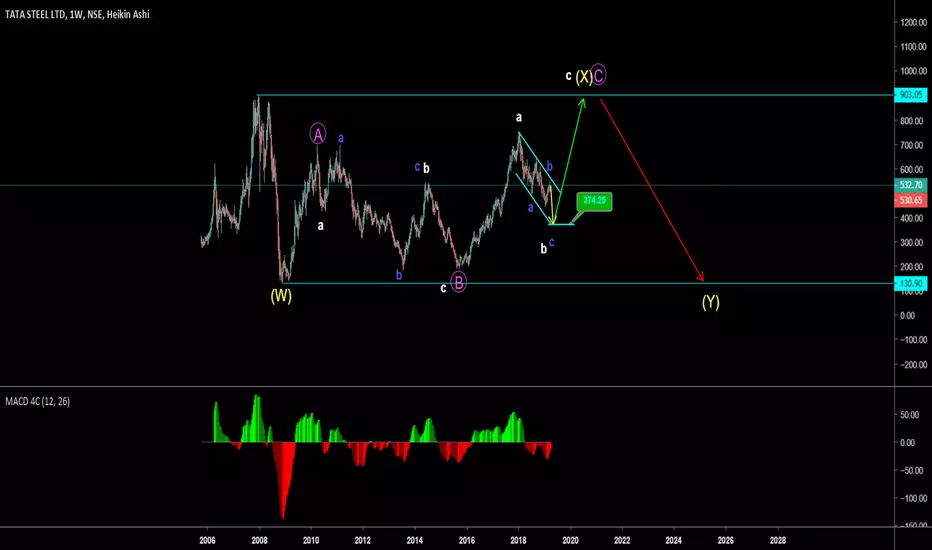
End of B wave -Trade stands to Neutral I am looking this is almost end of B (b) wave with in small correction , and price can start its down ward move which can be refer as Wave (c) with in small Bull Flag
its Too early to call for Bullish flag brake out , I am not looking that possibility at this instance ,
The entire trend is in Complex Structure from its start a refereed Start of X wave
Commodity scrips move mostly in side ways as they are influenced by Commodity price driven in the Market they usually develop very slow
i have made small efforts in putting the internal sub wave by using white and blue color ,
if any one has doubt can write a comment
thanks
Possible End of impulse wave 2 & Start of New Impulse 3This one is preparing for end of the current wave 2 and turn for impulse wave 3 which possibly could move higher than ATH
Few things you can expect in current structure
01) It can further come down below the recent low and tag 30/28 and reverse which might be a one single day move (in my view)
02) or it can turn now only and start moving up which is possible but so far it has not given any indication of start of impulse
03) Scrip related to commodity like metal and Food grain have some specific character they need not make new ATH but can tag the ATH and reverse , they will move pretty much in side way formation due to commodity driven scrip
Which one of the above will happen i dont know , but i am not looking for any bottom fishing , i will wait for an start of impulse which might be more than 4 % move in a day and then enter on pull back or brake of the high
Lets see how it move

RECL short term view- BullishIndicators looks like bullish at present. Risky traders can buy with stoploss otherwise wait and buy above the mentioned line
(Note: Closing basis given on daily basis only/Low margin and low risk traders better to avoid it.. )
Vijayaraghavan.K,
Chennai.


Voltas short and mid term view- BullishRefer chart for entry. Indicators are showing some bullish signals. MACD crossover may happen on upcoming weeks. Target given based on these and also expecting breakout, .
Vijayaraghavan.K,
Kovilpatti.

Godrej Industries- Short term view- BearishIndicators are looking weak and in monthly chart double top formed.. refer chart for other details.
Vijayaraghavan.k,
Chennai.

Nifty mid term view-BearishDay,week,Monthly charts are forming like a head and shoulder pattern. Indicators also looking weak at current levels. Targets are given for short to mid term.
K.Vijayaraghavan,
Kovilpatti.

Tata Chemicals- Short term view-BullishNSE:TATACHEM
CMP:720
1. Ascending triangle breakout done.
2. Indicators are showing bullish signals.
3.Daily,Weekly MACD crossover may happen on upcoming days&weeks.
These factors may help to reach our target levels.
Vijayaraghavan.K,
Kovilpatti

GSFC Short term view- Bullish1.Indicators are showing bullish signals.
2.Double bottom pattern formed and breakout done.
3.Weekly MACD crossover may happen on upcoming weeks(If weekly closing above 116,it may go further upside)
Vijayaraghavan.K,
Kovilpatti.

Manappuram Finanance-short term view-BullishNSE:MANAPPURAM
1. Daily,weekly indicators are slowly turning to bullish from bearish
2. Symmetrical triangle breakout done.
Vijayaraghavan.K,
Kovilpatti.

ZEE ENT- Short term view-Bullish1.Ascending triangle breakout done
2.Pattern like a round bottom formed and breakout done.
3.Closing above 514,it may go further upto 523-528 range.
4.All Daily indicators showing bullish signal and Weekly indicators are turning to bullish from bearish.
Vijayaraghavan.K,
Kovilpatti.

Karnataka bank Short term view-Bullish1.Daily MACD crossover may happen on upcoming days
2. Symm.triangle breakout done.
3.Weely indicators are slowly turning to bearish to bullish.

Bajaj Auto Short term view-BullishBreakout happen already. MACD Crossover may happen on coming days. These will help to achieve target Pls refer chart..
Vijayaraghavan.K,
Kovilpatti.

Ajantha pharma short&mid term view- BullishDaily and weekly indicators(MACD,ADX,CCI,RSI,PSAR) are showing positive signals. Daily ADX moving positive,Daily&weekly CCI positive crossover,weekly MACD cut may happen on upcoming weeks.These factors will help to achieve the target levels. Please refer chart for other details.
Vijayaraghavan.K,
Kovilpatti.

Bank Nifty- Short term View- BullishWeekly Indicators are turning from bearish and showing bullish signals. So pls refer chart .. This is not a intraday/expiry call
Vijayaraghavan.K,
Kovilpatti.

NMDC- Short term view- BearishHead and shoulder breakdown and daily,weekly indicators are showing bearish signals so these will help to reach the target. Refer chart for other details.
Vijayaraghavan.K,
Kovilpatti.

BHEL Short term view-BearishSell near to stoploss range if possible. Pls refer chart. Indicators are still weak and expecting come down again.
Vijayaraghavan.K,
Kovilpatti

Brent: Price going down down and down-repeat as neededBreak down the 2y7m ascending channel- focus shifts further down to 200MA
www.keytomarkets.com

Focus on GoldThe yellow metal failed to cling on to its gain after breaking out above 200MA (Weekly) earlier and currently trading below the 20MA daily. Given the daily indicators are remaining bearish, cautious remains in order with an eye on the support at 1216.00$ it’s 100MA and 1210.00$ its 50MA. A break below of these last support level would drag the price further to 1205.00$ it’s C corrective pattern on the H4 chart (1212.00$-1237.40$) and 50.0% of the fib reaction (1160.00$-1243.40$).
www.keytomarkets.com
Forecast: We expect the current correction could pause between 1216.00$-1210.00$. In this case, a sharp short-term rally would trigger to 1220.00$, 1227.00$ ahead of the critical resistance 1236.00$.
