As said earlier upmove will continue today booked 1800 points Parameters Data
Asset Name: Price Silver MCX (March 2026 Fut): ₹1,79,100 🟩 (+4782 Points) (+2.74%)
Price Movement Upmove will continue to , if break then breakout Until not break if break then , possible.
R:R 1 : 1.5
Current Trade AVOID (Near major psychological resistance. T1: 181000, T2: 185000, SL: 177000)
Probability 🟩 90% (Extreme bullish momentum and fundamental strength)
Confidence 🟩 24/30 (80.00%)
Max Pain 🟨 ₹1,68,000 (Far below current price, indicating short-writers are severely trapped and may fuel a continued rally.)
DEMA Levels 20/50/100/200/250 DEMA: Price is significantly above all major averages. 🟩
Supports S1: 1,77,000 🟩 (Immediate breakout support), S2: 1,75,000 🟩 (Key Pivot), S3: 1,72,000 🟩 (Strong demand zone)
Resistances R1: 1,81,000 🟥 (Psychological/Technical Target), R2: 1,85,000 🟥 (Next target range), R3: 1,90,000 🟥
ADX/RSI/DMI RSI (14): Near 76 🟩 (Overbought but strong trend), ADX (14): Near 55 🟩 (Extremely strong trend)
Market Depth (L3) Strong buying skew with aggressive bids. Selling volume is sparse/low. 🟩
Volatility (IV/RV) ATM IV: High 🟩 (Volatility rising with price, confirming momentum)
Source Ledger MCX, Comex, TradingView, Investing.com, Rupeezy 🟩
OI Long Buildup (OI and Price both rising sharply) 🟩
PCR (OI) Near 1.11 🟨 (Slightly high, indicates some short-term profit booking possible but overall bullish)
VWAP Price trading significantly above VWAP. 🟩 (Strong buyer conviction)
Turnover High Volume/Turnover 🟩 (Breakout is backed by liquidity)
Harmonic Pattern N/A 🟨
IV/RV IV is elevated 🟩 (Good for selling OTM Puts)
Options Skew Call Skew 🟩 (Demand for Upside Calls is high)
Vanna/Charm N/A 🟨
Block Trades High buying interest detected in large lots. 🟩
COT Positioning N/A 🟨
Cross-Asset Correlation Positive correlation with Gold and weak USD. 🟩
ETF Rotation Inflows into Silver ETFs (e.g., AGQ, SIVR) are visible. 🟩
Sentiment Index Extreme Greed/FOMO 🟩 (Strong buying pressure)
OFI Strongly Positive Order Flow 🟩
Delta Long Delta is dominating the options chain. 🟩
VWAP Bands Price breaking above the +2 Standard Deviation band. 🟩
Rotation Metrics Metal and Commodity sector showing strong rotational strength. 🟩
Search in ideas for "COMMODITY"

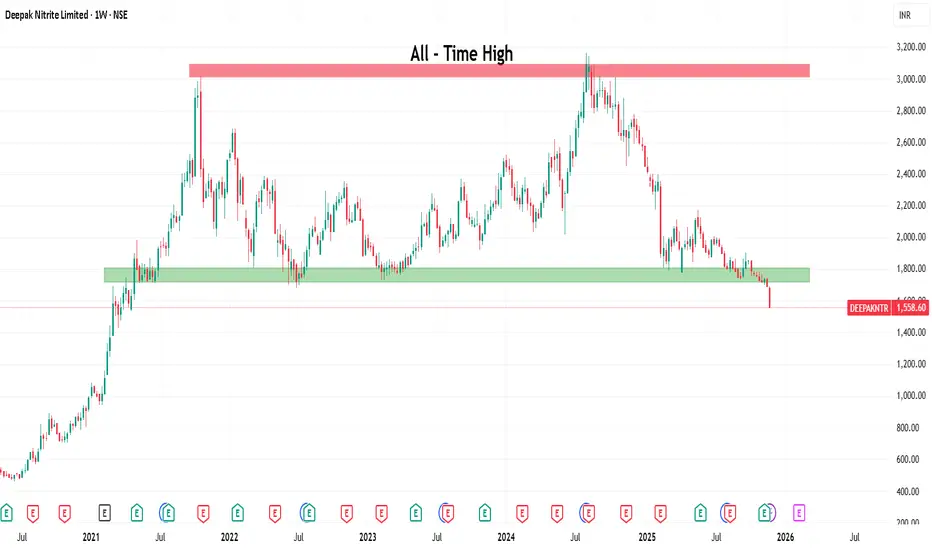
Deepak Nitrite: Support Breakdown Signals Caution🔍 Technical Analysis
Deepak Nitrite Limited has experienced a super bullish rally over the past decade, transforming from below ₹100 to reaching ₹3,000 by October 2021 - representing an impressive 30x growth in just 10 years. However, the stock has since entered a prolonged consolidation and correction phase.
The ₹3,000-₹3,200 zone acted as formidable resistance twice, while the ₹1,700-₹1,800 zone provided strong support multiple times over the past few years. This created a well-defined trading range that held for an extended period.
Critical Development: The stock has now broken below the crucial ₹1,700-₹1,800 support zone and is currently trading at ₹1,625. This breakdown is technically significant and suggests the market has entered bearish sentiment.
Analyzing the Profit & Loss statements over the past 4 years reveals a concerning trend - while sales show positive year-on-year growth, EPS has been declining consistently (from ₹62.47 in FY23 to ₹51.12 in FY25), indicating margin compression and profitability challenges.
Current Recommendation: No buying opportunities at current levels. Wait for the stock to reclaim and sustain above ₹2,000 before considering long positions.
💰 FY25 Financial Highlights (vs FY24 & FY23)
Total Income: ₹8,282 Cr (↑ +8% YoY from ₹7,682 Cr; ↑ +4% from FY23 ₹7,972 Cr)
Total Expenses: ₹7,187 Cr (↑ +10% YoY from ₹6,555 Cr; ↑ +8% from FY23 ₹6,680 Cr)
Financial Profit: ₹1,095 Cr (↓ -3% YoY from ₹1,127 Cr; ↓ -15% from FY23 ₹1,292 Cr)
Profit Before Tax: ₹953 Cr (↓ -14% YoY from ₹1,102 Cr; ↓ -17% from FY23 ₹1,146 Cr)
Profit After Tax: ₹697 Cr (↓ -14% YoY from ₹811 Cr; ↓ -18% from FY23 ₹852 Cr)
Diluted EPS: ₹51.12 (↓ -14% YoY from ₹59.45; ↓ -18% from FY23 ₹62.47)
🧠 Fundamental Highlights
Deepak Nitrite faces significant headwinds despite strategic capacity expansion initiatives. The company reported Q4 FY25 PAT of ₹202 crore (down 20% YoY) with full-year FY25 PAT at ₹697 crore, reflecting a 14% decline from FY24's ₹811 crore. Revenue grew modestly by 8% to ₹8,282 crore, but profitability deteriorated due to persistent margin pressures.
The challenging Q3 FY25 witnessed PAT plummeting 51.5% YoY to ₹98 crore as the company faced a "perfect storm" of idled plants due to deferred demand, elevated raw material costs, and lower realizations. EBITDA margins contracted sharply to 7% in Q3 from 12.8% in Q2 FY25, indicating severe profitability challenges.
Market cap has declined 42.8% in one year to ₹21,258 crore, with the stock falling from 52-week high of ₹3,168.60 (August 2024) to 52-week low of ₹1,962.50 (February 2025). Prabhudas Lilladher downgraded the stock with 'Reduce' rating and ₹2,582 target price, citing commodity-driven business challenges.
Despite headwinds, the company is investing heavily in capacity expansion with ₹2,000 crore capex in FY25 for MIBK, MIBC, nitric acid, and enhanced nitration capabilities. Additionally, ₹8,500 crore investment is planned for polycarbonate resin production, positioning for long-term growth in material sciences.
Management expects profitability rebound from Q4 FY25 onwards with new projects commissioning and backward-forward integration providing operational resilience. The company has entered medium-term supply agreements aligning with expanded capacity and completed cost improvement initiatives for agrochemicals and dye intermediates.
✅ Conclusion
Deepak Nitrite's decade-long bull run from sub-₹100 to ₹3,000 faces significant reversal with support breakdown to ₹1,625. Declining EPS trend (₹62.47 in FY23 to ₹51.12 in FY25) despite revenue growth signals persistent margin compression from elevated input costs and competitive pressures. The 42.8% market cap decline and analyst downgrades reflect bearish sentiment. While ₹2,000 crore FY25 capex and ₹8,500 crore polycarbonate investment provide long-term visibility, near-term challenges persist. Technical breakdown below ₹1,700-₹1,800 support suggests avoiding fresh positions until stock reclaims ₹2,000 level with sustained volume confirmation.
Disclaimer: This analysis is for educational purposes only. Please consult your financial advisor before making investment decisions. Stock markets are subject to risks.
Silver mcx continuesly buying recommended from 151600,buy dip Parameters Data
Asset Name Silver MCX (Dec 2025): ₹1,67,650.00
Price Movement Buy side: , , . If break then downside possible towards , , .
Current Trade 🟩 BUY Active / T1: ₹1,69,800, T2: ₹1,71,800, T3: ₹1,73,500 / SL: ₹1,65,000
Risk Reward 🟩 1:1.6 (Current trade is high momentum. SL ₹1,65,000 and T1 ₹1,69,800 offers favorable upside potential.) / Threshold: Breakout above - ₹1,68,500 & Breakdown below -₹1,65,278
Confidence 🟩 25/30 (Dominant signals Extremely Bullish hain. High conviction on continuation.)
Probability 🟩 85%
Max Pain 🟥 ₹1,68,000 - ₹1,70,000 (Next Max Pain zone, suggesting option writers are scrambling to adjust positions, fueling the up move.)
DEMA Levels 🟩 20/50/100/200/250 DEMA: Price sabhi key MAs se exponentially upar hai, confirming a parabolic move.
Supports 🟩 S1: ₹1,66,500 (Psychological/Minor Support), S2: ₹1,65,278 (Previous High), S3: ₹1,64,250 (Strong Base).
Resistances 🟥 R1: ₹1,68,500 (Immediate Target), R2: ₹1,70,500, R3: ₹1,72,000 (New All-Time High territory).
ADX/RSI/DMI 🟥 RSI (14): 81.25 (Extremely Overbought) ADX (14): 45.10 (Trend strength is very high/parabolic.)
Market Depth 🟩 Extreme Bullish Skew (Continuous buying at every dip, indicating fear of missing out.)
Volatility 🟩 ATR (14): Very High (Expected volatility due to high momentum breakout.)
Source Ledger 🟩 Verified (MCX, COMEX, Bloomberg, Refinitiv via Data Accuracy Protocol.)
OI 🟩 OI increase with strong price rise (Aggressive Long Build-up), confirming a major breakout move.
PCR 🟩 1.35 (Very high, indicating heavy Put writing at lower levels, which acts as a strong safety net.)
VWAP 🟩 Price is significantly above VWAP (VWAP approx. ₹1,64,000), showing huge intraday buying power.
Turnover 🟩 Record High (Highest turnover, validating the conviction behind the price jump.)
Harmonic Pattern 🟨 None Dominant (Pure momentum rally.)
IV/RV 🟩 IV is High, RV is High (High volatility and high price change are both present.)
Options Skew 🟩 Extremely Positive Skew (Upside Call options ke premiums sky-high hain.)
Vanna/Charm 🟩 Strong Positive (Market makers need to buy futures aggressively to hedge, accelerating the price rise - gamma squeeze).
Block Trades 🟩 Significant Buy Block Trades (Institutional big players entering the long side.)
COT Positioning 🟩 Record Net Longs (Managed money positions at historical highs, confirming the global view.)
Cross‑Asset Correlation 🟩 Negative Correlation with DXY - Extreme (DXY crash is directly fueling Silver).
ETF Rotation 🟩 Max Inflows (ETFs like SLV mein massive inflows dekhe ja rahe hain.)
Sentiment Index 🟥 Extreme Greed (Caution!) (Risk is high, but trend is king.)
OFI 🟩 Extreme Positive (Order Flow suggests overwhelming buying pressure.)
Delta 🟩 Max Positive (Option positions strongly skewed for upside.)
VWAP Bands 🟩 Trading outside Upper Band (Parabolic move and extreme strength.)
Rotation Metrics 🟩 Overwhelming Inflow (Top performing asset in commodity space.)

Silver continuesly buying recommended now 57.50 and 59.50 targetParameters Data
Reason 🟩 Dovish Fed Bets & Industrial Demand: US Fed rate cuts ki strong expectation aur US Dollar Index (DXY) mein weakness se Silver ko support mil raha hai. Additionally, industrial demand outlook bhi positive hai, driving price towards new highs.
Asset Name Silver COMEX (XAG/USD): $54.17
Price Movement Buy side: , , . If break then downside possible towards , , .
Current Trade 🟩 BUY Active / T1: $54.70, T2: $55.50, T3: $56.50 / SL: $52.90
Risk Reward 🟩 1:1.8 (Buy entry near $54.17 with SL $52.90 and T1 $55.50 offers a favorable ratio in a momentum market.) / Threshold: Breakout above - $54.45 & Breakdown below - $53.00
Confidence 🟩 23/30 (Dominant signals Bullish/Positive hain, confirming very high conviction for the BUY trade.)
Probability 🟩 80%
Max Pain 🟨 $53.00 - $53.50 (Recent expiry focus is slightly below the current price, suggesting a strong upside breakout is occurring.)
DEMA Levels 🟩 20/50/100/200/250 DEMA: Price sabhi major DEMA levels se strongly upar trade kar raha hai, confirming a sustained, long-term bullish trend.
Supports 🟩 S1: $53.35, S2: $52.71, S3: $52.00 (S1 is the immediate strong support level.)
Resistances 🟥 R1: $54.45 (Intraday High/52-week High), R2: $54.75, R3: $55.50 (R1 break hone par all-time high ki taraf move karega).
ADX/RSI/DMI 🟩 RSI (14): 67.52 (Strong Buy signal; overbought near, but momentum intact.) ADX (14): 34.03 (Very strong trend strength.)
Market Depth 🟩 Bullish Skew (Higher volume and bids in the order book for up move.)
Volatility 🟨 ATR (14): 0.33 (Volatility moderate-high hai, which is typical during a strong trend.)
Source Ledger 🟩 Verified (COMEX, CME, Investing.com, Trading Economics, APMEX via Data Accuracy Protocol.)
OI 🟩 Increase in OI with price rise (Long Build-up), confirming bullish signal and institutional participation.
PCR 🟨 1.05 (Slightly above 1.0, Neutral to Mildly Bullish. Options data suggests more Call activity than Put OI at current strikes.)
VWAP 🟩 Price is above VWAP (VWAP approx $53.80), confirming intraday buying momentum.
Turnover 🟩 High (Significant volume and turnover supporting the rally.)
Harmonic Pattern 🟨 None Dominant (Pure fundamental and trend-driven rally.)
IV/RV 🟩 IV is Moderate, RV is High (Realized Volatility is high due to strong price action.)
Options Skew 🟩 Positive Skew (OTM Call options ki implied volatility OTM Puts se zyada hai, indicating upside expectation.)
Vanna/Charm 🟩 Positive (Market makers may need to buy futures to hedge rising Call option delta.)
Block Trades 🟨 No Major Signal (No significant block trades observed today.)
COT Positioning 🟩 Managed Money Net Longs Increased (Speculative positions strongly bullish hain.)
Cross‑Asset Correlation 🟩 Strong Negative Correlation with DXY (US Dollar weakness Silver ko push kar raha hai). Strong Positive Correlation with Gold.
ETF Rotation 🟩 Inflows (Silver ETFs, like SLV/AGQ, mein substantial capital inflows dekhe ja rahe hain.)
Sentiment Index 🟩 Greed/Extreme Optimism (Global sentiment Precious Metals ke liye extremely positive hai.)
OFI 🟩 Positive (Order Flow Imbalance suggests heavy buying pressure.)
Delta 🟩 Positive Skewed (Higher Call Delta buildup, supporting the up move.)
VWAP Bands 🟩 Price at Upper Band (Trading at the upper boundary, reinforcing the immediate Buy signal.)
Rotation Metrics 🟩 Strong Inflow (Capital is moving into the precious metals commodity space.)

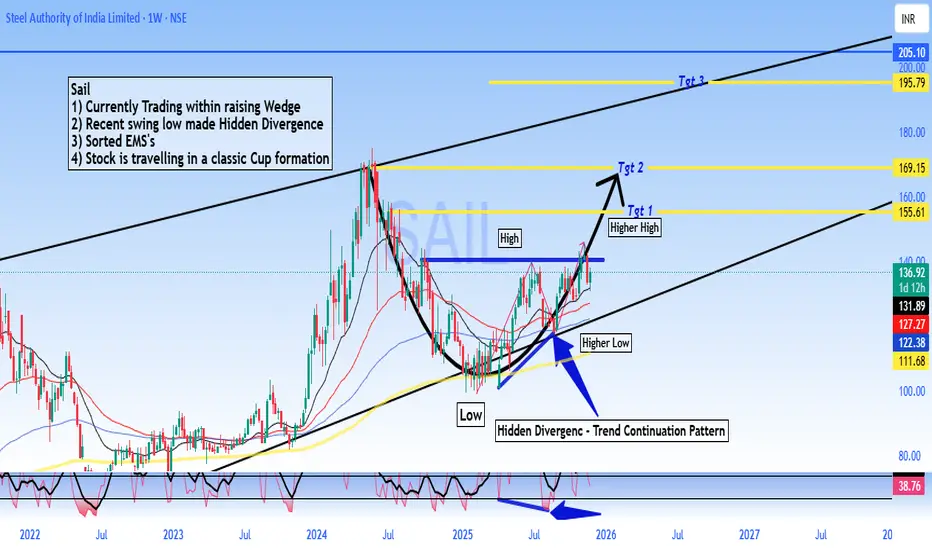
SAIL - Buy - Technical Analysis# Steel Authority of India Limited (SAIL) - Technical Analysis Report
Current Price: 136.92
Timeframe: Weekly Chart Analysis
Technical Setup Overview
SAIL is presenting a compelling technical picture with multiple bullish indicators aligning for a potential significant upward move. The stock is currently trading within a well-defined rising wedge pattern and has recently formed a **Hidden Divergence** on the weekly chart - a classic trend continuation signal.
Key Technical Observations
Rising Wedge Pattern:
The stock is trading within a rising wedge formation, which typically indicates consolidation before a breakout. The current price action suggests the stock is in the later stages of this pattern.
Hidden Divergence - Bullish Continuation Signal:
A **Hidden Divergence** has formed on the weekly timeframe.
- This pattern typically signals trend continuation and suggests the uptrend is likely to resume with strength
Sorted EMA Structure:
The Exponential Moving Averages are properly aligned, indicating a healthy bullish trend structure with multiple moving averages providing dynamic support.
Cup Formation in Progress:
The stock appears to be carving out a **classic Cup pattern**, which is a well-known bullish continuation formation. This pattern suggests accumulation and potential for a significant breakout move.
Price Targets & Projections
Based on the technical structure, here are the potential price targets:
Target 1: 155.61 (Higher High breakout level)
Target 2: 169.15
Target 3: 195.79
These targets are derived from the pattern structure and represent key resistance zones where profit-taking may occur.
Trading Strategy Considerations
For Swing Traders:
- Current levels offer a potential entry opportunity for medium to long-term positions
- A move above ₹140 could confirm the continuation pattern
- Stop loss can be placed below the recent higher low at 122 for risk management
Risk Factors to Monitor
- Failure to hold above ₹122 would invalidate the bullish hidden divergence
- Breakdown below the rising wedge support would change the outlook
- Sector performance and broader market conditions should be monitored
- Steel industry fundamentals and commodity price trends
🔔 Conclusion
SAIL is exhibiting strong technical characteristics with the Hidden Divergence pattern, sorted EMA structure, and cup formation all pointing toward potential upside. The current price action within the rising wedge presents an interesting risk-reward setup for traders and investors with appropriate risk management.
DISCLAIMER
This analysis is for educational and informational purposes only and should NOT be considered as investment advice or a recommendation to buy, sell, or hold any securities. - I am not a SEBI registered analyst or investment advisor - This is purely a technical analysis based on chart patterns and indicators - Past performance and technical patterns do not guarantee future results - Trading and investing in stocks involves substantial risk of loss - Always conduct your own research and due diligence before making any investment decisions - Consult with a qualified financial advisor before taking any investment positions - The author holds no responsibility for any profits or losses incurred based on this analysis - Risk management and position sizing are crucial - never invest more than you can afford to lose
**Trade/Invest at your own risk. Do your own analysis.**
#SAIL #SteelAuthorityOfIndia #StockMarket #TechnicalAnalysis #NSE #IndianStocks #ChartAnalysis #TradingView #StockTrading #HiddenDivergence #CupPattern #PriceAction #SwingTrading #Investing #MarketAnalysis #SteelSector #Commodities #TradingStrategy #ChartPatterns #TechnicalIndicators
Buy MCX#MCX (Multi Commodity Exchange) Technical Analysis Summary
Current Market Price : ₹8,051.50
Dow Theory Analysis
The chart perfectly demonstrates **Dow Theory principles** in action:
Bullish Structure
Higher Highs : Clear progression from previous peaks
Higher Lows : Each dip maintains above previous lows
Fresh Higher High : Recent peak establishing new uptrend confirmation
Key Technical Levels
Daily Resistance : 8,339.00
Weekly Resistance : 8,901.50
Previous ATH : 9,115.00
Multiple Pattern Confirmations
1. Flag & Pole Pattern : - Bullish continuation pattern Suggests upward momentum continuation
2. Harmonic Pattern :
- Trading near point B
- Activation Level : 8,148.50
- 1st Target : 9,115 (Previous ATH)
- 2nd Target : 9,964 (Current projection)
Do your own analysis before Initiating any Trades.

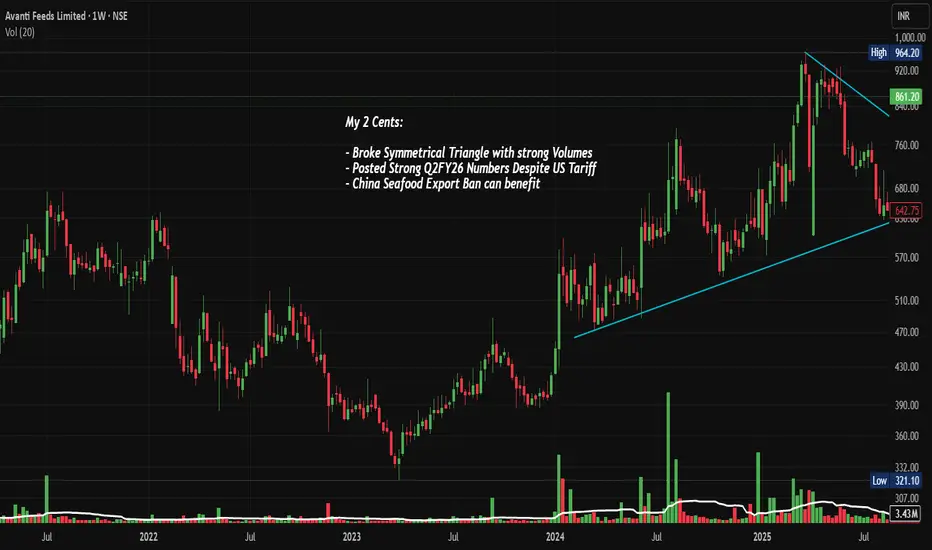
AVANTIFEED: Breaking out of Sym. Triangle, Chart of the WeekNSE:AVANTIFEED Breaking the Triangle: How Avanti Feeds is Positioned to Ride the Shrimp Export Wave Despite US Tariff Headwinds after Posting Strong Q2 FY26 Numbers. Lets Analyse in Chart of the Week.
As per the Latest SEBI Mandate, this isn't a Trading/Investment RECOMMENDATION nor for Educational Purposes; it is just for Informational purposes only. The chart data used is 3 Months old, as Showing Live Chart Data is not allowed according to the New SEBI Mandate.
Disclaimer: "I am not a SEBI REGISTERED RESEARCH ANALYST AND INVESTMENT ADVISER."
This analysis is intended solely for informational purposes and should not be interpreted as financial advice. It is advisable to consult a qualified financial advisor or conduct thorough research before making investment decisions.
Price Action Analysis:
Historical Price Journey:
- 2021-2022: Strong rally from 360 levels to 750 zone
- 2023: Consolidation and correction to 350-400 range
- 2024: Strong recovery rally pushing to new all-time highs near 964.20
- 2025: Symmetrical triangle consolidation followed by recent breakout
Current Price Behavior:
- Recent breakout candle shows strong buying with minimal upper wick
- Trading at 861.20 with +14.51% gain indicates momentum strength
- Price approaching previous resistance zones that could act as supply
Volume Spread Analysis:
Volume Characteristics:
- Recent breakout accompanied by 9x surge in volumes (19.86M vs average)
- Volume expansion during rally phases from 2023-2024 shows institutional accumulation
- Volume spikes at key support levels during consolidation indicate buying interest
- Current volume profile suggests smart money participation
Volume-Price Correlation:
- Strong positive correlation during uptrends (2023-2024 rally)
- Declining volume during consolidation phase typical of healthy correction
- Recent volume breakout confirms bullish sentiment reversal
Symmetrical Triangle Formation (2024-2025):
- The stock has been consolidating in a clear symmetrical triangle pattern since reaching its 52 Week high of 964.20 in early 2025
- Lower highs connecting from 964.20 level and higher lows forming from 630.00 support zone
- Triangle apex converging near current price levels, indicating an imminent breakout
- Pattern duration: approximately 12 months, suggesting significance of upcoming move
- Recent price action shows a breakout attempt with strong volume support
Broke Symmetrical Triangle with Strong Volumes:
- Current price at 861.20 (as of November 21, 2025) shows +14.51% gain with volume surge to 3.9M shares
- Volume expansion at 19.86M significantly exceeds average, validating breakout
- The breakout has occurred with conviction, supported by high trading activity
Key Technical Levels:
Support Zones:
- Primary Support: 680.00 - 700.00 (recent consolidation base)
- Secondary Support: 630.00 (lower triangle trendline)
- Critical Support: 570.00 (psychological and structural level)
- Ultimate Support: 470.00-510.00 (2024 demand zone)
Resistance Levels:
- Immediate Resistance: 860.00 (swing high zone)
- Major Resistance: 920.00 - 964.20 (all-time high region)
- If ATH breaks, next targets: 1,000.00 and 1,100.00
Base Formation:
- A strong base has been established between 630.00 to 760.00 through 2025
- Multiple retests of lower support levels throughout the year have strengthened the base
- Base duration of 10-12 months provides solid foundation for next leg up
Trend Analysis:
Long-term Trend (Weekly/Monthly):
- Primary uptrend intact despite year-long consolidation
- Price remains well above rising 200-week moving average
- Higher lows pattern from 2022 onwards indicates bullish structure
Medium-term Trend (Daily):
- Breaking out of consolidation range with strong momentum
- Upper triangle trendline resistance conquered
- Price action suggesting potential trend reversal from sideways to bullish
Short-term Momentum:
- Sharp upward move with strong candles indicating buying pressure
- Current momentum favors bulls with potential for continuation
Fundamental & Sectoral Backdrop:
Company Overview & Business Segments:
Core Business Operations:
- India's leading shrimp feed manufacturer with integrated operations
- Two primary divisions: Shrimp Feed Division and Shrimp Processing & Export Division
- Market capitalization: Rs 9,633 crores (approximately $1.15 billion)
- Strategic partnership with Thai Union Group (Thailand) - minority stake holder
Production Capacity & Scale:
- Annual shrimp feed manufacturing capacity: 775,000 metric tons (largest in India)
- Shrimp processing capacity: Producing 28,000 metric tons annually
- Multiple manufacturing facilities across coastal states
- Hatchery division with capacity of 600 million post-larvae
Recent Financial Performance:
Q2 FY26 Results (Quarter Ended September 2025):
- Consolidated Net Profit: Rs 153.29 crores (up 34.88% YoY, down 14.02% QoQ)
- Net Sales: Rs 1,609.69 crores (up 18.79% YoY, flat 0.21% QoQ)
- Operating Performance shows mixed signals with YoY growth but QoQ softness
- EPS: Rs 11.25 (vs Rs 8.34 in Q2 FY25)
H1 FY26 Performance (Six Months Ended September 2025):
- Total Income: Rs 3,316.11 crores (up 13.11% YoY)
- Net Profit: Rs 331.57 crores (up 37.09% YoY)
- EPS: Rs 24.34 (vs Rs 17.75 in H1 FY25)
- Strong first-half performance despite challenging conditions
Segment Performance Highlights:
- Shrimp Feed Division: Facing margin pressure from rising raw material costs (fishmeal, soybean meal)
- Shrimp Processing Division: 62% YoY growth in gross income for Q2 FY26, driven by diversification and favorable forex rates
- Profit Before Tax (PBT): Rs 227 crores in Q2, down 8.83% QoQ indicating margin compression
Key Financial Metrics & Valuation:
Profitability Ratios:
- Return on Equity (ROE): 18.88% - well above industry average
- Return on Capital Employed (ROCE): 65.44% - exceptional capital efficiency
- Operating Margin: Declining by 126 basis points QoQ in Q2 FY26
- Net Profit Margin: 10.5% (Q2 FY26)
Balance Sheet Strength:
- Debt-to-Equity Ratio: Negative -0.69 (debt-free, net cash position)
- Fortress balance sheet with zero debt burden
- Strong working capital position despite rising debtor turnover pressures
Valuation Metrics:
- Current P/E Ratio: 19x
- Price-to-Book Value: 3.90x (reasonable given high ROE)
- Dividend Yield: 1.05%
- Latest Dividend: Rs 9.00 per share (August 2025), payout ratio of 23.19%
Quality Indicators:
- Consistent dividend payer with conservative payout ratios
- High ROCE indicates superior capital allocation
- Zero leverage provides financial flexibility and risk cushion
Sectoral Landscape - Indian Aquaculture & Shrimp Industry:
Market Size & Growth Trajectory:
- Indian Shrimp Market: Valued at $9.2 billion in 2024, projected to reach $22.7 billion by 2033 (CAGR: 10.1%)
- Indian Shrimp Feed Market: $2.0 billion in 2024, expected to grow to $7.4 billion by 2033 (CAGR: 15.7%)
- India Aquafeed Market: $3.51 billion in 2024, projected at $6.40 billion by 2032 (CAGR: 7.8%)
- India ranks as second-largest shrimp producer and exporter globally after Ecuador
Production & Export Statistics:
- FY24 Seafood Exports: Rs 60,523.89 crores (1.78 million metric tons), up 2.67% in volume
- Frozen shrimp accounts for 66.12% of export earnings and 40.19% of export volume
- India shipped seafood worth approximately $7.4 billion last fiscal year
- Production volumes show resilience despite global headwinds
Key Export Markets (Traditional):
- United States: Largest market, historically accounting for 40-50% of exports
- China: Second-largest market with 451,000 MT ($1.38 billion)
- Japan: Third major destination
- Other significant markets: Vietnam, Thailand, EU (Belgium, Spain), Canada, UAE, Italy
Domestic Market Dynamics:
- 72.1% of Indian population (967 million individuals) include fish in their diet
- Growing domestic consumption driven by health awareness and rising incomes
- Shift toward value-added products (ready-to-cook, processed seafood)
Major Industry Challenges & Headwinds:
US Tariff Crisis:
- August 27, 2025: US imposed 50% reciprocal tariff on Indian shrimp imports (25% base + 25% penalty)
- Combined with existing duties: Anti-dumping (3.96%), Countervailing duty (5.77%)
- Total effective duty burden: 58.26% on Indian shrimp exports to US
- August 2025 impact: Indian shrimp exports to US collapsed 43% YoY to 16,495 MT
- Total Indian export volumes fell 9% YoY in August 2025
Cost Pressures:
- Rising raw material costs for feed production (fishmeal, soybean meal)
- Increasing labor and energy costs impacting margins
- Competition from Ecuador in US market, especially in headless shell-on segment
- Global oversupply situation causing price depression
Disease & Environmental Risks:
- Disease outbreaks remain persistent risk in aquaculture
- Climate change and water quality challenges
- Regulatory compliance and sustainability certification requirements
Emerging Opportunities & Positive Catalysts:
Posted Strong Q2FY26 Numbers Despite US Tariff:
- Despite 50% US tariff headwinds, company posted 34.88% YoY profit growth
- Revenue growth of 18.79% YoY demonstrates resilience
- Shrimp processing division grew 62% YoY, offsetting feed segment pressures
- Management successfully diversifying away from US market dependence
China Seafood Export Ban Can Benefit Indian Exporters:
- China banned all Japanese seafood imports (November 2025) amid diplomatic tensions
- This creates substantial market opportunity for Indian seafood exporters
- Indian companies can fill supply gap in massive Chinese market
- China already importing 12,190 MT from India in August 2025, up 33% YoY
- Market diversification reducing US dependency from 48% toward 30-35%
Government Support & Policy Initiatives:
- Union Budget 2025: Proposed 5% Basic Customs Duty on key feed production inputs (down from higher rates)
- Rs 4.5 lakh crore support package for export sectors including seafood
- Pradhan Mantri Matsya Sampada Yojana (PMMSY): Rs 2,352 crores allocated (56% increase)
- Department of Fisheries budget: Rs 2,616.44 crores (54% increase YoY)
- Government targeting $14 billion+ seafood exports by 2025
- Fishery Infrastructure Development Fund (FIDF) for modernization
Market Diversification Strategy:
- Companies actively expanding presence in EU, Middle East, Southeast Asia, Japan, South Korea
- Vietnam, Thailand, Canada becoming key alternative markets
- Development of value-added products commanding higher margins
- China emerging as third-largest market for Indian shrimp after US and Europe
Technology & Innovation Adoption:
- Advanced breeding techniques producing disease-resistant varieties
- Biofloc technology and Recirculating Aquaculture Systems (RAS) improving efficiency
- Precision feeding technologies enhancing feed conversion ratios
- Integration of probiotics and functional ingredients in feed formulations
- Cold chain infrastructure growing 15-30% annually
Product Portfolio Expansion:
- Avanti Feeds launched new pet food products receiving positive market acceptance
- Shift toward value-added products: cooked, breaded, marinated offerings
- Value-added exports up 27% year-to-date despite overall volume pressure
- Premium products targeting European and Asian markets
Structural Competitive Advantages:
- Zero-debt balance sheet provides flexibility during market disruptions
- Highest feed manufacturing capacity (775,000 MT) among Indian players
- Integrated operations from hatchery to processing create vertical synergies
- Strong R&D capabilities and partnerships (Thai Union Group)
- Established distribution networks and brand recognition
Ecuador Supply Disruptions:
- Ecuador facing energy rationing issues disrupting shrimp production
- May redirect global buyers toward Indian suppliers
- Potential to strengthen pricing power and market share gains
- Ecuador's challenges provide tactical advantage for Indian exporters
Sustainability Certifications & Premium Markets:
- Growing demand for certified sustainable seafood (BAP, ASC standards)
- Indian producers investing in traceability and quality systems
- Access to premium European markets requiring strict compliance
- Competitive advantage in environmentally-conscious consumer segments
Competitive Positioning:
Market Leadership:
- Avanti Feeds ranked #1 in Indian shrimp sector by production and revenue
- Feed manufacturing: 775,000 MT capacity (largest)
- Shrimp production: 28,000 MT annually
- Revenue: EUR 615 million (Rs 5,500+ crores) for FY 2022-23
Key Competitors:
- Devi Sea Foods: #2 ranked, EUR 391 million revenue, 52,000 MT shrimp production, 300,000 MT feed capacity
- Waterbase Limited: Major player with diversified operations
- Coastal Corporation: Expanding China presence, up 5% recently on China opportunity
- Apex Frozen Foods: Strong Q2 with positive earnings surprise
Industry Consolidation Trends:
- Top 19 players dominating production and processing
- Increasing entry of multinational companies through JVs
- Consolidation driven by scale requirements and technology investments
Risk Factors & Concerns:
Short-term Challenges:
- US tariff situation remains fluid; potential for escalation to full 50% or negotiation down to 15%
- Sequential margin compression (Q2 vs Q1) indicates near-term profitability pressure
- Raw material cost inflation continuing into FY26
- Working capital pressures with rising debtor turnover ratio
Medium-term Uncertainties:
- Global shrimp prices at lowest inflation-adjusted levels since 2020
- Industry growth stagnation: India's peak exports in 2021 (704,160 MT) not yet regained
- Competitive intensity from Ecuador, Vietnam, Thailand, Indonesia
- EU and other markets may also impose trade restrictions
Operational Risks:
- Disease outbreaks can rapidly impact production
- Water quality and environmental compliance requirements
- Climate-related risks (extreme weather, temperature variations)
- Forex volatility impacting export realizations
Strategic Concerns:
- Slower than expected market diversification progress
- Dependence on commodity shrimp prices
- Shift to Black Tiger (Monodon) from Vannamei faces adoption challenges
- Pet food venture in highly competitive market against established players like Mars
Bull Case Scenario:
Technical Setup:
- Clean breakout from year-long symmetrical triangle with high volume
- If momentum sustains, targets of 860, 920, and new highs above 1,000 are achievable
- Strong base formation provides downside support
Fundamental Strengths:
- China-Japan seafood ban creates immediate export opportunity
- Government support package and duty cuts improve cost structure
- Debt-free balance sheet provides safety margin
- Exceptional ROCE (65.44%) and ROE (18.88%) demonstrate operational excellence
- Valuation attractive at 16.26x P/E with 9.7% discount to industry
Growth Drivers:
- Shrimp feed market growing at 15.7% CAGR through 2033
- Market diversification reducing US exposure from 48% to 30-35%
- Value-added product strategy improving margins
- Capacity leadership position (775,000 MT feed) creates moat
Bear Case Scenario:
Technical Risks:
- Failure to hold above 700 support could trigger return to triangle
- Overhead resistance at 860-920 zone may cap upside
- Volume sustainability crucial; fading volumes could signal false breakout
Fundamental Concerns:
- Sequential profit decline (Q2 vs Q1) signals margin pressure
- US tariffs may worsen if no trade deal materialized
- Global shrimp prices at multi-year lows (inflation-adjusted)
- Raw material cost inflation squeezing feed margins
- Industry growth stagnation since 2021 peak
Structural Headwinds:
- Mature business with 5-year sales CAGR of only 7.5%
- Intense competition from Ecuador in key US market
- Working capital pressures building (deteriorating debtor turnover)
Key Monitorables:
Quarterly Metrics:
- Feed sales volumes and pricing trends
- Shrimp processing margins and export realizations
- Geographic revenue mix (US vs other markets)
- Raw material cost trends (fishmeal, soybean meal)
Market Developments:
- Progress on US-India trade negotiations (tariff reduction to 15%?)
- China market penetration success metrics
- Ecuador supply situation and competitive dynamics
- Government policy implementation and subsidy flows
Technical Levels:
- Sustenance above 700 crucial for bullish structure
- Volume patterns on approach to 860-920 resistance
- Any breakdown below 630 would be major warning sign
My 2 Cents:
The technical breakout from the symmetrical triangle, combined with the China-Japan seafood ban opportunity, creates an interesting risk-reward setup. The company has demonstrated resilience by posting strong YoY numbers despite the US tariff shock. However, the sequential margin compression and global shrimp price weakness remain concerns.
The debt-free balance sheet and exceptional capital efficiency metrics (65% ROCE) provide a strong safety cushion. Market diversification efforts are progressing, though slower than ideal. The 15.7% CAGR expected in the shrimp feed market through 2033 provides secular tailwinds.
From a technical perspective, the stock needs to sustain above 700 and break through 860 with volume to confirm the bullish breakout. The year-long consolidation provides a solid base, but overhead supply at 860-920 could test conviction.
So Avanti Feeds presents a compelling case of a fundamentally strong company navigating through short-term headwinds while benefiting from emerging opportunities. The technical breakout aligns with positive fundamental catalysts (China ban on Japan, government support), though execution challenges and margin pressures remain. The company's market leadership, zero-debt status, and superior returns metrics make it a quality play on India's growing aquaculture story.
Investors should monitor the sustainability of the technical breakout, progress on market diversification, and margin trajectory in coming quarters. The current setup offers an asymmetric opportunity with defined risk.
Full Coverage on my Newsletter this Week
Keep in the Watchlist and DOYR.
NO RECO. For Buy/Sell.
📌Thank you for exploring my idea! I hope you found it valuable.
🙏FOLLOW for more
👍BOOST if you found it useful.
✍️COMMENT below with your views.
Meanwhile, check out my other stock ideas on the right side until this trade is activated. I would love your feedback.
As per the Latest SEBI Mandate, this isn't a Trading/Investment RECOMMENDATION nor for Educational Purposes; it is just for Informational purposes only. The chart data used is 3 Months old, as Showing Live Chart Data is not allowed according to the New SEBI Mandate.
Disclaimer: "I am not a SEBI REGISTERED RESEARCH ANALYST AND INVESTMENT ADVISER."
This analysis is intended solely for informational purposes and should not be interpreted as financial advice. It is advisable to consult a qualified financial advisor or conduct thorough research before making investment decisions.
Strong hands defending 25900–25950 bulls carry index above 26000The last two sessions have told a very clear story about who is in control of this market. Friday started as a negative-bias day, but at 3 pm Nifty printed a violent 5–15 minute thrust of nearly 170 points and completely flipped the tone. That late burst was not random noise – it was the breakout leg of this whole move.
The important detail is where that move paused. The large 3 pm candle on Friday left behind a reference zone around 25,900–25,950, with an intraday base near 25,913. On Monday, the index opened with only a mild gap-up and then spent the entire session respecting that level. On the 5-minute chart not a single candle managed a close below the 25,913 area. Every small dip into that band was bought, and from 11:30 onwards Nifty bounced off this zone and went on to make a series of higher highs and higher lows through the day.
This tells us two things. First, the buyers who stepped in aggressively late on Friday were not short-term scalpers; they are still defending their territory. Second, Friday’s last 15 minutes were not just short-covering – they marked the start of a new leg in the prevailing uptrend.
There was also a clear technical hurdle on the chart: the 26,009 region, which had earlier acted as a rejection point, and the broader 25,700–25,750 band that had been tested multiple times. Today the index finished the session around 26,014, closing above that prior supply zone. That is a constructive signal – the market has absorbed selling where it previously failed and is now accepting prices above 26,000.
On the daily timeframe, Nifty is riding a clean positive structure. Shorter moving averages are stacked above the longer ones and sloping up, confirming trend strength. The last several sessions have formed a rising sequence of lows from the 25,350–25,400 region up to the 25,900 area, while price keeps leaning against the 26,000 ceiling. Effectively, the index is carving out a rising base with horizontal resistance – an “ascending-triangle style” behaviour just under the old high zone. As long as 25,700–25,750 holds on a closing basis, this pattern favours an eventual breakout rather than a collapse.
The weekly chart only reinforces that picture. Nifty has logged multiple positive weeks in a row and is now trading very close to its record zone from late 2024. The broader setup is that of a market recovering from a deep correction earlier in the year and now grinding back towards the top of the range. With weekly momentum turning up and price holding above key moving averages, the burden of proof is on the bears.
Flows and macro data back this up. Foreign institutional investors have swung back to the buy side in the last session, and domestic institutions and mutual funds continue to provide strong support, more than offsetting earlier foreign outflows. That steady domestic bid has been one of the main reasons the index has been able to climb back to the 26,000 handle even when global cues have occasionally been shaky. Corporate earnings have been broadly supportive, especially in financials and select large caps, and recent upgrades from major global houses on India’s medium-term outlook are adding another layer of confidence.
Globally, the environment is not euphoric but it is no longer as hostile as it was earlier in the year. US indices are off their extremes, commodity prices are not in a runaway spike, and the dollar has cooled from its peak, all of which reduces pressure on emerging markets. At the same time, there are enough macro uncertainties left to keep traders disciplined – which is why every move into new high ground will still be tested.
From a trading perspective, the key reference zones now are:
Intraday support (5-min): 25,913 – as long as this area holds, dips on smaller timeframes are likely to find buyers.
Short-term support (daily): 25,700–25,750. A daily close below this band would be the first sign that the current breakout attempt is failing.
Immediate resistance: 26,100–26,200, which lines up with the previous all-time high zone. A strong close above this pocket would open the door for a fresh leg higher.
Deeper support (swing): 25,350–25,400 – the origin of the recent leg, and a line the bulls will not want to surrender.
Psychologically, the tape over the last two sessions shows a market where bad news and intraday dips are being used as opportunities to build long exposure rather than exit it. Friday’s late surge signalled that strong hands were stepping in aggressively; Monday’s action confirmed that they were willing to defend their entry zone and push the index to a higher close above prior resistance. Until we see a decisive break back below 25,700 with heavy volume and persistent selling, the path of least resistance remains up.
In simple terms: Nifty is in a healthy uptrend, strong money is clearly visible behind the last move, and the market just proved it can hold above 26,000. The next big test will be how it behaves when it gets closer to the 26,100–26,200 record area – but for now, the bulls still have the ball.

GOLD: The Bigger Picture is Finally Getting Clearer !Gold finally showed some clarity after weeks of structure, and now the bigger picture is lining up perfectly across the daily and multi-year weekly charts. The rejection from the 4250–4350 zone triggered the first meaningful retracement after a parabolic rally, and price is now hovering right above the 4030–4060 daily support the only level holding back a much deeper corrective cycle. This entire region is critical because it marks the last breakout base, the liquidity origin, and the midpoint of the 3600-4300 vertical leg. As long as this shelf holds, gold will continue to move in a compressed range, but once a clean daily close breaks below it, the market naturally opens up a fast move toward the 3500–3550 target zone. All confluences measured move, channel midline, point to this same cluster, making it a high-confidence retracement level inside a long-term bullish trend.
On the upside, the structure is very clean. Only a sustained breakout above 4300–4350 invalidates the entire correction and flips the bias back to full-bull mode, where gold can easily run toward 4600–4800 as the next discovery leg. Anything below that zone still falls under the extended correction category, not a bullish continuation. This is why the invalidation level is drawn exactly where it is to protect from guessing the reversal too early.
On the weekly chart, gold has slipped back inside the multi-year ascending channel after briefly wicking above it. That wick was nothing but a classic blow-off extension followed by a reversion to mean. Now price is sitting comfortably inside the same long-term structure . The upper red band remains the multi-year resistance, the green midline is the structural backbone of the trend, and the purple lower band is the deep cycle accumulation zone. As long as gold stays inside this channel, the macro remains strongly bullish and corrections within this structure are normal and healthy. The mid-channel region around 3500 also aligns perfectly with the expected daily correction, which adds even more confirmation that this retracement is simply part of the long-term trend and not a trend reversal.
Commodity index on both daily and weekly frames is cooling off from extreme levels, which supports a deeper pullback rather than an immediate rally. No new bullish divergence has appeared yet, meaning momentum still favors a downside sweep before any major upside continuation. Combine that with the lack of fresh macro drivers and a stabilization in rate-cut expectations, this cooling phase was overdue.
In simple below daily support, gold continues the correction toward 3500-3650 above 4350, the correction thesis dies and the bull trend resumes aggressively. Until then, this is a textbook retracement inside a long-term uptrend nothing broken, nothing unexpected, just a parabolic market taking a breath. Trade safe !

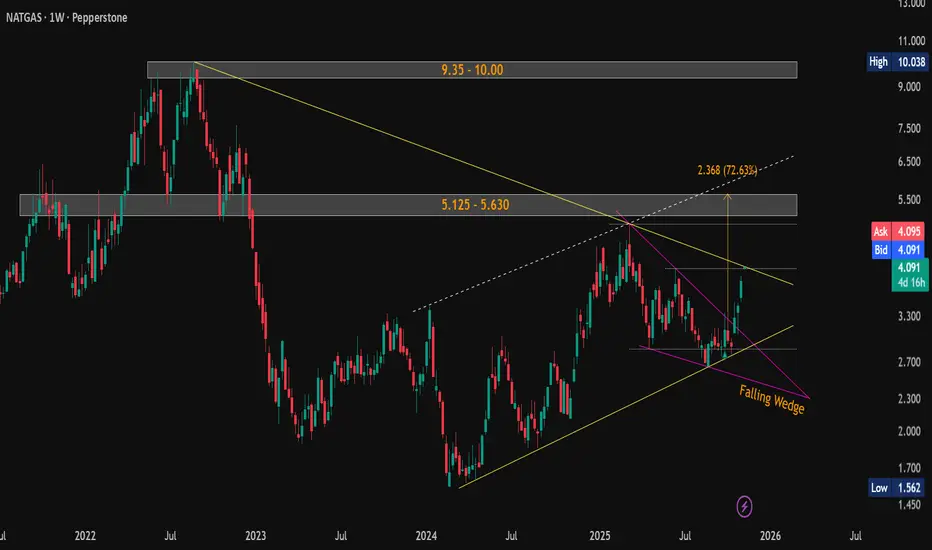
#NaturalGas ($NG) Weekly Update — Testing Critical Resistance!CMP: $4.092
💥 Up +38% from mentioned support ( $3.013–$2.956 ) and +46% from lows in a month . 🚀
The falling wedge breakout played out strongly, and price is now testing the critical resistance of the falling yellow trendline near the previous swing high $4.067 .
A weekly close above this trendline will confirm a major breakout , potentially triggering the next leg higher.
📊 Key Levels:
🛡 Supports: $4.067 / $3.013–$2.956 / $2.692–$2.643
🚧 Resistances / Targets: $5.125–$5.630 / $9.35–$10.00
Structure now forming a larger Symmetrical Triangle between rising and falling yellow trendlines — watch for breakout confirmation .
⚠️ Possible short-term pause/retest before continuation.
#NaturalGas #NG #Commodities #FallingWedge #RisingChannel #SymmetricalTriangle #ChartPattern #PriceAction
📌 #Disclaimer: This analysis is shared for educational purposes only. It is not a buy/sell recommendation. Please do your own research before making any trading decisions.
Silver Triangle BreakoutSilver is attempting breakout forming a ascending triangle pattern on 1h and 4h timeframe. It is also trading above 200ema.

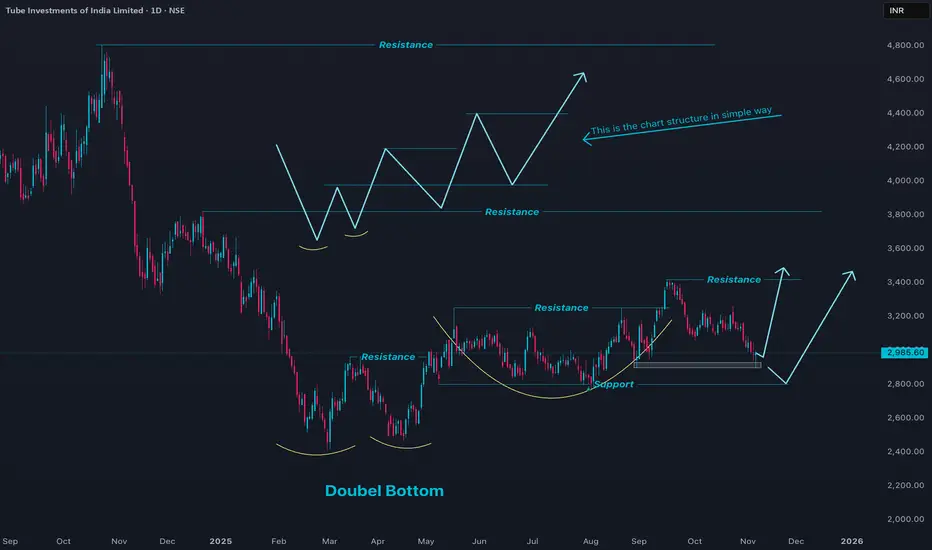
TIINDIA Price Action structure with fundamental analysisFundamental analysis of Tube Investments of India (TIINDIA) focuses on several core aspects:
TIINDIA is a leading player in the engineering sector, specifically known for automotive components, bicycles, and metal-formed products, with diversified interests in financial services and defense. The company has shown consistent revenue and profit growth over recent years, driven by strong operating efficiency, robust product demand, and expansion into new business segments.
The balance sheet demonstrates healthy capital structure: low debt-to-equity ratio, strong reserves, and active capex deployment for modernization and growth projects. High return on equity, stable asset turnover, and rising EBITDA margins reflect management’s focus on profitable growth and cost discipline.
Recent trends include:
- Diversification into electric vehicle ancillary and defense manufacturing.
- Strategic acquisitions and partnerships to boost scale and technology.
- Consistent dividend payouts supported by cash flow generation.
- Sensitivity to raw material costs (steel, metals), which can impact margins during volatile periods.
- Strong position within Indian automotive and infrastructure cycles, supported by government push for manufacturing and exports.
Overall, TIINDIA’s fundamentals point to resilience, sector leadership, and capacity for long-term growth, though cyclical risks and commodity price movements should be monitored. The management’s focus on product innovation, financial prudence, and operational expansion continues to support positive outlook for investors.
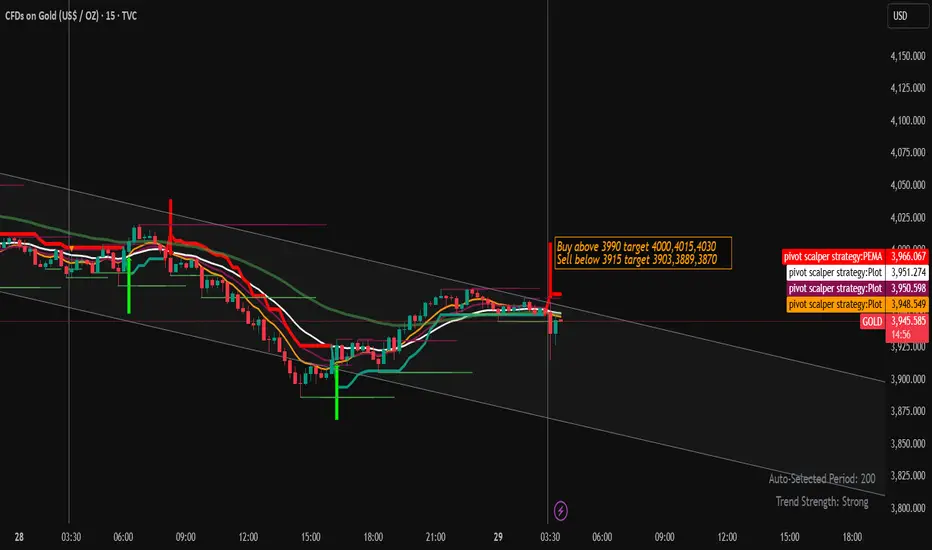
Gold Trading Strategy for 29th October 2025 (IST)🪙 TVC:GOLD Intraday Trading Plan
📈 Buy Setup:
🔹 Entry: Above the high of 15-min candle (Close > $3990)
🎯 Targets: $4000, $4015, $4030
🛑 Stop Loss: Below $3975 (or below candle low for confirmation)
📉 Sell Setup:
🔹 Entry: Below the low of 15-min candle (Close < $3915)
🎯 Targets: $3903, $3889, $3870
🛑 Stop Loss: Above $3930 (or above candle high for confirmation)
⚠️ Disclaimer:
Trading in gold or any commodity involves substantial risk. This plan is for educational and informational purposes only — not financial advice. Always assess your own risk before entering any position. 📊
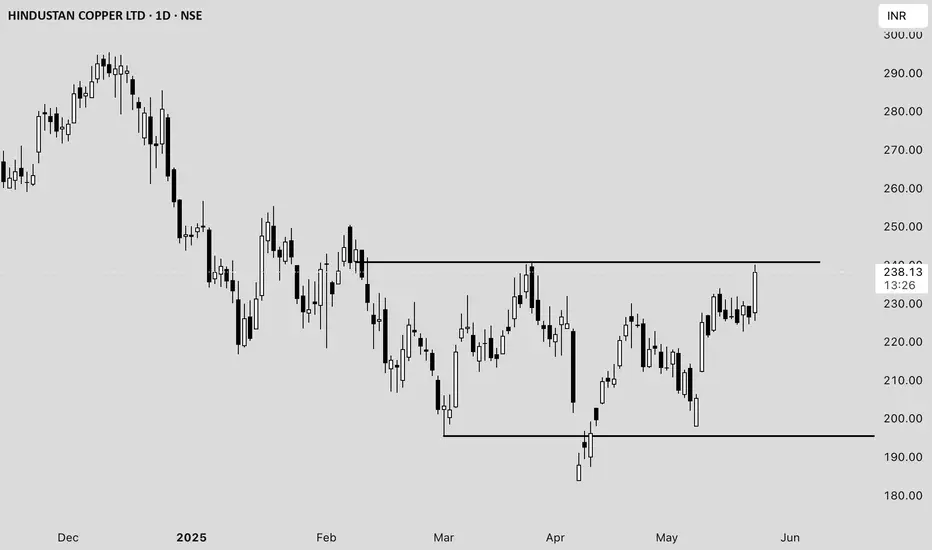
HINDCOPPER: High-Tight FlagHINDCOPPER is demonstrating a classic High-Tight Flag pattern. This is one of the most powerful continuation patterns, typically seen in strong market leaders.
"High": A massive, powerful rally (the pole) from the August lows to the recent peak near ₹360, confirming extreme demand.
"Tight Flag": A period of tight, low-volatility consolidation immediately following the rally. This formation is taking the shape of a symmetrical triangle/pennant, which shows demand and supply are in a temporary, very tight balance.
This flag is coiling right below the "Weak High" at ₹360, absorbing any remaining supply before the next leg up.
Key Technical Confirmation
Trading Above All MAs: As you noted, the stock is trading clearly above all key moving averages, which are stacked in bullish order. This confirms the strong, established uptrend.
Superior Relative Strength: The Relative Strength line (bottom panel) is highly positive and trending upwards. This is the mark of a leading stock that is decisively outperforming the Nifty.
Volume Signature: Volume was huge during the initial rally (the pole) and has decreased significantly during the current flag consolidation, confirming that sellers have stepped back. We expect volume to spike on the breakout.
Sector Tailwinds: The underlying strength and positive momentum in the Metal sector provide strong fundamental support for the technical breakout.
The Trade Plan
Entry Signal: A decisive daily close above the flag's upper trendline (near ₹350). The final, high-conviction signal would be a break above the recent high of ₹360 on significantly higher than average volume.
Stop Loss (Risk Management): Place a clear, objective stop loss below the low of the consolidation pattern, for example, around ₹320. This maintains a favorable risk/reward ratio.
Target Expectation: High-Tight Flags project the pole's move upward. The expectation is for a sustained, powerful move into new All-Time Highs.
Potential Risks & Cautionary Notes
Failure to Break: The primary risk is a failure to break the ₹360 pivot. If the price breaks the lower trendline of the flag (e.g., drops below ₹330), the pattern is invalidated, and it signals a deeper correction.
Commodity Price Reversal: The price of copper is volatile. Any sudden, sharp reversal in global copper prices could immediately create headwinds for the stock.
Profit Taking: Given the steepness of the prior rally (the pole), there is a risk of aggressive profit-taking if the market pulls back. Use a tight stop-loss to manage this volatility.
#Disclaimer: This is for educational and observation purposes only and is not financial advice. Always adhere strictly to your defined stop-loss and manage your risk according to your personal trading plan.

Hindustan Copper Ltd. (HINDCOPPER) Price Analysis **Date:*#### **Current Price and Intraday Movement**
- **Latest Price:** ₹237.98 (+5.09% / +₹11.52)
- **Day’s Range:** ₹225.50 – ₹240.10
- **Open:** ₹227.60
- **Previous Close:** ₹226.46
- **Volume:** 1.63 crore shares (well above average daily volume of 55.89 lakh)
#### **Technical Overview**
- **52-Week Range:** ₹183.82 – ₹381.90
- **50-Day Average:** ₹216.99
- **200-Day Average:** ₹260.58
- **Market Cap:** ₹23,013 crore
- **P/E Ratio:** 57.48
- **EPS:** ₹4.14
#### **Recent Performance and Trends**
- **Short-Term Trend:** The stock surged over 5% today, outperforming its sector and showing strong buying interest .
- **Volume Spike:** Today’s volume is nearly triple the average, indicating heightened trader participation .
- **Technical Position:** The stock is trading above its 50-day moving average but remains below the 200-day average, suggesting a recovery from recent lows but still under medium-term resistance .
- **Support/Resistance:** Immediate resistance is near ₹240–₹249 (upper circuit), with support at ₹225 and ₹216 (50-DMA) .
#### **Fundamental Snapshot**
- **Valuation:** High P/E ratio (57.48) signals expensive valuation relative to earnings .
- **Profitability:** EPS at ₹4.14; profit margins have been under pressure.
- **Industry Position:** Hindustan Copper is India’s primary copper producer, with exposure to global copper price trends and domestic infrastructure demand.
#### **Outlook**
- **Short-Term:** Strong momentum and volume could drive further upside if it breaks above ₹240, but overbought conditions may trigger profit booking near resistance.
- **Medium-Term:** Needs to sustain above the 200-DMA (~₹260) for a confirmed trend reversal.
- **Risks:** High valuation and recent volatility; global commodity price swings can impact earnings.
---
**Summary:**
Hindustan Copper is showing robust short-term momentum with strong volume and price gains, but faces resistance near ₹240–₹249. The stock remains fundamentally expensive, and investors should watch for sustained moves above the 200-DMA for a longer-term bullish signal .
NIFTY 50 Technical LevelsNIFTY 50 Technical Levels:-
Current/Closing Level: Approx. 25,795 - 25,843 (Based on recent closing data).
Immediate Resistance (R1): 25,900 - 26,008 (Crucial breakout zone and upper band of the recent consolidation).
Key Resistance (SQRT-R2 / ATH Target): 26,244 - 26,277 (All-Time High and measured move target).
Immediate Support (SQRT-S1): 25,600 - 25,700 (Recent breakout region and strong demand area/pivot).
Key Support (SQRT-S2): 25,281 (Breakdown below this could signal a deeper correction).
Outlook: The Nifty is positioned for a breakout above 25,900. A "Buy on Dips" strategy near S1 is advisable given the short holding period and overbought conditions in some oscillators (RSI near 70, Stochastic overbought).
Q2 FY25 Earnings Season Impact
Overall Theme: Mixed to Largely In-Line, with K-shaped Recovery continuing.
Strong Performers (Positive Catalysts): Banking & Financial Services (strong loan demand, improved asset quality), Pharma (strong export demand, stabilization of raw material costs), IT (large deal wins, digital focus), and Realty.
Laggards (Negative/Muted Impact): FMCG (muted rural demand, inflation), Energy (margin compression, higher costs), and Infrastructure (slowdown in project announcements).
Investment Implication: Favor stocks in outperforming sectors (Financials, Pharma, IT) that have delivered positive earnings surprises or provided strong guidance for H2 FY25.
FII Flow Patterns & Global Market Sentiment
FII Flow: FIIs (Foreign Institutional Investors) have shown a recent turnaround to net buying after a period of selling, which is a significant positive sentiment boost. However, flows can be volatile. DII (Domestic Institutional Investor) support remains consistently strong, providing a robust floor to the market.
Global Sentiment: Cautious. Global growth concerns persist. US interest rates are expected to soften, which traditionally supports emerging markets like India. Global volatility is a key risk factor.
Investment Implication: The return of FII buying, combined with DII strength, supports a positive tactical view for the next 15 days, favoring liquid large-cap stocks that FIIs typically target (e.g., Financials, IT).
Sector Rotation Trends
Outperforming/Improving: Banking & Financial Services (Bank Nifty at All-Time High), IT (improving relative performance), Metals (commodity cycle/trade deal optimism), and Energy/Oil (improving relative momentum).
Underperforming/Lagging: FMCG and Midcap/Smallcap Indices (Midcap 100 in the weakening quadrant, suggesting caution in this segment).
Investment Implication: Focus on the improving and outperforming sectors, particularly Banking, IT, and selective Metals/Energy to capitalize on the current momentum for a short-term trade.
FOR FUTURE INVESTMENT EAGLE EYE ON:-
Hindalco
ITC
NTPC
Sun Pharma. Inds.
HDFC Bank
Kotak Mah. Bank
ICICI Bank
SBI
O N G C
HCL Technologies
Infosys

#CHOLAHLDNGThis weekly chart of Cholamandalam Financial Holdings Ltd (NSE) shows a significant bullish move, with the price closing at 2,012.70 INR, up by 7.83%. Strong support and resistance levels are clearly marked, along with indicators signaling technical strength.
Price and Trend Analysis
The stock surged to 2,012.70 INR after bouncing off the 1,822.3 support area, suggesting robust buying from lower levels.
Immediate resistance lies near 1,934.2 and a major resistance near the prior swing high at 2,230.06 INR.
The positive green candle after a consolidation range implies momentum has turned bullish on the weekly timeframe.
Technical Indicators
CCI (Commodity Channel Index) values are bullish (D: 155.16), supporting continued upward momentum.
The overall technical score (43, with an up arrow and star) indicates bullish bias based on combined weekly, monthly, and daily metrics.
Increasing volume bars on green (up) weeks further confirm buyers' strength at the current level.
Support and Resistance Levels
Support Level Resistance Level
1,822.3 1,934.2
1,524.4 2,204.2, 2,230.06
1,509.6
1,356.4

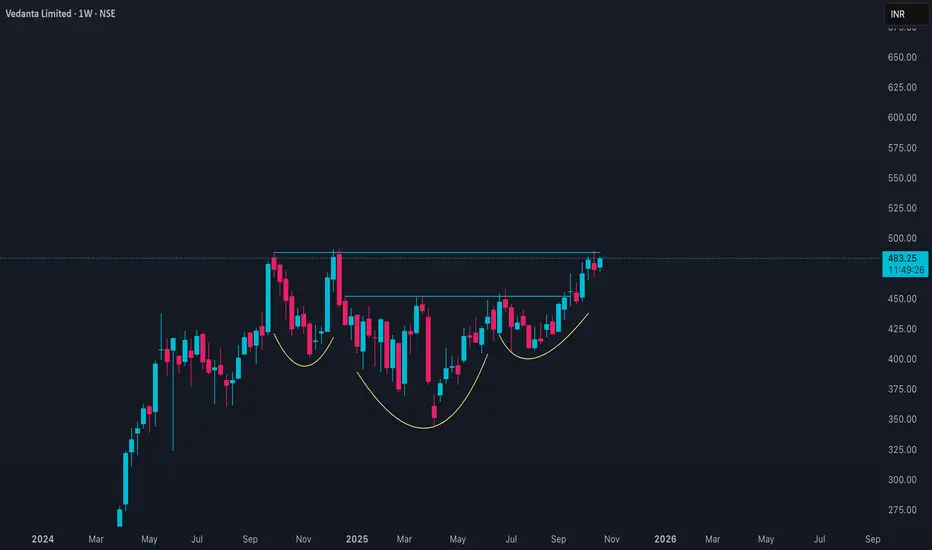
VEDL Price ActionAs of October 23, 2025, **Vedanta Limited (VEDL)** closed at around **₹483.25**, up approximately **1.6%** from the previous close near ₹475.65. The stock traded within a range of ₹474.65 to ₹484.85 during the day, reflecting sustained buying interest and moderate volatility.
Vedanta's market capitalization is about **₹1.89 trillion**, making it one of the largest diversified natural resources companies in India. Its earnings per share (EPS) stand at roughly **₹37.11**, with a price-to-earnings (P/E) ratio of around **13.0**, indicating an attractive valuation relative to some peers in the metals and mining sector.
Technically, Vedanta is in a mild uptrend, trading above both the 50-day (₹452.40) and 200-day (₹441.10) moving averages, which represent strong support levels. The Relative Strength Index (RSI) is near 60, indicating strength without being overbought.
Key support is positioned around ₹475, while resistance may be encountered near ₹490–₹495 levels. Overall, the medium-term outlook is positive, supported by stable commodity prices, cost control measures, and steady operational performance. Traders may look for a breakout above ₹490 to confirm further upside potential, while any dip closer to ₹470–₹475 may be viewed as a buying opportunity.
SILVER1!(DILBER-DILBER)Based on current trading volumes, liquidity, and market activity on the Multi Commodity Exchange (MCX) as of October 2025, the most in-demand commodities are those with the highest trading volumes and consistent price movements. These reflect strong investor interest driven by global factors like economic uncertainty, geopolitical tensions, and seasonal demand. Globally and on MCX, gold and silver in trading activity due to their high liquidity and role as safe-haven or industrial assets.
Gold and Silver: These bullion metals dominate MCX volumes (often 60–70% of total turnover) due to their role in hedging inflation. Recent corrections (down ~10% from peaks) have not dimmed interest.
This is my Diwali Gift for every traders.

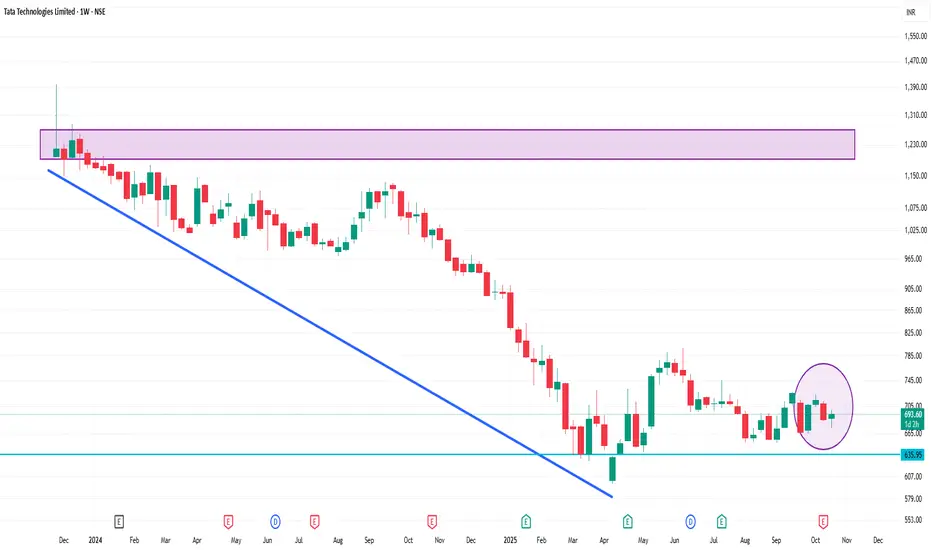
TATATECH 1 Week Time Frame 📉 Technical Summary (1-Week Outlook)
Overall Rating: Bearish to Neutral
Moving Averages: The stock is trading below key moving averages, including the 5-day, 10-day, 20-day, and 50-day, indicating a short-term bearish trend.
Relative Strength Index (RSI): At 43.13, the RSI suggests a neutral stance, indicating neither overbought nor oversold conditions.
MACD: The MACD is at -0.64, which typically signals a bearish trend.
Support Levels: Key support is observed around ₹677.75.
Resistance Levels: Immediate resistance is near ₹699.95.
🔍 Indicator Insights
Stochastic Oscillator: At 13.30, indicating potential for a short-term rebound.
Commodity Channel Index (CCI): At -74.09, suggesting neutral momentum.
Average Directional Index (ADX): At 16.41, showing weak trend strength.
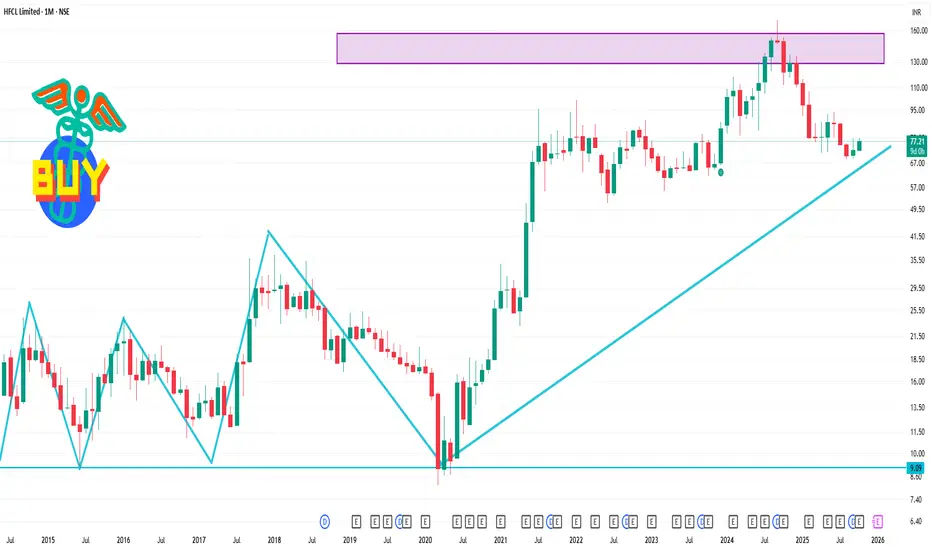
HFCL 1 Month Time Frame 📊 Monthly Technical Indicators
RSI (14-day): 57.91 — Neutral
Stochastic RSI: 72.52 — Neutral
MACD: 0.64 — Slightly bullish
ADX (14): 18.80 — Weak trend strength
Commodity Channel Index (CCI): 26.28 — Neutral
Rate of Change (ROC): 4.63% — Positive momentum
Williams %R: -51.95 — Neutral
Ultimate Oscillator: 48.33 — Neutral
Average True Range (ATR): ₹2.67 — Moderate volatility
📈 Moving Averages
Short-Term (5, 10, 20-day): Bullish
Medium-Term (50-day): Bullish
Long-Term (100, 200-day): Bearish
🧭 Key Support & Resistance Levels
Support Levels: ₹76.43 (S1), ₹75.73 (S2), ₹74.86 (S3)
Resistance Levels: ₹78.12 (R1), ₹79.06 (R2), ₹80.00 (R3)
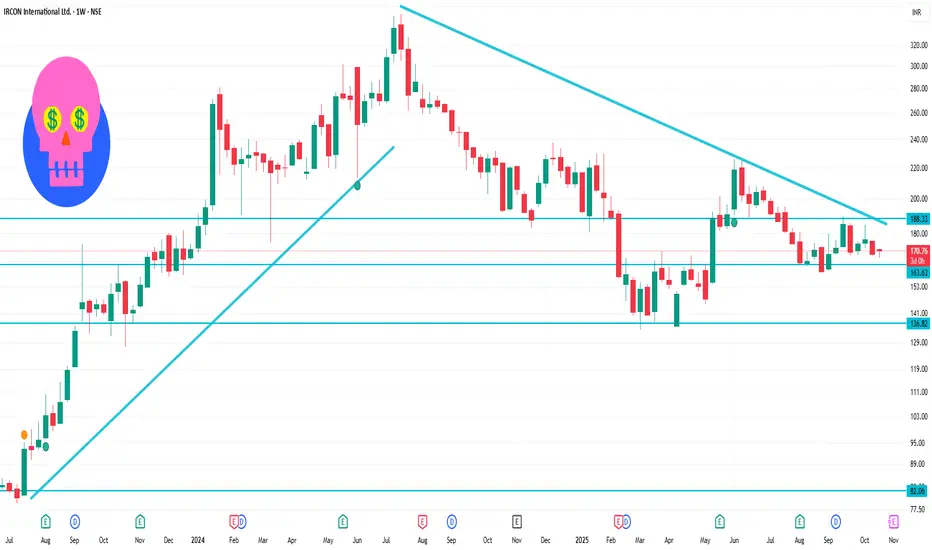
IRCON 1 Week Time Frame 📉 1-Week Performance
Current Price: ₹170.23
Weekly Change: Approximately -1.33%
Recent High: ₹175.30 on October 16
Recent Low: ₹167.30 on October 21
📊 Technical Indicators (Weekly)
Relative Strength Index (RSI): 57.79 — Neutral
Moving Average Convergence Divergence (MACD): 0.04 — Slightly Bearish
Commodity Channel Index (CCI): -283.04 — Bearish
Average Directional Index (ADX): 25.32 — Indicates a weak trend
Ultimate Oscillator: 63.31 — Neutral
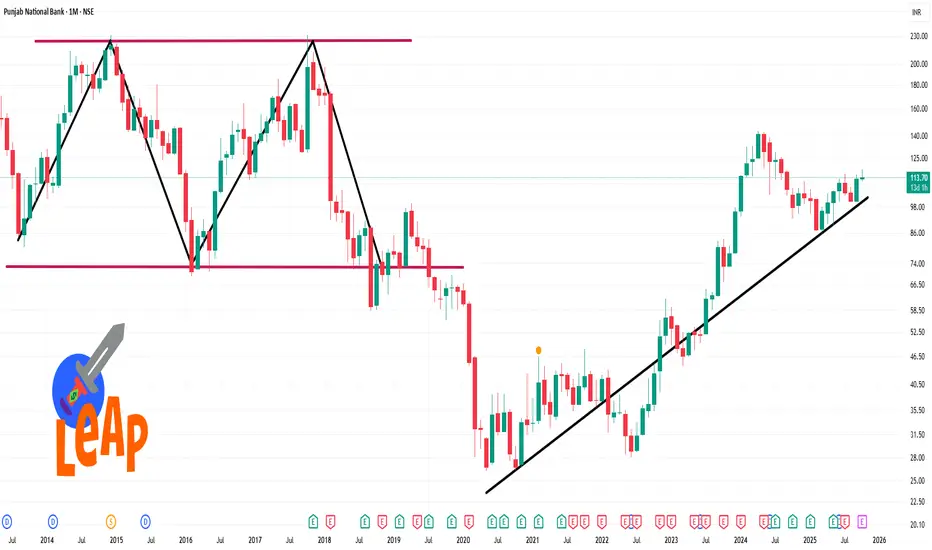
PNB 1 Month Time Frame Level 📊 Key Technical Indicators
Relative Strength Index (RSI): The 14-day RSI is approximately 59.6, suggesting the stock is neither overbought nor oversold, indicating a neutral stance.
Moving Averages:
20-day Simple Moving Average (SMA): 113.73 (bullish)
50-day SMA: 113.61 (bullish)
200-day SMA: 113.87 (bearish)
20-day Exponential Moving Average (EMA): 113.75 (bullish)
50-day EMA: 113.66 (bullish)
200-day EMA: 113.97 (bearish)
Moving Average Convergence Divergence (MACD): The MACD is positive, indicating bullish momentum.
Commodity Channel Index (CCI): The CCI is at 462.41, which is considered extremely overbought, suggesting potential for a pullback.
🔍 Support and Resistance Levels
Resistance: 117.24
Support: 111.4