LUPIN LIMITED – Technical Analysis________________________________________
📊 LUPIN LIMITED – Technical & Fundamental Snapshot
Ticker: NSE:LUPIN | Sector: Pharmaceuticals
Current Market Price (CMP): ₹1,944.20 ▲ (+4.99%) (as of August 7, 2025)
Chart Pattern: Consolidation Zone (Between ₹1,795.20 and ₹2,225)
Market Sentiment: ⭐⭐⭐ Neutral-to-Positive
________________________________________
🔍 What’s Happening on the Chart?
Lupin’s stock is moving sideways — like it's stuck in a box.
📦 Box Range: Between ₹1,795.20 (bottom) and ₹2,225 (top)
👉 Current price is near the middle at ₹1,944.20 — this means buyers and sellers are in a tug of war.
________________________________________
🕯️ Candle & Indicator Analysis (Simplified)
Here’s what the chart is telling us:
📈 Bullish Marubozu Candle:
Strong green candle — indicates buyers were in control all day.
VWAP (Volume Weighted Avg. Price):
✅ Positive — suggests big players (institutions) may be buying.
MACD (Momentum):
⚠️ Bearish — signals that upside momentum is still not strong.
RSI (Relative Strength Index):
52 = Neutral — price isn't overbought or oversold.
Stochastic Indicator:
69 and rising — momentum could be picking up soon.
CCI (Commodity Channel Index):
–17 = Slight weakness, but still within a normal zone.
🧠 What This Means:
The chart is not strongly bullish yet, but it’s showing early signs. Wait for price to break out of the range to confirm strength.
________________________________________
🧭 Key Levels to Watch (Support & Resistance)
📌 Resistance (where price may face selling pressure):
R1: ₹1,980
R2: ₹2,015
R3: ₹2,077
📌 Support (where price may bounce from):
S1: ₹1,882
S2: ₹1,820
S3: ₹1,784
________________________________________
🚨 Breakout Watch Zone
📈 If price breaks and holds above ₹1,980–₹2,015, momentum may increase.
📉 A fall below ₹1,795 might look bearish, but if it bounces back quickly, it can be a false breakdown.
🧠 Beginner Tip:
Don’t rush into a trade. Wait for a close above key levels to confirm direction. Patience protects your capital.
________________________________________
📰 Recent News & Sentiment Update
🧾 Strong Q1 FY26 Results:
Net Profit: ₹1,221 Cr (↑ 52% YoY)
Revenue: ₹6,164 Cr
💥 Stock Reaction:
Price jumped nearly 5% after the earnings report.
⚠️ Macro Risk Alert:
US President Trump hinted at tariffs up to 250% on pharma imports. If this happens, Indian pharma exporters like Lupin could be impacted. (📢 Source: The Economic Times )
________________________________________
📈 Investment Outlook (Short & Long Term)
⏳ Short-Term:
Watch price near ₹1,980–₹2,015 zone
If it breaks out, there may be upside potential
If not, expect more sideways movement within the ₹1,795–₹2,225 range
📆 Long-Term:
If growth continues and tariff fears cool down, the stock may head towards ₹2,200–₹2,375
________________________________________
🧠 STWP’s Educational Trade Idea (Not a Recommendation)
🎯 Watch for potential long trade above: ₹1,952.70
🛑 Stop Loss (to manage risk): ₹1,834.35
💡 Risk-Reward Idea: 1:1 minimum, aim for 1:2 or better
⚠️ This is not a buy or sell signal. It’s shared to help understand trade planning.
________________________________________
🔰 Trading Note for Beginners:
Don’t just buy based on news or a green candle. Use levels, wait for confirmation, and always define your risk with a stop loss.
________________________________________
⚠️ Disclaimer (Please Read Carefully):
This content is shared strictly for educational and research purposes only.
I am not a SEBI-registered investment advisor, and no buy or sell recommendations are being made.
All views expressed are based on personal market analysis and experience. They are not intended as financial advice.
Trading — especially in derivatives like options — involves significant financial risk. Losses can exceed your initial investment.
👉 Always do your own research and consult a certified SEBI-registered advisor before making any investment or trading decisions.
👉 Use proper risk management and only trade with capital you can afford to lose.
The author assumes no responsibility or liability for any trading losses incurred from acting on this content.
By engaging with this material, you agree to these terms.
________________________________________
💬 Found this helpful?
Drop your thoughts, questions, or insights in the comments below ⬇️ — let’s learn together!
🔁 Share this post with your trading friends and community — help them discover clean charts, structured setups, and zone-based learning.
✅ Follow simpletradewithpatience for clear setups, educational content, and a no-nonsense approach to price action, supply-demand zones, and risk-managed trades.
🚀 Trade with patience. Trust your charts. Stay clear-headed.
Because the goal is not just to trade — it's to trade better.
Be Self-Reliant | Trade with Patience | Learn with Charts & Zones 📊
________________________________________
Search in ideas for "COMMODITY"

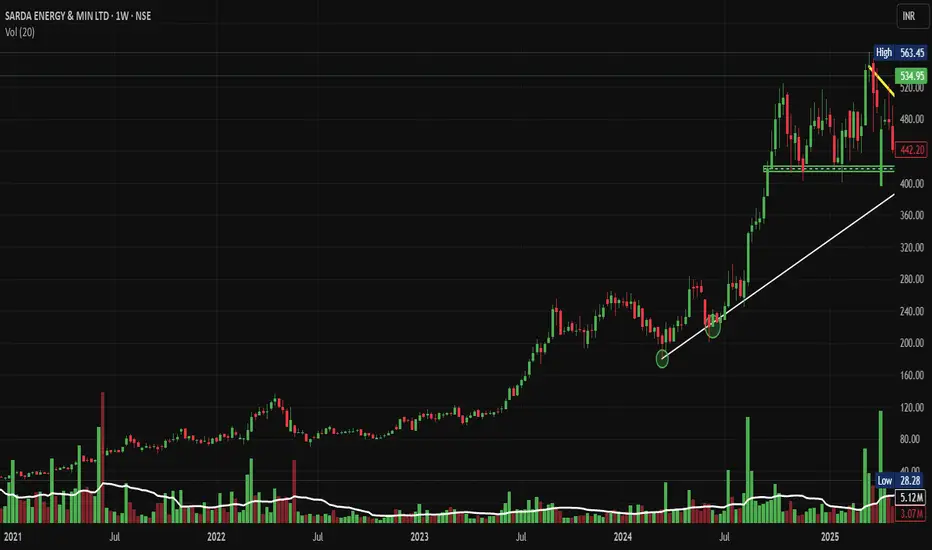
SARDAEN: Triangle Breakout, Chart of the WeekWhy NSE:SARDAEN Triangle Breakout Could Signal the Next Big Move in it, let's analyze in "Chart of the Week" Post Strong Q1 FY26 Results
As per the Latest SEBI Mandate, this isn't a Trading/Investment RECOMMENDATION nor for Educational Purposes, it is just for Informational purposes only. The chart data used is 3 Months old, as Showing Live Chart Data is not allowed according to the New SEBI Mandate.
Disclaimer: "I am not a SEBI REGISTERED RESEARCH ANALYST AND INVESTMENT ADVISER."
This analysis is intended solely for informational purposes and should not be interpreted as financial advice. It is advisable to consult a qualified financial advisor or conduct thorough research before making investment decisions.
Price Action Analysis:
• Stock has exhibited a strong uptrend from 2022 lows around ₹120-140 to current levels of ₹534.95
• Major rally phase from mid-2023 onwards, gaining over 300% in approximately 18 months
• Current consolidation phase since late 2024, around ₹400-600 range, indicates institutional accumulation
• Recent price action shows formation of higher lows with resistance being tested multiple times
Volume Spread Analysis:
• Volume spikes during major breakout moves confirm institutional participation
• Recent consolidation accompanied by relatively lower volumes, typical of the accumulation phase
• Volume breakout above 7.11M suggests renewed interest at current levels
• Volume pattern supports the bullish bias with buying interest on dips
Key Technical Levels:
Base Formation:
• Primary base established between ₹400-₹430 levels during 2024 consolidation
• Secondary base forming at ₹480-₹500 range as recent support
• Base width of approximately 8-10 months indicates a strong foundation for the next leg up
Support Levels:
• Immediate Support: ₹480-₹500 (recent swing lows and 50-day moving average area)
• Strong Support: ₹420-₹440 (previous resistance turned support)
• Major Support: ₹380-₹400 (long-term trend line support and 200-day moving average)
Resistance Levels:
• Immediate Resistance: ₹560-₹580 (recent highs and psychological level)
• Major Resistance: ₹600-₹620 (all-time high zone and round number resistance)
• Extended Resistance: ₹680-₹720 (measured move projection from triangle pattern)
Technical Pattern Recognition
Symmetrical Triangle Pattern:
• Clear triangle formation visible from the chart with converging trend lines
• Triangle spans approximately 8-10 months, indicating a significant pattern
• Breakout direction typically follows the prevailing trend (bullish in this case)
Trend Line Analysis:
• Primary uptrend line intact from 2022 lows, providing dynamic support
• Resistance trend line from 2024 highs is being challenged multiple times
• Converging trend lines creating the triangle pattern setup
Fundamental and Sectoral Backdrop:
Company Fundamentals:
• Market Cap: ₹18,852 crore (up 88.40% in 1 year)
• Revenue: ₹5,350 crore with profit of ₹941 crore (TTM)
• Business Model: Manufacture of sponge iron, ferro alloys, billet, wire-rod, and iron ore pellet through Steel, Ferro, and Power segments
• Promoter Holding: 73.16% indicating strong management confidence
• Dividend Policy: Low payout at 7.69% of profits over the last 3 years, suggesting reinvestment focus
Sectoral Outlook:
• Steel Industry: India is the world's largest steel producer with strong domestic demand
• Ferro Alloys Market: Global market projected to grow from $156.37 billion in 2024 to $204.2 billion by 2032 at 5.60% CAGR
• Indian Ferrosilicon: Market valued at $347.7 million in 2022, estimated to grow at 5.0% CAGR through 2030
• Infrastructure Push: Union Budget 2025-26 increased capital investment outlay for infrastructure by 11.1% to ₹11.2 lakh crore
Growth Lever:
• Integrated business model across the steel value chain provides operational synergies
• Strong promoter holding indicates alignment with minority shareholders
• Beneficiary of India's infrastructure development and steel demand growth
• Consolidation phase completion, suggesting readiness for the next growth phase
Key Risk Factors:
• Commodity price volatility affecting margins
• Working capital days increased from 78.1 days to 119 days, indicating efficiency concerns
• Current valuation appears overvalued by 52% compared to intrinsic value
• Global steel demand fluctuations and trade policy changes
Market Catalysts:
• Government infrastructure spending and PLI schemes
• 2025 outlook suggests potential upturn in steel producer activity with lower input costs and shifting trade policies
• Iron ore production increased by 5.5% to 135 MMT in FY 2024-25, supporting raw material availability
• Ferro Alloys industry poised to reach $188.7 billion by 2025, driven by a robust economy
Full Coverage on my Newsletter this Week
Keep in the Watchlist and DOYR.
NO RECO. For Buy/Sell.
📌Thank you for exploring my idea! I hope you found it valuable.
🙏FOLLOW for more
👍BOOST if you found it useful.
✍️COMMENT below with your views.
Meanwhile, check out my other stock ideas on the right side until this trade is activated. I would love your feedback.
As per the Latest SEBI Mandate, this isn't a Trading/Investment RECOMMENDATION nor for Educational Purposes, it is just for Informational purposes only. The chart data used is 3 Months old, as Showing Live Chart Data is not allowed according to the New SEBI Mandate.
Disclaimer: "I am not a SEBI REGISTERED RESEARCH ANALYST AND INVESTMENT ADVISER."
This analysis is intended solely for informational purposes and should not be interpreted as financial advice. It is advisable to consult a qualified financial advisor or conduct thorough research before making investment decisions.
8.5 Gold Analysis8.5 Gold Analysis
Current Gold Technical Landscape: Upward Trend After Bottom Confirmation
📈Key Drivers:
1. Bottom Formation Completed: Gold prices formed a solid base at $3,325, and a short-term uptrend was established after breaking through the $3,350 resistance level.
2. Moving Average Support: The 100-day and 200-day simple moving averages (above $3,350) on the 4-hour chart have stabilized, providing technical support.
3. Key Fibonacci Level Breakthrough: The 61.8% retracement level (corresponding to the $3,438-3,268 decline) has been effectively broken through, strengthening bullish momentum.
🎯 Key Price Path Analysis
Upward Resistance Chain
First Resistance: $3,400 (76.4% Fibonacci Retracement + Psychological Level)
Breakout Target:
$3,420 (Bearish Defense) → $3,432 (Trend Reversal Confirmation Point)
A clear break above $3,432 will open up the potential for a move from $3,440 to $3,450 (challenging the year's high).
Bullish signal strengthens: A daily close above $3,432 could raise technical targets to $3,475-3,500.
Downside Defense System*
Immediate Support: $3,365 (Intraday Bull-Bear Divider)
Core Support Band:
$3,350 (Concentrated Moving Average Area + Breakout Confirmation Level)
$3,340 (Short-Term Stop-Loss Trigger Point)
Bottom Line: $3,315 (If broken, trend reverses, targeting $3,300)
⚖️ Bull-Bear Game Focus
1. Fundamental Catalysts:
Deepening Expectations of Rate Cuts: The probability of a September Fed rate cut exceeds 90%.
Geopolitical Risk Aversion: Trump's tariff policy on India and the Middle East conflict continue to provide support.
2. Risk of Drag from Related Markets:
WTI crude oil plummeted 1.25% to $65.46, indicating bearish technical signals. A break below the $66 support level could trigger a sell-off in the commodity market.
The US Dollar Index stabilized at 99.0: Rising US Treasury yields (10-year to 4.21%) limited gold's gains.
🚦 Trading Strategy: Follow the trend and monitor for breakouts.
Long Strategy:
If the current price retraces to the 3365-3350 range, place long orders in batches, targeting $3400 → $3432, with a stop-loss below 3340.
If it breaks through $3385, go long, targeting $3400-3425.
Short Defence:
If it falls below $3350, try shorting with a small position after a short-term pullback, targeting $3315-3300.
If my analysis is helpful, I hope you'll give me a thumbs-up.

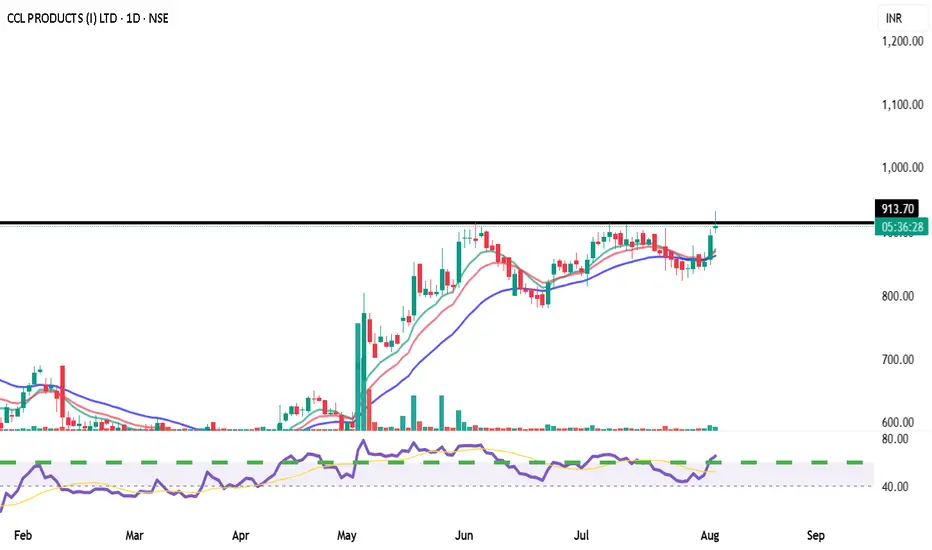
CCL PRODUCTS (INDIA) LIMITED EQUITY RESEARCH REPORTRecommendation: BUY
Target Price: ₹1,050 (12-month horizon)
Stop Loss: ₹850
Rationale
CCL Products represents a compelling investment opportunity in India's food processing sector. The company's strong financial performance, market leadership position, and strategic expansion plans provide solid fundamentals for continued growth. Strong Q4 FY25 results with 50.38% PBT growth and 15.02% revenue growth demonstrate operational excellence and market demand strength.
Catalyst Timeline
Near-term (3-6 months): Q1 FY26 results and capacity utilization updates
Medium-term (6-12 months): Specialty coffee segment scaling and Vietnam facility ramp-up
Long-term (12-24 months): Achievement of 100,000 MT capacity target
Risk-Reward Assessment
Upside Potential: 14.1% to target price
Risk Level: Moderate to High (commodity exposure)
Investment Horizon: Medium to long-term (12-18 months)
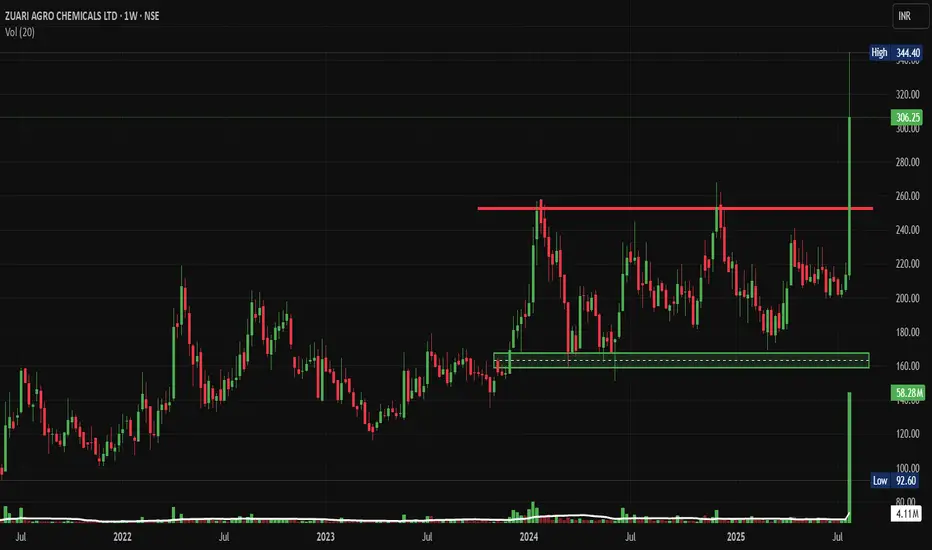
ZUARI: Stunning Breakout: A Deep Technical Analysis in the ChartNSE:ZUARI Stunning Breakout: A Deep Technical Analysis in the Chart of the Week
As per SEBI Mandate, this isn't a Trading/Investment RECOMMENDATION nor for Educational Purposes, it's just for Informational purposes
Disclaimer: "I am not a SEBI REGISTERED RESEARCH ANALYST AND INVESTMENT ADVISER."
This analysis is intended solely for informational purposes and should not be interpreted as financial advice. It is advisable to consult a qualified financial advisor or conduct thorough research before making investment decisions.
Price Action Analysis:
- The stock has shown a remarkable multi-year uptrend spanning from 2021 to 2025
- Price has rallied from lows around ₹90 in 2021 to current levels near ₹306, representing a gain of over 240%
- The stock is currently trading at ₹306.25 with recent highs touching ₹344.40
- Volume surge is evident in recent sessions with 58.28M shares traded, indicating strong institutional participation
Volume Analysis:
- Exceptional volume spike during breakout phases indicates institutional buying
- Volume-price correlation is positive during upward moves
- Recent volume of 58.28M vs average suggests strong momentum continuation
- Distribution patterns absent, indicating healthy accumulation
Chart Patterns and Structure:
Base Formation:
- A strong accumulation base was formed between 2021-2022 in the ₹90-180 range
- This 18-month consolidation phase created a solid foundation for the subsequent bull run
- The base shows characteristics of a cup-and-handle pattern with gradual accumulation
Support and Resistance Levels:
- Major Support Levels: ₹160-170 (dotted green rectangle area), ₹210-220
- Immediate Support: ₹280-290 range
- Key Resistance: ₹344.40 (recent high marked by red horizontal line)
- Next Resistance: ₹360-380 zone if breakout sustains
Technical Patterns:
- Multi-year ascending triangle formation with higher lows and consistent resistance around ₹250-260 levels
- Recent breakout above ₹260 resistance with strong volume confirmation
- Flag and pennant patterns visible during consolidation phases
- Currently in a potential flag formation after the recent surge
Fundamental and Sectoral Backdrop:
Company Overview:
- NSE:ZUARI is an India-based fertilizer manufacturing company engaged in the manufacturing, trading, and marketing of chemical fertilizers and fertilizer products
- The company manufactures and markets Single Super Phosphate (SSP) through its brand Jai Kisaan with a market cap of ₹1,288 Cr
- The company has delivered a poor sales growth of 8% over the past five years, with a low return on equity of 8% over the last 3 years
Sectoral Dynamics:
- India's FY 2025-26 budget allocates ₹1.84 trillion for fertilizer subsidies, with ₹1.19 trillion for urea and ₹0.49 trillion for P&K fertilizers
- The India Fertilizer Market size was valued at $40.5 billion in 2023 and is expected to reach INR 1,401.0 Billion by 2033, exhibiting a growth rate (CAGR) of 4-6.1%
- India's fertilizer sector in 2025 is a blend of strategic imports, domestic policy innovation, and scientific transformation with precision farming initiatives and sustainability experiments
Key Rationale:
- Government support through substantial subsidy allocation provides sector stability
- Growing agricultural focus and food security concerns drive long-term demand
- Technical breakout coincides with favourable sectoral tailwinds
- Undervaluation based on intrinsic value models suggests upside potential
- Strong historical returns demonstrate the company's ability to generate wealth
Risk Factors:
- Poor fundamental metrics with low sales growth and ROE
- High dependence on government policies and subsidy changes
- Commodity price volatility affecting margins
- Environmental regulations pushing toward organic alternatives
- Working capital-intensive business model
My Take:
NSE:ZUARI presents a compelling technical setup with a multi-year breakout backed by strong sector fundamentals. The stock's impressive 240%+ rally from base levels, combined with government support for the fertilizer sector, creates an attractive risk-reward proposition. However, one should be mindful of the company's weak operational metrics and maintain disciplined risk management. The current setup favours trend continuation with measured targets, making it suitable for both swing and positional traders with appropriate position sizing.
Full Coverage on my Newsletter this Week
Keep in the Watchlist and DOYR.
NO RECO. For Buy/Sell.
📌Thank you for exploring my idea! I hope you found it valuable.
🙏FOLLOW for more
👍BOOST if you found it useful.
✍️COMMENT below with your views.
Meanwhile, check out my other stock ideas on the right side until this trade is activated. I would love your feedback.
As per SEBI Mandate, this isn't a Trading/Investment RECOMMENDATION nor for Educational Purposes, it's just for Informational purposes
Disclaimer: "I am not a SEBI REGISTERED RESEARCH ANALYST AND INVESTMENT ADVISER."
This analysis is intended solely for informational purposes and should not be interpreted as financial advice. It is advisable to consult a qualified financial advisor or conduct thorough research before making investment decisions.
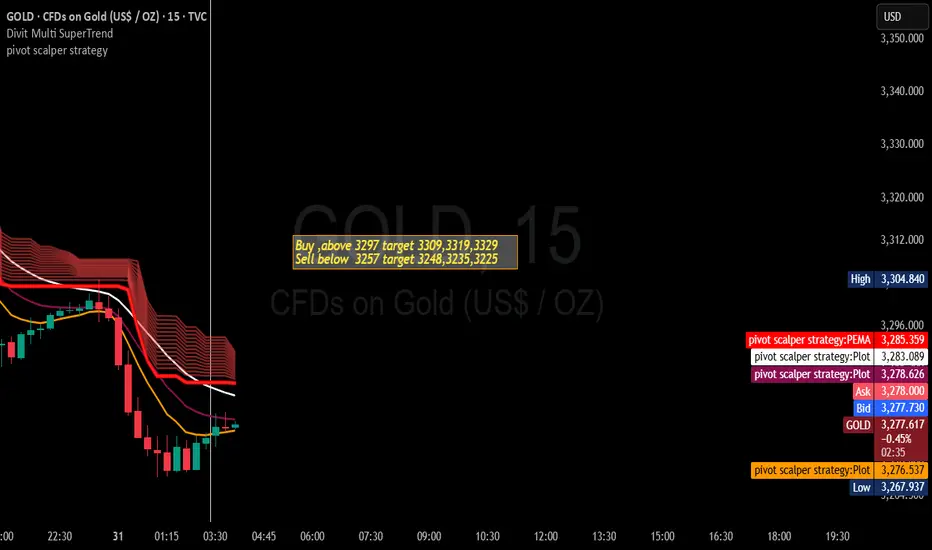
Gold Trading Strategy for 31st July 2025📊 GOLD TRADING IDEA
💰 Buy Setup:
Entry: Buy above the High of the 15-min candle (Close above $3297)
Targets: 🎯 $3309 | $3319 | $3329
Stop Loss: Below the breakout candle low
📉 Sell Setup:
Entry: Sell below the Low of the 15-min candle (Close below $3257)
Targets: 🎯 $3248 | $3235 | $3225
Stop Loss: Above the breakdown candle high
⚡ Trading Tips:
Confirm 15-min candle close before entering.
Follow the trend; avoid trading in sideways markets.
Risk management: Do not risk more than 1–2% of your capital.
Trail profits as the trade moves in your favor.
⚠️ Disclaimer:
This is only for educational purposes and not financial advice.
Commodity trading is highly risky. Trade at your own risk.
#PAYTMPrice Action:
Strong green candle for July 2025 showing an 18.42% gain, closing at ₹1,094.20, signaling a bullish breakout above the previous resistance near ₹998. Price is moving toward its next psychological hurdle at ₹1,200.
CCI (Commodity Channel Index):
Daily CCI: +172.02 – Strong Bullish Momentum
Weekly CCI: +178.19 – Very Bullish
Monthly CCI: +146.97 – Overbought Zone (>100)
CCI Interpretation:
Momentum is extremely strong across all timeframes. With Monthly CCI > +100, the stock is in a classic bullish momentum continuation phase. Traders may ride the trend, but investors should watch for overbought signals or exhaustion above ₹1,100–₹1,200 zones.

#NIFTYPrice Action:
Nifty has formed a bearish engulfing candle in July 2025, showing strong selling from the highs of ~25,600+. Price is currently near ₹24,680, well below the monthly high, hinting at rejection near the 26,277 resistance level.
CCI (Commodity Channel Index):
Daily CCI: -132.21 (Bearish – Oversold territory)
Weekly CCI: +83.68 (Neutral-Bullish – Still above 0)
Monthly CCI: +96.62 (Approaching Overbought limit at +100)
Interpretation:
The CCI score shows that short-term momentum has turned negative,
even though medium/long-term indicators are still positive.
A bearish divergence may be forming if price fails to reclaim 25,000+
levels. If CCI drops below +100 on the monthly, it can
signal a medium-term correction brewing.

Adani Port Bearish View Price Support Is 999Here is a **detailed overview of Adani Ports and Special Economic Zone Ltd (APSEZ)'s business model**:
---
## 🔷 **Adani Ports and SEZ Ltd – Business Model Overview**
### 🏢 **Company Overview**
* **Name:** Adani Ports and Special Economic Zone Ltd (APSEZ)
* **Founded:** 1998
* **Headquarters:** Ahmedabad, Gujarat, India
* **Chairman:** Gautam Adani
* **Industry:** Port Infrastructure & Logistics
* **Stock Listing:** NSE: ADANIPORTS | BSE: 532921 | Nifty 50 Constituent
* **Parent Group:** Adani Group
---
## ⚙️ **Core Business Activities**
### 1. 🛳️ **Port Operations (Major Revenue Generator)**
* Manages and operates multiple ports and terminals across India
* Handles cargo such as coal, containers, crude oil, fertilizers, LNG, and agri-products
* Offers port-related services: cargo handling, storage, dredging, logistics
### 2. 🏗️ **Logistics Services**
* End-to-end integrated logistics:
* Rail and road connectivity
* Warehousing & storage
* Container trains (operates India's largest private rail network)
* Inland Container Depots (ICDs) and logistics parks across India
### 3. 🌐 **Special Economic Zones (SEZs) & Industrial Parks**
* Mundra SEZ: India's first port-based multi-product SEZ
* Offers facilities to manufacturers and exporters
* Helps attract investments and drives long-term revenue from leasing and services
### 4. 🚢 **Marine Services**
* Tugging, pilotage, mooring, marine security
* Dredging and port development services
---
## 🌍 **Geographical Footprint**
### 🔹 **India’s Largest Port Developer & Operator**
* Ports at:
* Mundra (flagship), Hazira, Dahej (Gujarat)
* Dhamra (Odisha), Krishnapatnam & Gangavaram (Andhra Pradesh)
* Kattupalli & Ennore (Tamil Nadu), Vizhinjam (Kerala, under development)
* Tuna Tekra (recent development)
### 🔹 **International Ventures**
* Port in Haifa, Israel (acquired in 2023)
* Eyes expansion in Sri Lanka, Africa, and Southeast Asia
---
## 💰 **Revenue Model**
* **Port Charges:** Vessel handling, cargo handling, berth hire
* **Logistics Fees:** Freight, warehousing, ICD services
* **Lease Income:** SEZ land lease, industrial park rentals
* **Marine Services:** Tug hire, dredging, pilotage charges
* **Other Income:** Port consulting, rail infrastructure usage fees
---
## 🔑 **Business Strategy**
### 1. **“Ports to Hinterland” Approach**
* Create a seamless supply chain from port to customer doorstep
* Combine ports, rail, warehousing, and SEZs into an integrated ecosystem
### 2. **Diversified Cargo Base**
* Coal, crude oil, containers, fertilizer, LNG, agri, cement
* Ensures resilience against commodity-specific downturns
### 3. **Aggressive Expansion & Acquisitions**
* Acquired Dhamra, Krishnapatnam, Gangavaram ports
* International acquisitions for global footprint
* Vizhinjam Port (Kerala) and Colombo Port (Sri Lanka) under development
### 4. **Technology-Driven Efficiency**
* Automated cranes, digital port operations, GPS-tracked logistics
* Focus on ESG (environmental, social, governance) compliance
---
## 📈 **Recent Financial Snapshot (FY24)**
*(Approximate values)*
* **Revenue:** ₹25,000+ Cr
* **EBITDA Margin:** 65–70% (industry-leading)
* **Cargo Handled:** 420+ million metric tonnes (MMT)
* **Market Share in India:** \~24% of total cargo volume
---
## 🧾 **Customer Base**
* Power producers (coal & LNG importers)
* Oil refineries and fertilizer companies
* Container shipping lines
* Manufacturing exporters/importers
* SEZ tenants and industrial units
---
## 📊 SWOT Analysis
| Strengths | Weaknesses |
| -------------------------------- | -------------------------------- |
| Largest private port operator | High capital-intensive business |
| Pan-India port presence | Regulatory and political risks |
| Vertical integration (logistics) | Debt levels from rapid expansion |
| Diverse cargo mix | Dependence on coal cargo (\~30%) |
| Opportunities | Threats |
| -------------------------------- | --------------------------------- |
| International port expansion | Environmental clearances delays |
| Port automation and digitization | Competition from global operators |
| Inland logistics & warehousing | Economic slowdowns affect cargo |
---
## 📌 Summary Highlights:
* **India’s largest and most diversified port & logistics operator**
* **Strategic long-term model combining port + logistics + SEZ**
* **Focus on global expansion and end-to-end value chain control**
* **High-margin business with recurring income from long-term port contracts**
---
Thanks

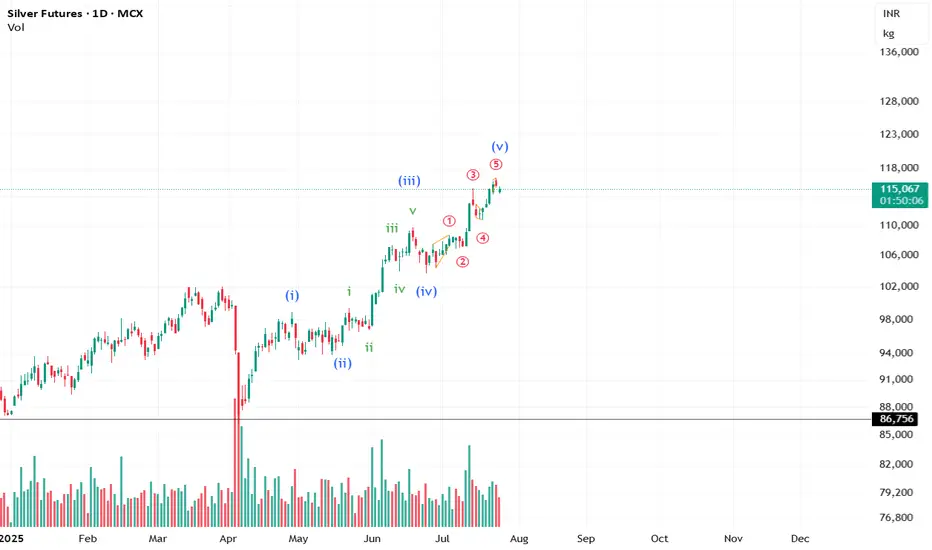
Is the move over for Silver? #CommodityIt looks like the impulse for Silver is about to end. However, we still need the price action to confirm the view.
**This analysis is based on the Elliott Wave Principle.
This analysis is for educational purposes only and not investment advice.
Please consult your SEBI-registered advisor before making any investment decisions. Markets are subject to risk.**
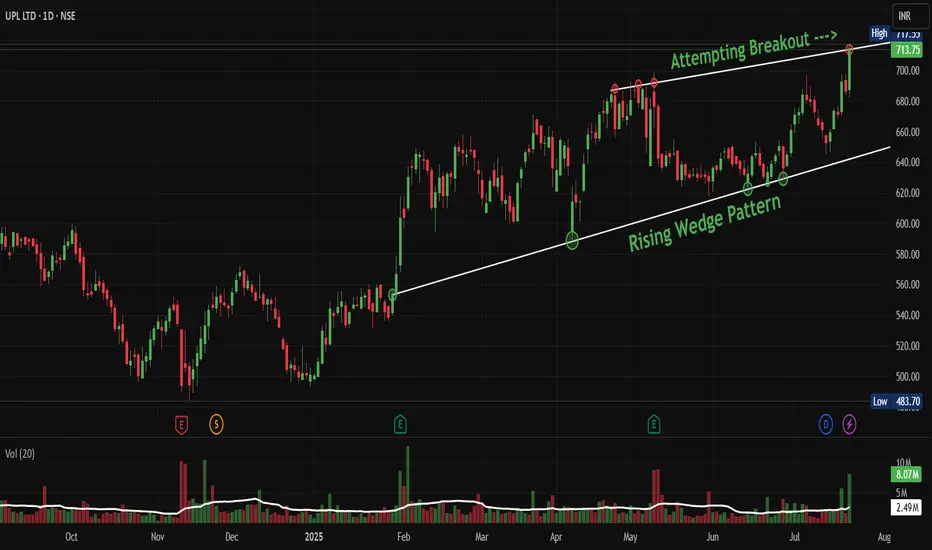
UPL: Rising Wedge Breakout Could Signal Fresh HighsNSE:UPL : Rising Wedge Breakout Could Signal Fresh Highs, But Manage Risk Carefully
Price Action Analysis:
- Current Price: ₹713.75 (+3.92%)
- 52-Week High: ₹717.55
- 52-Week Low: ₹483.70
- The stock is trading near all-time highs with strong momentum
Volume Spread Analysis
- Volume spikes are visible during key breakout points
- Recent volume of 8.07M is above average, confirming breakout attempt
- Volume pattern shows selling pressure during declines and buying interest on rallies
- The volume surge in July suggests institutional participation
Chart Pattern:
Rising Wedge Pattern:
- A classic rising wedge pattern has formed from February 2025 to July 2025
- The pattern shows converging trendlines with higher highs and higher lows
- Volume has been decreasing during the formation, which is typical for rising wedges
- The stock is attempting a breakout from the upper trendline resistance
Key Technical Levels:
Support Levels:
- Immediate Support: ₹680 (recent consolidation zone)
- Strong Support: ₹640 (rising trendline support)
- Major Support: ₹580 (previous resistance turned support)
Resistance Levels:
- Immediate Resistance: ₹720 (psychological level)
- Next Resistance: ₹750 (projected target based on wedge height)
- Extended Target: ₹800 (measured move from base)
Base Formation Analysis:
- The stock formed a solid base between ₹480-₹550 from October 2024 to January 2025
- This accumulation phase lasted approximately 4 months
- Strong buying emerged from the ₹500 level multiple times
- The breakout from this base began in February 2025
Trade Setup:
Entry Strategy:
- Aggressive Entry: ₹714-₹716 (current levels on confirmed breakout)
- Conservative Entry: ₹695-₹700 (on any pullback to support)
- Accumulation Entry: ₹680-₹685 (if stock retraces to wedge support)
Target Levels:
- Target 1: ₹750 (immediate target - 5% upside)
- Target 2: ₹780 (medium-term target - 9% upside)
- Target 3: ₹820 (extended target - 15% upside)
Stop Loss Levels:
- For Aggressive Entry: ₹675 (5.5% risk)
- For Conservative Entry: ₹665 (5% risk)
- For Accumulation Entry: ₹655 (4% risk)
Position Sizing Guidelines:
- Risk per trade: 2% of portfolio maximum
- For ₹100,000 portfolio with ₹714 entry and ₹675 stop: 51 shares maximum
- Adjust position size based on individual risk tolerance
Risk Management Framework:
Trade Management Rules:
- Book 30% profits at Target 1
- Trail stop loss to breakeven after Target 1 is hit
- Book another 40% profits at Target 2
- Let the remaining 30% run with a trailing stop
Risk Factors to Monitor:
- Rising wedge patterns have a 60% failure rate historically
- Global agrochemical sector volatility
- Monsoon dependency for Indian agriculture
- Currency fluctuation impact on exports
Sectoral and Fundamental Backdrop:
Company Overview:
- NSE:UPL provides crop protection solutions, manufacturing and marketing agrochemicals, industrial chemicals, and speciality chemicals
- Global provider with annual revenue exceeding $5 billion, ranking among the top 5 agriculture solutions companies worldwide
Financial Performance:
- Market Cap: ₹58,088 Crore (up 37.1% in 1 year), Revenue: ₹46,637 Cr, Profit: ₹820 Cr
- Revenues grew 8.21% last year.
- The company has delivered a poor sales growth of 5.46% over the past five years
Recent Performance Metrics:
- Year-to-date increase of 29.48%, significantly outperforming the Sensex's 4.44% gain
- Delivered a robust return of 37.1% over the past year, compared to the Sensex's 12.13%
Credit Rating and Outlook:
- Fitch has revised its Long-Term Issuer Default Rating outlook on UPL Corp from 'Negative' to 'Stable', affirming the IDR at 'BB'
Sectoral Outlook:
- The company focuses on reducing environmental impact while enhancing soil health and water conservation through sustainable agriculture
- UPL ranked No. 1 globally in the agrochemical sector by Sustainalytics
- Growing focus on biological solutions and sustainable farming practices
Recent Corporate Actions:
- UPL's subsidiary to acquire 100% of Wuhan Advanta Seeds for USD 4,200 by Sept 2025
- Strategic partnership with Indian Potash Limited to revolutionise sugarcane farming in India
Investment/Trading Thesis:
Positive Factors:
- Strong technical breakout from the rising wedge pattern on cards
- Outperforming the broader market significantly
- Leading position in the global agrochemical sector
- Strategic acquisitions and partnerships
- Improved credit rating outlook
Risk Considerations:
- The company has a low interest coverage ratio
- Historical slow sales growth over 5 years
- Monsoon and weather dependency
- Rising wedge patterns can be bearish reversal signals
- Global commodity price volatility
My Take:
NSE:UPL presents a compelling technical setup with fundamental tailwinds from the agricultural sector. The rising wedge breakout, if sustained, could lead to significant upside. However, traders should maintain strict risk management given the pattern's inherent risks and the company's mixed fundamental metrics.
Keep in the Watchlist and DOYR.
NO RECO. For Buy/Sell.
📌Thank you for exploring my idea! I hope you found it valuable.
🙏FOLLOW for more
👍BOOST if you found it useful.
✍️COMMENT below with your views.
Meanwhile, check out my other stock ideas on the right side until this trade is activated. I would love your feedback.
Disclaimer: "I am not a SEBI REGISTERED RESEARCH ANALYST AND INVESTMENT ADVISER."
This analysis is intended solely for informational and educational purposes and should not be interpreted as financial advice. It is advisable to consult a qualified financial advisor or conduct thorough research before making investment decisions.
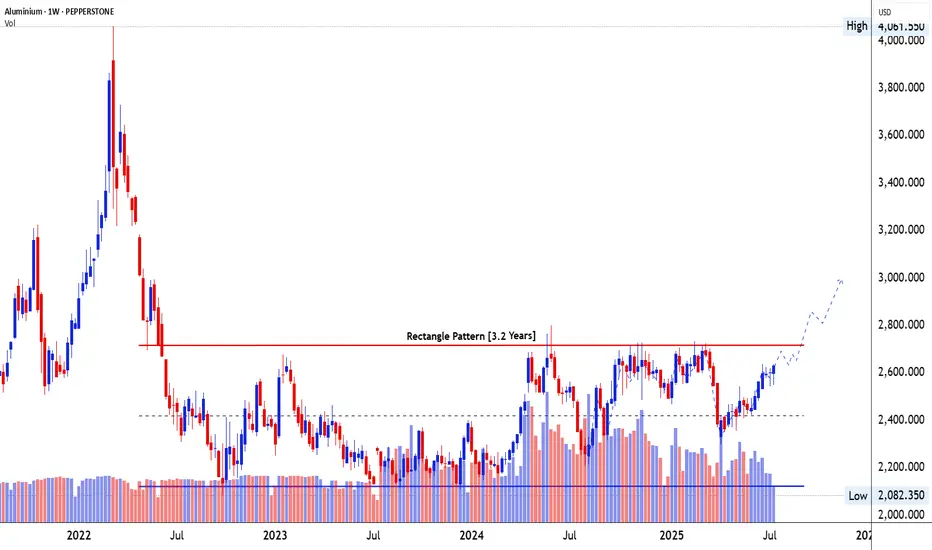
Big Breakout Soon in Commodity Chart similar to Silver Chart- 🚀 ALUMINIUM - $2631
Date: 18-07-2025
Price: $2,631.05
Volume: 37.12K
1⃣ Pattern Structure & Breakout Development 📈
📐 Pattern Identification: A Rectangle Pattern has been forming over 3.2 years, acting as a large-scale accumulation base. This is a continuation pattern typically seen in commodities post major corrections, where price builds energy for the next directional leg.
⏳ Time Taken in Formation: Over 166 weeks (~3.2 years), price has remained within a defined range. This extended time reflects long-term accumulation and the absorption of supply by institutional players. Such long bases often precede explosive breakouts.
📊 Price Trend Before the Pattern: The trend leading into the rectangle was a sharp downtrend from 2022 highs. The drop was vertical, indicating panic or macro stress, followed by multi-year stabilization inside the rectangle.
📦 Price Movement Inside the Pattern: The range has been defined by $2,080 on the lower side and $2,710 on the upper side. Inside this range, the price has respected support and resistance with multiple bounces, forming higher lows since early 2024, hinting at underlying strength and diminishing seller strength.
🚀 Breakout Zone & Behavior: The resistance level at $2,710 is a multi-tested zone, tested over 5–6 times. This increases its significance. Current price is approaching this zone with momentum, and a breakout above it would activate the 3.2-year base, unleashing a possible long-term trend.
2⃣ Volume Behavior & Breakout Validity 🔍
📉 Volume During the Pattern: Volume was consistently high during the early phase of the rectangle, especially near the bottoming area, suggesting accumulation. It gradually tapered off during consolidation — classic sign of supply exhaustion.
📈 Volume Before the Breakout: Recent price candles show expanding volume near higher lows and bullish follow-through candles. This reflects smart money buildup before the expected breakout.
💥 Volume on Breakout Candle: The breakout is not yet confirmed, but once $2,710 is taken out on weekly closing basis, we expect a clear volume spike, validating the breakout.
🔮 Volume After Breakout – What to Expect: Post-breakout, volume must remain above average to sustain momentum. Low volume on breakout would increase false breakout risk. Watch for weekly candle closes above $2,710 with volume expansion for confirmation.
3⃣ Candlestick Dynamics & Trap Awareness 🕯️
🔥 Candles Formed Before Breakout: Recent weekly candles include strong bullish engulfing and hammer candles, especially near the $2,400–2,450 zone. These are reliable reversal signals when formed after higher lows.
💎 Breakout Candle Characteristics (Expected): Ideally, we want a large-bodied bullish candle, closing decisively above $2,710, with minimal upper wick and expanding volume.
⚠️ Impact of the Breakout Candle: A clean breakout with follow-through would invalidate the rectangle resistance and invite fresh breakout buyers. But a failed breakout or long upper wick near $2,710 without volume may lead to a bull trap — especially if price falls back below $2,600.
4⃣ Trade Setup – Entry, Exit & Risk Strategy 🛍️
🛡️ Safe Entry: Wait for weekly close above $2,710, then enter on retest near $2,700–2,720, confirmed by a bullish reversal candle.
⚡ Aggressive Entry: Enter now near $2,630–2,650, with tight SL below the recent higher low at $2,480, anticipating the breakout.
🎯 Target Zones:
Target 1: $3,000 – round number and psychological barrier
Target 2: $3,400 – historical consolidation zone and pattern-measured move (rectangle height projected upward)
🚩 Stop-loss Placement:
Conservative SL: Below $2,600 (minor swing)
Structure-based SL: Below recent higher low – $2,480
5⃣ SEBI Disclosure – Educational Purpose Only 📜
“This report is for educational purposes only and does not offer investment advice. Mr. Chartist (Rohit Singh) is a SEBI Registered Research Analyst under the Investology (INH000012376). Please consult a SEBI-registered advisor before taking any investment decisions. All investments carry risk. Past performance is not a guarantee of future results.”
#Trading #Investing #Stocks #TechnicalAnalysis
A strong upside momentum Silver is the commodity to be in
Goutham Shah of Goldilocks
Many on CNBC TV18
YouTube legends like Mile Maloney

EUR/USD Slides as Trade Tensions WeighThe EUR/USD pair extended its steady decline on Thursday, approaching the weekly lows as global financial markets remained under pressure from aggressive U.S. tariff announcements. The U.S. President unveiled new tariffs on copper — a key industrial commodity — and signalled upcoming restrictions on the pharmaceutical sector.
A mix of inflation concerns, supply chain disruptions, and continued strength in the U.S. dollar has put the euro under visible pressure. From a technical standpoint, EUR/USD remains in a downward correction phase after pulling back from multi-year highs, with bearish momentum holding firm.
Unless a surprise emerges from economic data or monetary policy shifts, the short-term bias is likely to remain tilted to the downside.

Gold price recovers 3310, accumulates MondayPlan XAU day: 30 June 2025
Related Information:!!!
Gold prices (XAU/USD) regained some lost ground during the early European trading hours on Monday. Increasing expectations that the US Federal Reserve (Fed) will implement additional interest rate cuts this year—and potentially sooner than previously anticipated—may weigh on the US Dollar and, in turn, provide support for the USD-denominated commodity, as a weaker dollar makes gold more affordable for foreign investors.
However, improved risk sentiment stemming from the US-China trade agreement, as well as the ceasefire reached between Israel and Iran, may reduce the appeal of gold as a traditional safe-haven asset. Market participants now turn their attention to upcoming remarks from Federal Reserve officials later on Monday, with scheduled speeches from Atlanta Fed President Raphael Bostic and Chicago Fed President Austan Goolsbee.
personal opinion:!!!
Gold price recovers to gain liquidity at the beginning of the week, using fibonacci to find potential resistance: 3310
Important price zone to consider : !!!
SELL point: 3310 zone
Sustainable trading to beat the market

Crude Oil Market Analysis: June 29, 2025 Monthly Chart~~ Crude Oil Market Analysis: June 29, 2025 ~~
As of June 29, 2025, the crude oil market reflects a complex interplay of supply, demand, geopolitical factors, and macroeconomic conditions. Below is a concise analysis based on the latest available data:
#Market Sentiment: Prices are under downward pressure due to rising global oil inventories and weaker-than-expected demand growth, despite recent volatility driven by geopolitical events.
Supply Dynamics
Global Supply: World oil supply rose by 330 kb/d in May to 105 mb/d, up 1.8 mb/d year-on-year, driven by both non-OPEC+ (e.g., U.S., Brazil, Canada) and OPEC+ producers as voluntary production cuts are gradually unwound. The IEA projects global supply to reach 104.9 mb/d in 2025 and 106 mb/d in 2026, with non-OPEC+ leading gains (1.4 mb/d in 2025, 840 kb/d in 2026).
OPEC+ Policy: OPEC+ has accelerated the unwinding of voluntary cuts, with a planned 411 kb/d increase for July 2025, though compliance issues persist (e.g., Kazakhstan, UAE, and Iraq overproducing). This contributes to a supply overhang, with global supply expected to exceed demand by 720-950 kb/d in 2025.
U.S. Production: U.S. crude oil production is forecast to average 13.4 mb/d in 2025, slightly declining to 13.3 mb/d by Q4 2026 due to fewer active drilling rigs and lower oil prices. The Permian Basin remains a key driver, contributing 46% of U.S. crude production.
#Demand Dynamics
Global Demand: Forecast to grow by 720 kb/d in 2025 to 103.8 mb/d, down from earlier estimates due to weaker deliveries in the U.S. and China during Q2 2025. Non-OECD countries, particularly China and India, drive growth (860 kb/d in 2025), while OECD demand is expected to decline by 120 kb/d.
#Geopolitical and Macro Factors
Geopolitical Tensions: Recent de-escalation signals between Iran and Israel have reduced fears of supply disruptions, leading to a 4% price drop on June 16, 2025. However, U.S. sanctions on Russia and Iran continue to pose risks, with Iranian exports potentially facing tighter enforcement.
Trade Policies: U.S. tariffs and trade tensions, particularly with China, have soured macro sentiment, impacting demand forecasts. A temporary U.S.-China tariff détente has eased some pressure, but uncertainty persists.
Economic Outlook: Faltering global growth and rising trade barriers are expected to keep commodity prices, including oil, at their lowest levels of the 2020s, potentially moderating inflation but challenging developing economies.
Technical Analysis
WTI is trading in a medium-term uptrend but recently tested support at $68.06-$68.66. Prices are approaching a target zone of $75.62-$76.14, though resistance at this level could trigger a pullback. Volatility remains high, with prices sensitive to geopolitical news and inventory data.
Brent has struggled to break above a key downtrend line, signaling caution among traders despite recent geopolitical escalations.
Trend - Sideways
Chart for your reference
- Disclaimer --
This analysis is based on recent technical data and market sentiment from web sources. It is for informational purposes only and not financial advice. Trading involves high risks, and past performance does not guarantee future results. Always conduct your own research or consult a SEBI-registered advisor before trading.
#Boost and comment will be highly appreciated

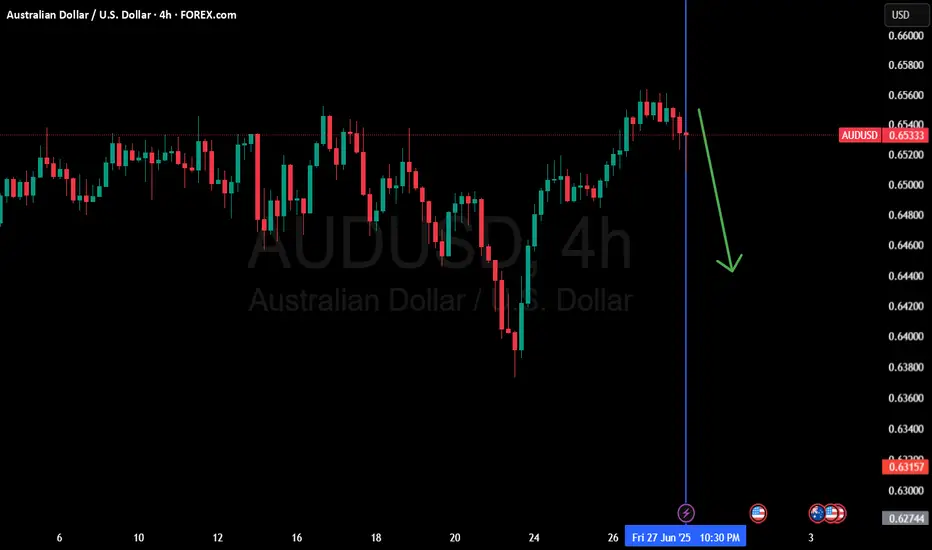
AUD USD Weekly Free Analysis (28-06-25 to 05-07-25)AUD USD
AUD/USD may begin to fall from the 0.6530 area as the US dollar strengthens in early July. The U.S. is expected to release strong economic data (like Non-Farm Payrolls on July 5), and the Federal Reserve is likely to stay hawkish, keeping interest rates high. This supports the dollar and puts pressure on AUD.
Meanwhile, Australia’s economic momentum is softening, with weaker consumer spending and mixed inflation trends. If the Reserve Bank of Australia becomes cautious or delays further hikes, it could weaken the Aussie dollar even more. Also, global risk-off mood or weak commodity demand (especially from China) could drag AUD lower.
Key Bearish Drivers:
Strong upcoming US data
Fed policy staying tight
Weakening Australian fundamentals
Global risk sentiment favors USD over AUD
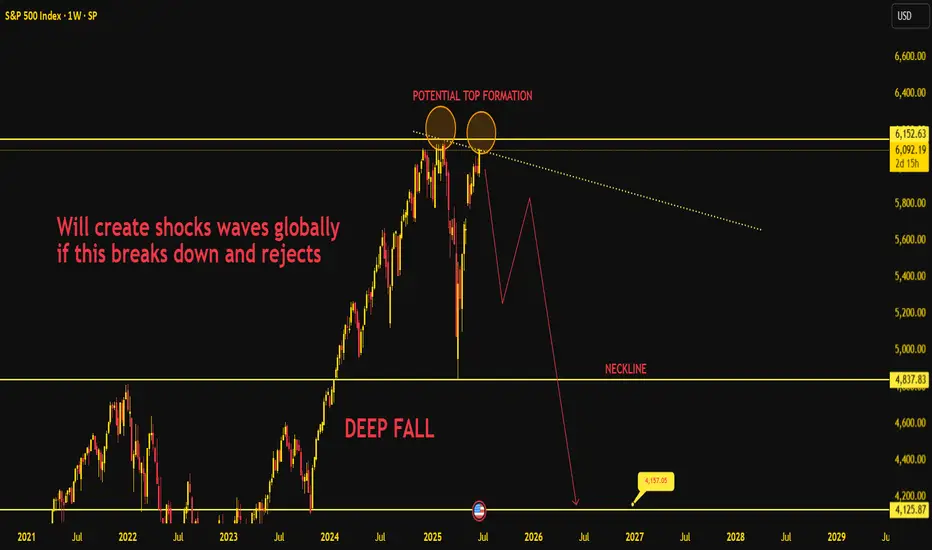
S&P 500 Weekly Macro Structure – In-Depth Breakdown as of June Current Structure & Price action -
The S&P 500 is showing early signs of forming a macro double top, one of the most powerful reversal patterns in Price action when occurring at all-time highs. The zone around 6150–6170 has now been tested twice once in March 2025 and again in June 2025. Each time, the price faced rejection, hinting at buyer exhaustion at the peak.
What makes this chart technically threatening is the alignment of:
A potential double top with weak volume on the second peak.
A visible neckline at 4837, which represents the last zone of strong institutional demand and breakout origin from the October 2023 rally.
Clear visual symmetry between left and right shoulders indicating distribution rather than accumulation.
If price decisively breaks below 4837, we enter a freefall zone, targeting the 4150–4125 range — the next significant structural shelf.
Why This Setup Matters Globally
This is not just a Price action formation; it is a systemic risk signal:
If the S&P 500 cracks, it’ll act as a domino in:
Global equity indices (FTSE, DAX, NIKKEI, NIFTY).
Emerging market outflows (especially BRICS economies).
Commodity repricing (especially metals and crude, due to deflation fear).
Dollar Strength Scenario:
If this fall happens alongside USD strength (which often occurs during flight to safety), it may also lead to:
Emerging market currency devaluation.
Debt servicing problems for dollar-denominated borrowers.
Gold volatility (initial dip, then sharp rise as panic flows in).
Intermarket Readings & Divergences
US10Y Bond Yields: If yields continue to rise while the index weakens, it’s a death cross for growth sectors.
VIX: Still below 20, but any weekly close above 25 during this formation breakdown will trigger full-blown fear cycles.
Tech Stocks: Heavily weighted in the index. If large caps like AAPL, MSFT, NVDA start to fade, this fall will accelerate.
Roadmap Projection
Here’s the expected flow based on current structure:
Fakeout Above 6150 → quick rejection → triggers wave 1 fall.
Bounce from 5500–5600 (psychological + moving average confluence).
Neckline Retest (4837) – critical. If rejected again, freefall starts.
Major demand expected only around 4150–4125, where long-term investors might re-enter.
If neckline breaks with high volume and weekly close below, we could be looking at a 25–30% retracement from the highs.
Macro Echo of Past Crashes?
This pattern closely resembles:
2007–08 double top structure before Lehman.
Dotcom bust in 2000 where euphoria blinded exit signals.
The difference now? AI and tech hype has pushed valuations to unsustainable highs, and central banks are tight, not loose.
🔸 Final Take
This is not a normal pullback. The S&P is on the verge of confirming a generational top, with implications for every asset class. Once 4837 breaks, expect:
Mass volatility in global markets
Flight to cash and gold
Repricing of risk premiums
Action Plan:
If holding longs – reduce exposure, raise stop-losses.
Hedge via VIX calls or inverse ETFs.
Watch for a weekly rejection candle at 6150 to trigger confirmation.
This chart is a time bomb. The wick is lit.
Indian Metals & Ferro Alloy: Flag & Pole BONSE:IMFA Breaks out of the Flag & Pole Pattern with Huge Volumes today.
Price Action Analysis:
- Stock experienced a significant decline from highs around 998.80 to lows near 549.80, representing approximately a 45% correction
- Recent breakout above 720 levels shows strong momentum reversal
- Current price at 772.50 (+ 7.77%) indicates bullish sentiment returning
- Higher highs and higher lows pattern emerging on the right side of the chart
Volume Spread Analysis:
- Volume spike coinciding with recent breakout confirms genuine buying interest
- Volume of 202.22K appears elevated compared to previous months
- Green volume bars during the recent rally suggest an accumulation phase
- Low volume during the consolidation phase indicates smart money positioning
Key Technical Levels:
Support Levels
- Primary Support: 720-730 (recent breakout zone)
- Secondary Support: 680-690 (previous resistance turned support)
- Major Support: 600-620 (previous consolidation zone)
Resistance Levels:
- Immediate Resistance: 800-820
- Major Resistance: 880-900
- Long-term Resistance: 950-998 (previous highs)
Base Formation:
- Cup and Handle pattern visible with base formation between 550-680 levels
- Duration of base: Approximately 4-5 months (February to June 2025)
- Handle formation in the May-June period before the breakout
- Flag & Pole Pattern Broke today
Technical Patterns Identified:
Primary Pattern: Cup and Handle
- Well-defined cup formation with rounded bottom
- Handle shows controlled pullback with lower volume
- Breakout above handle resistance confirms pattern completion
- Target projection: 950+ levels based on pattern height
Secondary Patterns:
- Descending trendline resistance tested today
- Double bottom formation around 550-580 levels
- Bullish flag formation post-breakout
Trade Setup Recommendations:
Entry Strategy:
- Aggressive Entry: Current levels 770-775 on any minor dip
- Conservative Entry: 720-730 on pullback to breakout zone
- Momentum Entry: Above 800 for trend continuation
Exit Strategy:
- Target 1: 850 (10% upside from current levels)
- Target 2: 920 (19% upside potential)
- Target 3: 980 (27% upside to retest previous highs)
Stop-Loss Levels:
- For aggressive entries: 720 (7% risk)
- For conservative entries: 680 (6% risk from 720 entry)
- Trailing stop: 8-10% below recent swing lows
Risk Management Framework:
Position Sizing:
- Risk per trade: Maximum 2% of portfolio
- Position size calculation: Portfolio value × 2% ÷ stop-loss distance
- For ₹1 lakh portfolio with 7% stop: ₹2,000 ÷ 0.07 = ₹28,571 position size
Risk Controls:
- Maximum exposure to single stock: 5% of portfolio
- Sector concentration limit: 15% in the metals sector
- Use of position sizing calculator mandatory
- Weekly portfolio review and rebalancing
Sectoral Backdrop Analysis:
Metals Sector Dynamics:
- Global steel demand recovery supporting Indian metal stocks
- Infrastructure spending by the government boosts domestic demand
- Raw material cost stabilization improves margins
- Export opportunities are increasing with global supply chain shifts
Industry Tailwinds:
- The government's focus on infrastructure development
- PLI schemes supporting the manufacturing sector
- Green energy transition requiring metal inputs
- Automotive sector recovery driving steel demand
Fundamental Considerations:
Company Specific Factors:
- Debt reduction initiatives improving balance sheet strength
- Capacity expansion plans supporting long-term growth
- Technology upgrades enhancing operational efficiency
- ESG compliance improving institutional investor interest
Macroeconomic Factors:
- Rupee stability supporting import-dependent operations
- Interest rate environment favourable for the capital-intensive sector
- Government policy support for domestic manufacturing
- Global commodity cycle showing signs of recovery
Trading Psychology Notes:
Behavioural Considerations:
- Stock showing classic accumulation after major decline
- Institutional buying is likely during the base formation period
- Retail sentiment improving with breakout confirmation
- FOMO factor may drive further momentum
Market Sentiment Indicators:
- Relative strength improving against the broader market
- Sector rotation favours cyclical stocks
- Technical breakout attracting momentum traders
- Long-term investors find value after the correction
My take:
This technical setup presents a compelling risk-reward opportunity with clearly defined entry, exit, and risk management parameters. The combination of a strong technical breakout and improving sectoral fundamentals creates a favourable environment for potential gains.
Keep in the Watchlist.
NO RECO. For Buy/Sell.
📌Thank you for exploring my idea! I hope you found it valuable.
🙏FOLLOW for more
👍BOOST if you found it useful.
✍️COMMENT below with your views.
Meanwhile, check out my other stock ideas on the right side until this trade is activated. I would love your feedback.
Disclaimer: "I am not a SEBI REGISTERED RESEARCH ANALYST AND INVESTMENT ADVISER."
This analysis is intended solely for informational and educational purposes and should not be interpreted as financial advice. It is advisable to consult a qualified financial advisor or conduct thorough research before making investment decisions.

Can NIFTY reach 26000? It's a question that requires careful thought, hitting that sweet spot between straightforward and complex.
The Indian equity market has been a story of resilience and growth, with the NIFTY 50 consistently scaling new peaks. The current buzz among investors and analysts is whether this upward trajectory can carry the benchmark index to the 26,000 mark.
While it's impossible to predict market movements with absolute certainty, a confluence of favorable factors suggests that NIFTY 26,000 is indeed a plausible, if not probable, milestone in the near to medium term.
Driving Forces Behind the Potential Rally:
S trong Economic Fundamentals : India continues to be a global bright spot, with various reports, including those from the OECD and World Bank, projecting it as the fastest-growing major economy in 2025 and 2026, with GDP growth rates estimated to be around 6.3-6.4%. This strong macroeconomic backdrop provides a fertile ground for corporate earnings growth.
Robust Corporate Earnings: Sustained earnings growth is the bedrock of any market rally. Analysts anticipate healthy earnings performance across various sectors, which will provide the fundamental validation for higher index levels. Sectors like financials, insurance, and telecom are showing resilience and are expected to contribute significantly.
Supportive Monetary Policy: The Reserve Bank of India (RBI) is expected to maintain an accommodative stance, with potential for further interest rate cuts. Lower borrowing costs can spur economic activity, boost consumption, and enhance corporate profitability, all of which are positive for the stock market.
Increasing Domestic Participation: The growing awareness and participation of Indian retail investors through Systematic Investment Plans (SIPs) have acted as a strong counter-balance to foreign institutional investor (FII) outflows. This sustained domestic liquidity provides a solid floor to the market and fuels its upward movement.
Government Initiatives and Capital Expenditure: Government focus on infrastructure development and structural reforms are expected to continue driving economic growth and creating opportunities for various industries, further boosting corporate performance.
Despite the optimistic outlook, the path to 26,000 may not be without its bumps. Global trade tensions, commodity price volatility, and any unexpected shifts in monetary policy globally could introduce short-term corrections. Furthermore, valuations, while considered reasonable by some, might still be elevated in certain segments, necessitating selective stock-picking.
In Conclusion:
The journey to NIFTY 26,000 appears to be driven by a powerful combination of India's resilient economic growth, improving corporate earnings, supportive domestic policies, and increasing investor confidence. While market volatility is an inherent part of investing, the fundamental strengths of the Indian economy make NIFTY 26,000 a very realistic and exciting prospect for investors looking at the Indian market horizon.

Silver at Strong Support Level: Ideal Buy with Targets up to 12Silver has a level that is a strong potential support. Personally, I have been waiting for a retest of this level (87580) for quite some time. It is advisable to buy at this level.
From here, potential targets appear to be 96400, 100900, 102700, 106500, 120000, and 125000.

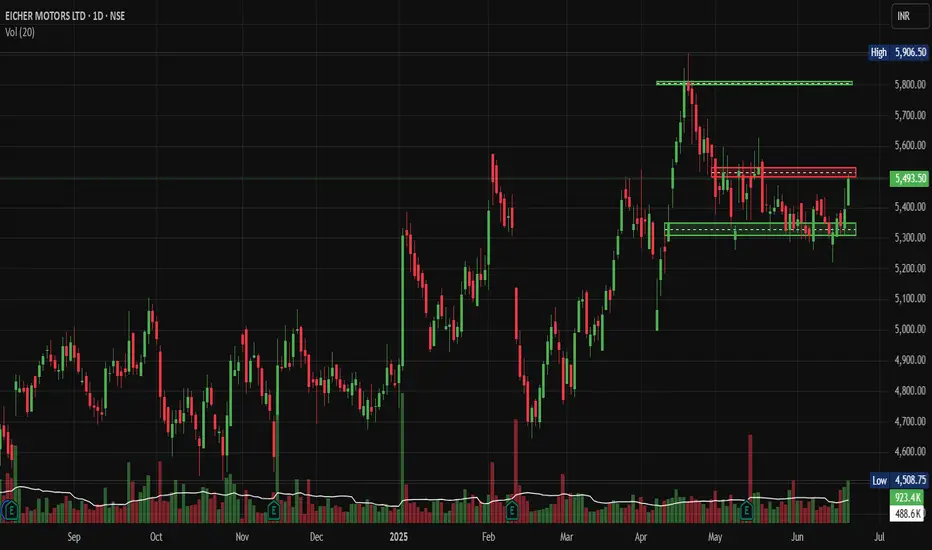
Eicher Motors: Hits Swing Highs, Signal More Upside AheadNSE:EICHERMOT Hits Swing Highs: This Technical Setup Could Signal More Upside Ahead
Price Action Analysis:
- Current Price: ₹5,493.50 (as of June 19, 2025)
- Day's Range: ₹5,410.00 - ₹5,506.50
- Price movement shows strong bullish momentum with recent breakout above resistance
- The stock has gained approximately 100.50 points (+1.86%) in the session
Volume Spread Analysis:
- Current session volume: 923.4K (89% above average)
- Average volume: 488.6K
- Volume surge during breakout phases confirms institutional buying
- Declining volume during consolidation phases shows controlled profit-taking
- Volume spike of 923.4K against average of 488.6K indicates institutional participation
- Volume has been increasing over the past 3 Days.
Volume Pattern Insights:
- Volume expansion on up moves and contraction on down moves
- Accumulation pattern visible in the base formation phase
- Recent volume spike suggests renewed buying interest
Chart Patterns:
- A clear ascending triangle pattern formed between March and May 2025
- Breakout above the ₹5,800 resistance level in April with strong volume confirmation
- Current consolidation phase between ₹5,300-₹5,500 range
- Higher lows pattern since March 2025 indicates underlying bullish sentiment
Key Technical Levels:
Support Levels:
- Immediate Support: ₹5,300 (previous resistance turned support)
- Secondary Support: ₹5,100 (20-day moving average zone)
- Major Support: ₹4,800 (previous consolidation base)
- Critical Support: ₹4,500 (long-term uptrend line)
Resistance Levels
- Immediate Resistance: ₹5,600 (short-term ceiling)
- Key Resistance: ₹5,800 (previous breakout level)
- Major Resistance: ₹5,900 (all-time high zone)
- Extended Target: ₹6,200 (measured move projection)
Base Formation
- Primary base formed between September 2024 - March 2025
- Consolidation range: ₹4,400 - ₹5,200
- Duration: 6 months (healthy accumulation phase)
- Breakout confirmation in April 2025 with volume expansion
Technical Indicators Assessment:
Momentum Indicators:
- Price trading above key moving averages
- Bullish crossover pattern maintained
- Momentum favours bulls in the short to medium term
Trend Analysis:
- Primary trend: Bullish (uptrend intact since September 2024)
- Secondary trend: Consolidation within an uptrend
- Trend strength: Strong (confirmed by volume analysis)
Trade Setup:
Long Position Strategy:
- Entry Strategy: Buy on dips approach
- Accumulation zone: ₹5,300 - ₹5,400
- Momentum entry: Above ₹5,550 with volume confirmation
- Investment horizon: 3-6 months
Entry Levels:
- Conservative Entry: ₹5,320 (near support)
- Aggressive Entry: ₹5,480 (current levels)
- Breakout Entry: ₹5,560 (above resistance)
Exit Strategy:
- Target 1: ₹5,800 (12% upside from current levels)
- Target 2: ₹6,000 (20% upside potential)
- Target 3: ₹6,200 (extended target for long-term holders)
Stop-Loss Levels:
- Conservative SL: ₹5,200 (below key support)
- Aggressive SL: ₹5,350 (tight stop for short-term trades)
- Investment SL: ₹4,800 (major support violation)
Position Sizing & Risk Management:
Position Sizing Guidelines:
- Conservative approach: 2-3% of portfolio allocation
- Moderate approach: 4-5% of portfolio allocation
- Aggressive approach: 6-8% of portfolio allocation (only for high-risk tolerance)
Risk Management Framework:
- Maximum risk per trade: 2% of total capital
- Risk-reward ratio: Minimum 1:2 preferred
- Portfolio correlation: Consider auto sector exposure
- Stop-loss discipline: Strict adherence to predetermined levels
Capital Allocation Strategy:
- Entry in tranches during the consolidation phase
- Average up strategy on breakout confirmation
- Profit booking at predetermined target levels
- Position sizing adjustment based on volatility
Sectoral Backdrop:
Automobile Sector Overview:
- The two-wheeler segment is showing a strong recovery post-COVID
- Rural demand improvement supporting premium motorcycle sales
- Electric vehicle transition creating new opportunities
- Government infrastructure spending boosts commercial vehicle demand
Industry Trends:
- The premium motorcycle segment is growing faster than the mass market
- Export opportunities expanding in international markets
- Supply chain normalisation is improving production efficiency
- Raw material cost pressures are stabilizing
Fundamental Backdrop:
Company Fundamentals:
- May 2025 sales up 26% YoY with a total of 89,429 units sold
- International sales up 82%, showing strong export growth
- Achieved a significant milestone of selling over 100,000 units in March with 33.7% YoY growth
- Fundamentals look strong and suitable for long-term investment
Market Position:
- Continues to dominate >350cc space with >85% market share
- Increased market share from 32.9% in Q4FY22 to ~36% in Q1FY23 in >125cc segment
- Market cap of ₹1,50,676 crores, appearing financially stable compared to competitors
- Average analyst price target of ₹5,426 from 21 research reports
Financial Health:
- Trailing 12-month revenue of $2.19 billion as of March 2025
- Strong balance sheet with healthy cash flows
- Consistent dividend payment track record
- Efficient capital allocation and ROE metrics
Growth Catalysts:
- New product launches, including Hunter 350, are receiving a positive response
- Market share expansion in the premium segment
- International market penetration opportunities
- Electric vehicle portfolio development
Risk Factors:
Company-Specific Risks:
- Dependence on Royal Enfield brand performance
- Raw material cost inflation impact on margins
- Competition intensification in the premium motorcycle segment
- Regulatory changes in emission norms
Market Risks:
- Economic slowdown affecting discretionary spending
- Interest rate changes may impact vehicle financing
- Commodity price volatility
- Currency fluctuation impact on exports
Technical Risks:
- Breakdown below ₹5,200 could trigger selling pressure
- Volume declining during upward moves would be concerning
- Broader market correction affecting sector sentiment
- Profit booking pressure at higher levels
My Take:
Overall Assessment:
The technical setup for NSE:EICHERMOT appears constructive, with the stock maintaining its uptrend structure. The recent consolidation phase provides an opportunity for fresh accumulation. Strong fundamentals support the technical outlook with robust sales growth and market share expansion.
Investment Recommendation
Buy on dips strategy recommended for medium to long-term investors. The risk-reward profile remains favourable with multiple technical targets achievable. However, strict stop-loss discipline and position sizing are crucial for risk management.
Time Horizon:
- Short-term (1-3 months): Consolidation with upward bias
- Medium-term (3-6 months): Bullish with a target of ₹6,000
- Long-term (6-12 months): Positive outlook with potential for new highs
The combination of strong fundamentals, healthy technical setup, and favourable sector dynamics makes NSE:EICHERMOT an attractive investment proposition for quality-focused portfolios.
Keep in the Watchlist.
NO RECO. For Buy/Sell.
📌Thank you for exploring my idea! I hope you found it valuable.
🙏FOLLOW for more
👍BOOST if you found it useful.
✍️COMMENT below with your views.
Meanwhile, check out my other stock ideas on the right side until this trade is activated. I would love your feedback.
Disclaimer: "I am not a SEBI REGISTERED RESEARCH ANALYST AND INVESTMENT ADVISER."
This analysis is intended solely for informational and educational purposes and should not be interpreted as financial advice. It is advisable to consult a qualified financial advisor or conduct thorough research before making investment decisions.
GOLD GEARS UP FOR THE NEXT MOVE? All Eyes on Middle East & FedXAUUSD – GOLD GEARS UP FOR THE NEXT MOVE? All Eyes on Middle East & Fed
🌐 MACRO VIEW – WHAT'S MOVING GOLD?
🔺 Fed stays on hold, but Powell remains hawkish – His recent speech signals that inflation may persist due to ongoing geopolitical risks and rising commodity costs...
🔥 Middle East tensions could be the game-changer for gold prices:
If the US steps in as a mediator to de-escalate tensions between Israel and Iran, gold could see a deeper correction toward the 3,357–3,345 support zone, possibly lower...
On the other hand, Trump’s reported alignment with Israel and possible airstrikes on Iran would likely send gold soaring back to 3,417–3,440 levels, acting as a safe haven trigger.
📉 TECHNICAL SETUP (M30)
Gold is moving inside a descending channel, compressing within key EMAs (13–34–89–200).
A potential inverse head & shoulders pattern is forming at the bottom, signaling possible bullish breakout if confirmed.
Support remains firm around 3,345–3,357, while price struggles to break above the upper trendline.
✅ TRADING PLAN
🔵 BUY ZONE: 3,345 – 3,357
Entry: Look for bullish rejection and confirmation
SL: Below 3,342
TP: 3,373 → 3,384 → 3,403 → 3,417 → 3,440
🔴 SELL ZONE: 3,417 – 3,440
Entry: Wait for rejection and bearish confirmation near resistance
SL: Above 3,445
TP: 3,403 → 3,384 → 3,373 → 3,357
💬 FINAL THOUGHTS FOR INDIAN TRADERS
Even though the broader trend remains bullish, gold is not yet ready for a breakout – consolidation continues. Smart traders should stay patient, watch for clean setups, and manage risk well. Keep an eye on political developments, especially involving Iran, Israel, and the US, as they could trigger sharp moves in gold.
Trade smart. Let the market come to you.
