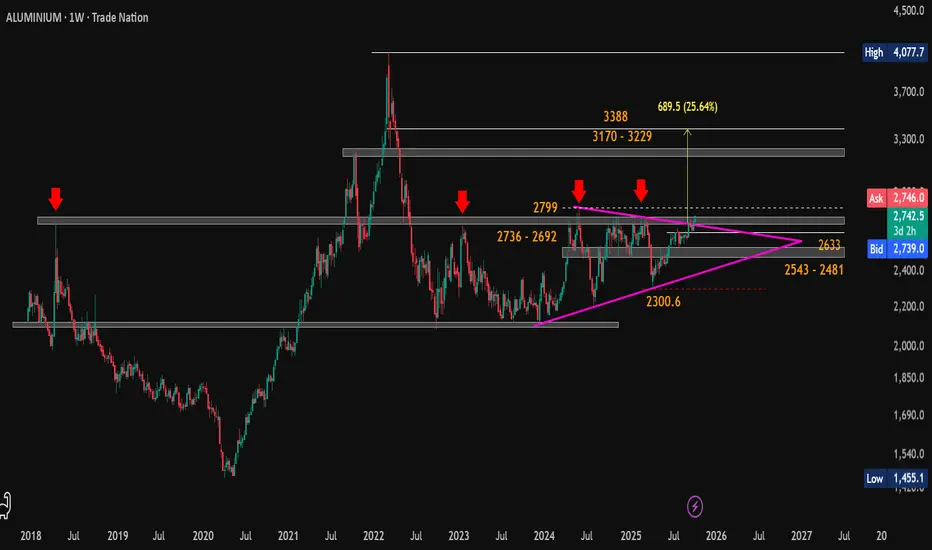
Triangle Breakout Alert: Aluminium Bulls Waking Up?CMP: $2743
Aluminium is breaking out of a symmetrical triangle on weekly timeframe after months of consolidation.
📍 Breakout Zone: $2736 – $2799
📉 Support Levels: $2633 / $2543 – $2481
📈 Resistance Zones: $3170 – $3229, then $3388
🎯 Symmetrical Triangle Pattern Target: ~$3378 (+23% from CMP), which aligns closely with the major resistance zone between $3229 – $3388 .
A weekly close above $2736 – $2799 could support further upside momentum.
If price pulls back within the triangle , dips toward the support zone around $2633 - $2481 may be worth watching for possible reactions.
👀 Watch for price action in the coming weeks, could confirm or invalidate the breakout.
#Commodities | #Aluminium | #BaseMetals | #Breakout | #ChartPattern | #SymmetricalTriangle | #TechnicalAnalysis | #PriceAction
📌 Disclaimer: This analysis is shared for educational purposes only. It is not a buy/sell recommendation. Please do your own research before making any trading decisions.
Search in ideas for "COMMODITY"
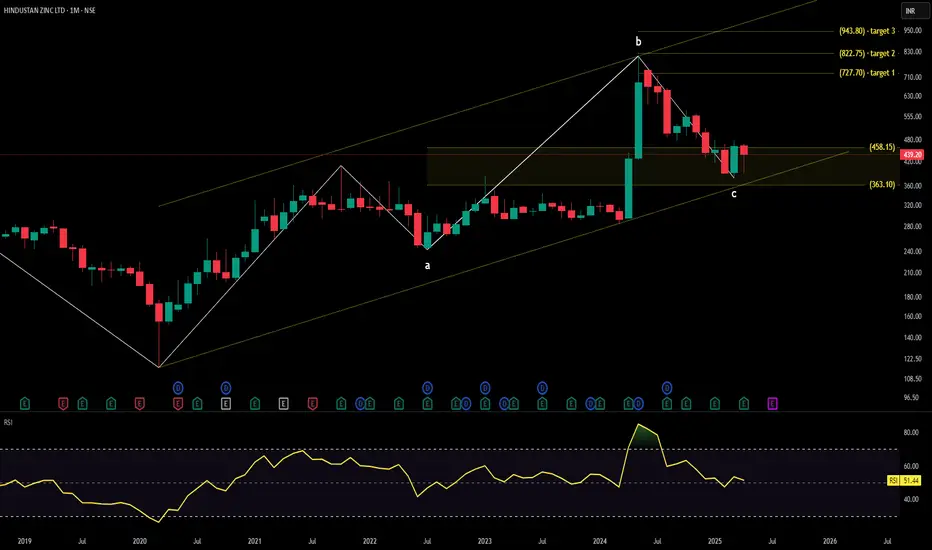
HINDUSTAN ZINC technical analysisHindustan Zinc Ltd. (NSE: HINDZINC) is currently trading at INR 439.20. The company is a leading producer of zinc, lead, and silver in India and operates as a subsidiary of Vedanta Limited.
Key Levels:
Support Level: INR 368 - 458
Swing Level: INR 542
Possible Upside Levels: INR 727.70, INR 822.75, INR 943.80
Technical Indicators:
RSI (Relative Strength Index): The RSI is currently at 51.44, indicating a neutral position. RSI is a momentum oscillator that measures the speed and change of price movements.
Volume: The volume for the current period is 38.99 million. Volume represents the number of shares traded in a given period. High volume can indicate strong investor interest and potential price movement, while low volume can suggest a lack of interest and possible price stagnation.
Sector and Market Context:
Hindustan Zinc Ltd. operates in the metals and mining sector, which has been experiencing volatility due to fluctuating commodity prices and global economic conditions. The overall market trend has been influenced by factors such as inflation, interest rate changes, and geopolitical events. Within its sector, Hindustan Zinc Ltd. has demonstrated resilience due to its strong market position and diversified product portfolio.
Risk Considerations:
Commodity Price Fluctuations: The prices of zinc, lead, and silver can be highly volatile, impacting the company's revenue and profitability.
Regulatory Changes: Environmental regulations and mining policies can affect the company's operations and costs.
Global Economic Conditions: Economic slowdowns or recessions can reduce demand for industrial metals, negatively impacting the company's performance.
Currency Exchange Rates: As an exporter, the company is exposed to currency exchange rate fluctuations, which can affect its earnings.
Analysis Summary:
Hindustan Zinc Ltd. has shown stable performance. The RSI indicates a neutral position, suggesting that the stock is neither overbought nor oversold. The volume suggests moderate investor interest. While the company is well-positioned in the metals and mining sector, potential risks such as commodity price fluctuations and regulatory changes should be considered. Investors should monitor these factors closely and evaluate the overall market context before making investment decisions.
Mahindra & Mahindra Ltd. (M&M) Stock Analysis### **Mahindra & Mahindra Ltd. (M&M) Stock Analysis**
---
#### **Fundamental Analysis:**
- **Company Overview:**
Mahindra & Mahindra Ltd. (M&M) is one of India's largest and most diversified conglomerates, with a strong presence in various industries including automotive, agriculture, aerospace, construction, energy, and finance. M&M is particularly well-known for its leadership in the Indian automotive market, especially in the segments of SUVs, tractors, and electric vehicles. The company’s focus is on innovation, sustainability, and providing solutions for rural and urban India.
- **Revenue & Profit Growth:**
- **Revenue Trends:** M&M has experienced steady revenue growth in recent years, driven by strong sales in its automotive and agricultural segments. The company's robust growth in its tractor and SUV divisions has helped offset slower growth in other sectors.
- **Profitability:** The company has been improving its profitability, with significant growth in operating profit margins due to operational efficiencies and strong demand for its vehicles, especially in rural India. The company has managed to report consistent growth in net profits, aided by its cost control measures and diversified revenue streams.
- **Valuation (as of Feb 2025):**
- **P/E Ratio:** 18.6 (this is relatively attractive for a company with a diversified business model and a leadership position in several key sectors)
- **Price-to-Book Ratio:** 2.2 (reflects a fair valuation based on the company's tangible assets, and market leadership in key segments)
- **Dividend Yield:** 1.5% (M&M has a stable dividend payout policy, though the dividend yield is on the lower side given its growth potential)
- **Key Ratios:**
- **Return on Equity (ROE):** 15.3% (a good indication of efficient use of shareholder capital)
- **Return on Assets (ROA):** 7.4% (reflecting solid asset management)
- **Debt-to-Equity Ratio:** 0.4 (low leverage, indicating a conservative approach to debt, which reduces financial risk)
- **Outlook:**
M&M is positioned well in the automotive sector with its strong portfolio in tractors, SUVs, and electric vehicles. The growing demand for EVs, especially in India, gives M&M a distinct advantage with its focus on sustainable mobility. The company is also expanding into new international markets. The agriculture and financial services sectors also offer significant growth potential. The company's diversified revenue base mitigates risks in any one sector, making it relatively stable.
---
#### **Technical Analysis:**
- **Current Price:** ₹1,500 (as of February 2025)
- **Chart Overview:**
M&M's stock has shown consistent growth over the last year, supported by strong fundamentals and increasing demand for its SUV and tractor models. The stock has seen a recent pullback, but the overall trend remains positive, as the company has been a leader in the SUV and tractor segments.
- **Support and Resistance Levels:**
- **Immediate Support:** ₹1,470 (a critical support level where the stock has bounced in recent times)
- **Next Major Support:** ₹1,400 (providing a strong cushion in case of a broader market correction)
- **Immediate Resistance:** ₹1,530 (recent highs, which could act as a barrier to further gains)
- **Next Major Resistance:** ₹1,600 (a psychological level, and also the previous all-time high)
- **Moving Averages:**
- **50-Day Moving Average (50-DMA):** ₹1,480 (indicating a neutral short-term trend)
- **200-Day Moving Average (200-DMA):** ₹1,400 (providing strong support, which aligns with the broader uptrend)
- **Relative Strength Index (RSI):**
- RSI is currently at 58, which indicates that the stock is neither overbought nor oversold, suggesting that there is still room for potential upside or further consolidation.
- **MACD:**
- The MACD is showing a bullish crossover, suggesting that positive momentum could continue. However, any significant rise in the stock could lead to an overbought condition, so it is important to watch for a potential correction.
---
#### **Key Metrics:**
- **Market Capitalization:** ₹2.2 trillion (approx.)
- **52-Week High:** ₹1,620
- **52-Week Low:** ₹1,100
---
#### **Risk Considerations:**
- **Commodity Price Fluctuations:** M&M is exposed to fluctuations in the prices of raw materials such as steel and aluminum, which are crucial for automotive manufacturing. A rise in these costs could impact profit margins.
- **Regulatory Risks:** Changes in government policies related to electric vehicles, agriculture, or taxes could impact M&M’s business. The shift towards EVs also comes with regulatory challenges, especially related to battery technology and charging infrastructure.
- **Competition:** The automotive sector is highly competitive, with both domestic and international players vying for market share. M&M faces significant competition in both the SUV and EV segments, and any aggressive moves by competitors could impact market share and profitability.
- **Geopolitical Risks:** M&M operates in various international markets, including the US, Europe, and several African countries. Geopolitical tensions, trade barriers, or economic slowdowns in these regions could negatively impact business performance.
---
### **Conclusion:**
Mahindra & Mahindra Ltd. (M&M) is a strong and diversified player in the Indian and global markets, with solid growth potential in both its automotive and agricultural divisions. The company's leadership in the tractor and SUV segments, combined with a strong focus on electric vehicles, positions it well for future growth. The stock has performed well, and its fundamental metrics are solid, with a low debt-to-equity ratio and strong profitability.
Technically, M&M is trading near key support levels around ₹1,470, with resistance around ₹1,530. A breakout above ₹1,530 could signal further upside potential. The stock has been consolidating in the short term, and while the RSI is not yet in overbought territory, investors should be mindful of potential risks, including commodity price fluctuations, regulatory changes, and competition in the automotive sector.
For long-term investors, M&M presents a solid opportunity, especially as the demand for electric vehicles and rural-focused solutions like tractors continue to grow. However, short-term volatility due to broader market movements and commodity price risks should be considered.
---
**Disclaimer:** This analysis is based on publicly available information, and I am not a SEBI-registered advisor. Please conduct your own research and consult a certified financial advisor before making any investment decisions. This is for informational purposes only and should not be considered as financial advice.

Intraday to BTST trade opportunity in natural gas, it should flyHello, everyone, i have brought an intraday to postional trade in natural gas, i am expecting it should take support in this area, probability is very high that it should take supprot in this area, Today's day low can be our intraday support and the stop loss which i mention below to that is gonna to be a postional stop loss. Targets already mention on chart.
Disclaimer:- This analysis is for educational purposes only. Please trade responsibly and consult a financial advisor before making any decisions.
If you found this analysis helpful, don’t forget to like, follow, and share your thoughts in the comments below! Your support keeps me motivated to share more insights. Let’s grow and learn together—happy trading!

MCX - Breakout Setup, Move is ON...#MCX trading above Resistance of 6457
Next Resistance is at 7809
Support is at 5105
Here are previous charts:
Chart is self explanatory. Levels of breakout, possible up-moves (where stock may find resistances) and support (close below which, setup will be invalidated) are clearly defined.
Disclaimer: This is for demonstration and educational purpose only. This is not buying or selling recommendations. I am not SEBI registered. Please consult your financial advisor before taking any trade.

MCX - Breakout Setup, Move is ON..#MCX trading above Resistance of 5182
Next Resistance is at 6457
Support is at 3980
Here are previous charts:
Chart is self explanatory. Levels of breakout, possible up-moves (where stock may find resistances) and support (close below which, setup will be invalidated) are clearly defined.
Disclaimer: This is for demonstration and educational purpose only. This is not buying or selling recommendations. I am not SEBI registered. Please consult your financial advisor before taking any trade.

Silver (XAGUSD) Weekly Technical Chart Analysis 09-13 Sept., 24📈 Silver (XAGUSD) Weekly Technical Chart Analysis
📅 Date: 09-13 Sept., 2024
📊 Range Trigger Point: 27.92
📉 Weekly Range: 1.49
🟢 Buy Above: 28.60
💼 Average Position: 28.42
🎯 Buy Target 1: 28.84
🎯 Buy Target 2: 29.41
🔵 Stoploss: 28.10
🔴 Sell Below: 28.25
🎯 Sell Target 1: 27.00
🎯 Sell Target 2: 26.43
🔵 Stoploss: 28.75
✨ Boost, follow, and engage for more detailed insights. Your support helps us bring you the latest and most accurate updates! 🚀❤️
#Silver #XAGUSD #CommodityMarket #TradingSignals #TradingTips #TechnicalAnalysis #SilverTrading

NG (XNGUSD) Weekly Technical Chart Analysis 09-13 Sept., 24📈 NG (XNGUSD) Weekly Technical Chart Analysis
📅 Date: 09-13 Sept., 2024
📊 Range Trigger Point: 2.45
📉 Weekly Range: 0.25
🟢 Buy Above: 2.37
💼 Average Position: 2.34
🎯 Buy Target 1: 2.61
🎯 Buy Target 2: 2.70
🔵 Stoploss: 2.29
🔴 Sell Below: 2.31
🎯 Sell Target 1: 2.30
🎯 Sell Target 2: 2.20
🔵 Stoploss: 2.39
✨ Boost, follow, and engage for more detailed insights. Your support helps us bring you the latest and most accurate updates! 🚀❤️
#NaturalGas #XNGUSD #CommodityMarket #TradingSignals #TradingTips #TechnicalAnalysis #NG

Gold (XAUUSD) Weekly Technical Chart Analysis 09-13 Sept., 24📈 Gold (XAUUSD) Weekly Technical Chart Analysis
📅 Date: 09-13 Sept., 2024
📊 Range Trigger Point: 2497.57
📉 Weekly Range: 57.38
🟢 Buy Above: 2507.38
💼 Average Position: 2500.61
🎯 Buy Target 1: 2533.03
🎯 Buy Target 2: 2554.95
🔵 Stoploss: 2488.25
🔴 Sell Below: 2493.84
🎯 Sell Target 1: 2462.10
🎯 Sell Target 2: 2440.18
🔵 Stoploss: 2512.97
✨ Boost, follow, and engage for more detailed insights. Your support helps us bring you the latest and most accurate updates! 🚀❤️
#Gold #GoldTrading #XAUUSD #CommodityMarket #TradingSignals #TradingTips #TechnicalAnalysis

WTI Crude (XTIUSD) Weekly Technical Chart Analysis 09-13 Sept., 📈 WTI Crude (XTIUSD) Weekly Technical Chart Analysis
📅 Date: 09-13 Sept., 2024
📊 Range Trigger Point: 67.54
📉 Weekly Range: 7.16
🟢 Buy Above: 71.12
💼 Average Position: 70.28
🎯 Buy Target 1: 71.96
🎯 Buy Target 2: 74.70
🔵 Stoploss: 68.73
🔴 Sell Below: 69.44
🎯 Sell Target 1: 63.12
🎯 Sell Target 2: 60.38
🔵 Stoploss: 71.83
✨ Boost, follow, and engage for more detailed insights. Your support helps us bring you the latest and most accurate updates! 🚀❤️
#WTICrude #CrudeOil #OilTrading #CommodityMarket #TradingSignals #TradingTips #TechnicalAnalysis

CRUDEOIL Levels // 45 Min Support and ResistanceHello Everyone 👋
# On TradingView, the levels for Crude Oil include:
Support: 7180-7160, 7120, 7000 (Solid support, even in OI data)
Resistance: 7250-7275, 7300, 7400.
For MCX Crude Oil, the intraday analysis suggests:
Support: Calculated using commodityquant’s advance pivot point formula
Resistance: Valid only for today’s session on a 5-15 minute chart

"In a world of uncertainties, gold remains a timeless anchor"After facing rejection four times at the @2080 price level over a span of 1302 days, there's a compelling possibility of a breakout. Each rejection indicates a significant resistance point, but the frequency of attempts suggests growing pressure for a potential breakout.

Silver Future Weekly Analysis for 12 to 16 Feb., 2024SILVER 06 MAR FUT ANALYSIS
Weekly Range: 1300
Buy Setup:
Entry: 70683.4
🎯 Target 1: 71577.4
🎯 Target 2: 72074
➕ Avg. Position: 70530
🛑 Buyer SL: 70250.07
Sell Setup:
Entry: 70376.6
🎯 Target 1: 69970.6
🎯 Target 2: 69474
🛑 Seller SL: 70809.93
Analysis:
Silver futures for March 06 show a promising setup this week. The buy entry is set at 70683.4 with a target of 71577.4 and an extended target of 72074. On the flip side, the sell entry is positioned at 70376.6 with targets set at 69970.6 and 69474. Traders are advised to maintain an average position of 70530 and use stop losses of 70250.07 for buyers and 70809.93 for sellers to manage risk effectively. With a weekly range of 1300 points, volatility can offer ample opportunities for profit.
#SilverTrading #PreciousMetals #SilverInvesting #CommodityMarket #SilverFutures #TradingSignals #BullionMarket #SilverAnalysis #MarketWatch #SilverPrices

Silver MCX Future Analysis for today 3 Feb., 2024Market Update: SILVER Futures for March 06 present an intriguing opportunity!
📊 SILVER 06 MAR FUT ANALYSIS : 📅 Day Range: 1659 Points
🚀 Buy at: 71780.26
🎯 Target 1: 72233.26
🎯 Target 2: 72867
➕ Add one lot at: 71584.5
🛑 Buyer SL: 71338.74
📉 Sell at: 71388.74
🎯 Target 1: 70182.74
🎯 Target 2: 69549
🛑 Seller SL: 71830.26
📈 Analysis: SILVER shows a bullish trend, providing buying opportunities with potential targets at 72233.26 and 72867. Adding a lot at 71584.5 could enhance gains. However, traders should be cautious, as a drop below 71338.74 may trigger a sell-off with targets at 70182.74 and 69549. Set your positions wisely!
#SilverAnalysis #MarchFutures #BuySellLevels #TradingStrategy #PreciousMetals #CommodityMarket #FuturesTrading #SilverPriceForecast #MarketOutlook #ProfitableTrading

Natural Gas MCX Future Analysis for Today 1 Feb., 2024
🔥 NATURAL GAS 27 FEB FUT LEVELS 📊 - Trading Alert! 🚀
📅 Day Range - 9.3 Points
📈 Buy at 176.75
🎯 Target 1 - 182.95
🎯 Target 2 - 186.5
💡 Add one lot at 175.65
🛑 Buyer SL - 173.05
📉 Sell at 174.55
🎯 Target 1 - 171.45
🎯 Target 2 - 167.9
💡 Add one lot at 178.25
🛑 Seller SL - 178.25
Trade smart and good luck! 📊💼 #NaturalGas #GasTrading #CommodityMarket #EnergyPrices #TradingAlert #MarketWatch #FuturesTrading #InvestmentTips #DayTrading #FinancialMarkets - Stay informed and stay profitable! 💹🔍 #MarketAnalysis #TradingStrategies #FinancialFreedom

Crude Oil MCX Future for Today 01 Feb, 2024🛢️ CRUDE OIL 17 FEB FUT LEVELS 📊 - Trade Alert! 🚀
📅 Day Range - 172 Points
📈 Buy at 6396.3
🎯 Target 1 - 6419.3
🎯 Target 2 - 6485
💡 Add one lot at 6376
🛑 Buyer SL - 6345.7
📉 Sell at 6355.7
🎯 Target 1 - 6206.7
🎯 Target 2 - 6141
💡 Add one lot at 6406.3
🛑 Seller SL - 6406.3
Trade wisely and good luck! 📈💹 #CrudeOil #TradingAlert #MarketWatch #FinancialFreedom #CrudeOil #OilTrading #CommodityMarket #EnergyPrices #CrudeOilAnalysis #MarketPredictions #FuturesTrading #InvestmentTips #DayTrading #FinancialMarkets

Crude Oil MCX Future Analysis for Today 24 Jan, 2024Crude Oil MCX 17 FEB Future Intraday Analysis for 24 Jan., 2024 for Future and Option Traders.
Day Range: 147 Points 📊
Buy Scenario:
Buy at: 6208.85
Average at: 6191.5
Target 1: 6268.85 🚀
Target 2: 6325 🎯
❌ Buyer Stoploss: 6164.15 ⛔
Sell Scenario:
Sell at: 6174.15
Target 1: 6087.15 🎯
Target 2: 6031 🔽
❌ Seller Stoploss: 6218.85 ⛔
#CrudeOil #OilTrading #CommodityMarkets #FuturesTrading #OptionsTrading #EnergyMarkets #TradingStrategies #TechnicalAnalysis #RiskManagement #MarketAnalysis #DayTrading #TradingSignals #FinancialMarkets #Investing #MarketVolatility #Derivatives #TraderTalk #TradingCommunity #MarketOutlook #PriceAction

Silver Mega MCX Future Weekly Analysis for 22-26 Jan, 2024🔥 SILVER - 06 MAR MCX FUTURES WEEKLY ANALYSIS 22-26 JAN., 2024
📊 Weekly Range: 1694
📈 Buy at: 72194.89
🎯 Buy Target 1: 72506.89
🎯 Buy Target 2: 73154
🔍 Add one lot at: 71995
❌ Buyer Stoploss: 71630.22
📉 Sell at: 71795.11
🎯 Sell Target 1: 70413.11
🎯 Sell Target 2: 69766
❌ Seller Stoploss: 72359.78
Trade Strategy:
The buy levels provide potential upside targets, with an additional lot to enhance gains.
Manage risk with the specified buyer stoploss.
The sell levels present opportunities on the downside, with defined targets and stoploss.
Remember, successful trading involves strategic decision-making and risk management. Stay informed, stay sharp! 🚀📊💹
#SILVER #CommodityAnalysis #TradingView #TechnicalAnalysis #MarketInsights #FinancialMarkets

Silver MCX Future Analysis for Today 19 Jan'24.📊 SILVER 06 MAR FUT LEVELS
📊 Day Range: 510 Point
📈 Buy at 71463.18
🎯 Target 1: 71930.18
🎯 Target 2: 72125
🔍 Add one lot at 71403
❌ Buyer SL: 71292.82
📉 Sell at 71342.82
🎯 Target 1: 71299.82
🎯 Target 2: 71105
❌ Seller SL: 71513.18
Resiprocate your love while following, sharing and commenting. Trade with trends to turn green!
"📊 Analyzing the potential moves in Silver MCX Future for today, 19 Jan '24! Stay informed and make strategic decisions. 🚀💹 #SilverMCX #CommodityAnalysis #TradingView #MarketForecast #TradingSignals #PreciousMetals #MCXFutures #TechnicalAnalysis #MarketOutlook #SilverTrading"

Crude Oil Future Analysis - 29.11.2023 (For Options)📈 Intraday Levels by Trading Marcos 📊
🛢️ Instrument: Crude Oil MCX Future
📅 Contract Month: December Future
📆 Intraday Levels for 29.11.2023
📉 Day Range: 194.00 Points
🎯 Range Trigger Point: 6413.00
📈 Buy Levels:
Buy At: 6358
Add Position: 6335
🎯 Buy Targets: 6533, 6607
⚠️ Standard SL: 6328
⚠️ Preferred SL: 6302
📉 Sale Levels:
Sale At: 6312
🎯 Sale Targets: 6293, 6219
⚠️ Standard SL: 6342
⚠️ Preferred SL: 6368
📣 Disclaimer: Trading involves risk. These levels are for informational purposes only and not financial advice. Always trade responsibly and consider risk management.
📈 Follow @TradingMarcos for daily levels and instrument insights.
💹 #CrudeOil #IntradayTrading #CrudeOilFutures #CrudeOilOptions
#OptionsTrading #CommodityOptions #EnergyDerivatives #CrudeTradingOptions

US Oil - Update
For the sake of simplicity and understanding of each one of us, on the monthly chart of the commodity, I have drawn just two parallel lines in white and green between 75 and 76.88. The stock; though commodity is trading below 200 SMA yet showed its bullishness in the last week and traded from 72 to almost 77 and now trading back above 76. In terms of INR 6400 is a Gann Number and if the stock starts trading above this, nothing to worry at all.
It seems gaining its monthly level again and turning bullish again.
Commodity is in oversold zone as per William's %R.
Today's time candles are 11-24-23 4:25 AM
11-24-23 8:51 AM
11-24-23 1:17 PM
11-24-23 5:43 PM
11-24-23 10:08 PM
Out of these, the pivotal candle is 11-24-23 8:51 AM. Buy, above high of this and sell below.
Please set your tradingview account to time of UTC+5:30.
Disclaimer: I am not a Registered Analyst with any National/International Regulatory Agency. Please consult your financial advisor before making any decision. I will not be responsible for any of your profits/losses. This is only for educational purposes.
Let you grow. May! I follow you.

Silver Future Prediction - 22.11.2023 - Trading Marcos📈 Intraday Levels Update - Silver Future - 22.11.2023 📉
📊 Levels By Trading Marcos
🏅 Instrument: Silver MCX Future
📅 Contract Month: December Future
📈 Intraday Levels for 22.11.2023:
📉 Day Range: 1110.00 Points
🎯 Trigger Point: 73304.00
📈 Buy At: 73289
🔄 Add Position: 73158
🎯 Buy Target 1: 73990
🎯 Buy Target 2: 74414
🛑 Standard SL: 73239
🛑 Preferred SL: 73017
📉 Sale At: 73027
🎯 Sale Target 1: 72618
🎯 Sale Target 2: 72194
🛑 Standard SL: 73077
🛑 Preferred SL: 73299
🚨 Disclaimer: For educational purposes only. Take paper trades to practice. Trade responsibly.
📲 Join my Instant Messenger channels for daily updates! Let's learn and grow together. 🌐 #SilverTrading #IntradayLevels #TradingMarcos #MCXFuture #CommodityMarket #LearnAndEarn #TradingEducation

Gold Future Prediction - 22.11.2023 - Trading Marcos 📈 Intraday Levels Update - Gold Future - 22.11.2023 📉
📊 Levels By Trading Marcos
🏅 Instrument: Gold MCX Future
📅 Contract Month: December Future
📈 Intraday Levels for 22.11.2023:
📉 Day Range: 555.00 Points
🎯 Trigger Point: 61225.00
📈 Buy At: 61148
🔄 Add Position: 61083
🎯 Buy Target 1: 61568
🎯 Buy Target 2: 61780
🛑 Standard SL: 61098
🛑 Preferred SL: 61007
📉 Sale At: 61017
🎯 Sale Target 1: 60882
🎯 Sale Target 2: 60670
🛑 Standard SL: 60967
🛑 Preferred SL: 61158
🚨 Disclaimer: For educational purposes only. Take paper trades to practice. Trade responsibly.
📲 Join my Instant Messenger channels for daily updates! Let's learn and grow together. 🌐 #GoldTrading #IntradayLevels #TradingMarcos #MCXFuture #CommodityMarket #LearnAndEarn #TradingEducation
