AVAX/USDT Is super Potential as per chart analysis CRYPTOCAP:AVAX Ready for $270 in Bull Run?
1⃣ #AVAX Forming Bull Flag in HTF
2⃣ Breaking out Flag resistance
3⃣ As per Bull Flag Pattern target will be $269
4⃣ For Bull Zone Weekly Candle must hold above $32
5⃣ If 1,2,3 Fractals works then AVAX/USDT will be Super Bullish
6⃣ #Avalanche is a layer-1 blockchain
#cryptomarket
Search in ideas for "CRYPTO"

ETH/BTC Chart Overview in monthlyETH/BTC Ascending Triangle Chart Analysis
1️⃣ Forming Strong Ascending Tringle in Monthly Chart
2️⃣ Price holding Strong Support at 0.045 BTC Level
3️⃣ Not Expecting Much Move but Expect Max will hit 0.150 BTC
4️⃣ If hit ETH = 0.150 BTC then CRYPTOCAP:ETH
Price will be FWB:12K -$15k
5️⃣ Supper Bullish Spot Ethereum ETF News in Q2

PEPEcoin now 1000% up from our Entry Level.. cheers#PEPE 1000% Profit Update:
1⃣ Finally, I booked My Profit from CRYPTOCAP:PEPE Coin.
2⃣ My Entry was $0.000000710 on Oct 2023
3⃣ Today I Sold all PEPE at $0.0000079 price
4⃣ My Investment was $9000
5⃣ My Total Realized Profit is $92,380 ( Almost 10x )
6⃣ My PEPE Holding Period is only 5 Months
7⃣ Still 700% up from My Initial PEPE Entry Setup
8⃣ My Honest View = Now is Not Good time to Fresh entry into PepeCoin
Hope you also enjoyed my Long-term GEM analysis.
Thank you for your Trust and love with the CryptoPatel Family.
NFA

BITCOIN 2025 ROADMAP for BULL RUN#BITCOIN SUPER BULLISH ROADMAP
1⃣ CRYPTOCAP:BTC Forming Inverse H&S ( IMO )
2⃣ Strong NECK LINE Resistance at $69,000
3⃣ If Rejected from NECK LINE Resistance then We can see Right Shoulder in Play
4⃣ If Right Sholder play then Buying Range will be $35000-$30,000 = Strong Support
5⃣ If #BTCUSDT Play Inverse H&S Pattern Then Target for Bull Market will be $2,50,000
Like and Share if you Want Bitcoin at $250k

ADA/USDT 1500% Potental as per Fractal AnalysisCRYPTOCAP:ADA Super bullish 1500% Potential Analysis
1⃣ Congrats #ADA up 70% from our Initial Entry
2⃣ Long Term I am Expecting $5-$10
3⃣ Best Entry: $0.4-$0.5 (Less chances but Placed bid)
4⃣ As per Fractal #Cardano is $15 Potential
5⃣ Big Red Box = Accumulation Zone
6⃣ Strong Support = $0.40 Level
NFA & DYOR

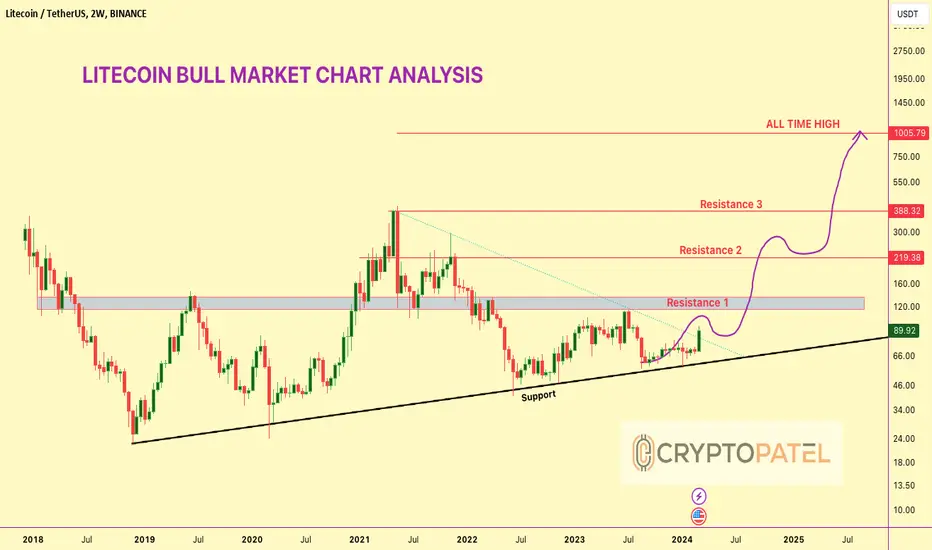
LITECOIN BULL MARKET CHART ANALYSIS#LITECOIN BULL MARKET CHART ANALYSIS
1⃣ CRYPTOCAP:LTC Stong Bounced From Support $60 Level
2⃣ Next Major Resistance is $115-$120 Level
3⃣ Bull Market Targets: $219/$388/$500/$700/$1000
4⃣ Entry: Buying Dip is good Opportunities
5⃣ Profit: Almost 50% Up from Our Last #LTC Setup
6⃣ Long Term: I am Super Bullish in the Long Run
RT/Like if you agree with my setup.
Thank you
#Cryptocurrencies #Altcoins
ETH/USDT did 30% in few days#ETHEREUM Did an awesome Return as per my chart analysis.
➡️ Entry was filled at $2300 after breakout.
➡️Now hit our both Targets.
TP1: $2636 ✅
TP2: $3000 ✅
Hope you enjoyed it.
Remember to take profits friends - discipline pays.
CRYPTOCAP:ETH #ETH

HBAR/USDT 180% up from our Entry and Still 10x Potential #HBAR Ready for $1 in Bull Market?
1000% Potential as per Chart.
CRYPTOCAP:HBAR is currently 180% up from our entry and the most important thing we bought at the actual Bottom.
Our Entry was: $0.037 ✅
You booked a huge Opportunity to buy at Dips in the Green Box ✅
New Re-Entry Zone: $0.07-$0.08 ( If Price dump )
Targets:-
TP1: $0.083 ✅ ( 180% up )
TP2: $0.17
TP3: $0.25
TP4: $0.5
Long Term Target: $1
Still Potential 1000% gains in this bull run from our Re-entry zone.
Supports: $0.07
If you are happy with my analysis please Rt/Like
#cryptocurrency

Bitcoin Inverted H&S pattern so Target will be $49000#Bitcoin LTF Inverted H&S Pattern:
Forming Inverted H&S Pattern in LFT so I am Expecting Target$49,000 & Strong Support at $43000
CRYPTOCAP:BTC Must hold $43000 level to go to $49,000 Target.

ADA/USDT 1500% Potential in Next bull MArketCRYPTOCAP:ADA Super Bullish 1500% Potential Analysis:
#CARDANO Entered in Bull Zone as per Fractals.
I'm Expecting $4-$5 Potential in Next Bull Run.
Best Accumulation zone: $0.30-$0.40
Targets: $1.2/$2.95/$5.8
Please Like/Comments if you agree

Bitcoin Inverted Head & Shoulder Pattern #Bitcoin Inverse H&S Spotted
▪️ CRYPTOCAP:BTC Inverted H&S potential building
▪️ Clear breakout level to watch
▪️ Attractive upside targets if triggered
▪️ No confirmation yet, so caution is still advised
While traders are buzzing about a potential inverted head and shoulders forming on the BTC charts, caution is still warranted until we get CONFIRMATION.
The breakout point to watch is $43,700 - only a decisive 4 Hour CLOSE above that level would trigger the bullish pattern targeting:
▫️ 1st Target: $47,090
▫️ 2nd Target: $49,225
CRUCIAL: Below the neckline at $43700 Bitcoin remains Bearish territory.
Disciplined traders will await a confirmed breakout before getting too bullish here!
Patience pays with chart patterns.

Bitcoin Bearish Divergence Target $30,000 ?#Bitcoin Bearish Divergence Into Play
CRYPTOCAP:BTC showing concerning signs, but I remain long-term bullish despite short-term uncertainties.
Bearish divergence + RSI below resistance could spur pullback if $44k fails.
If so, watch $43.5k-$44k level.
Lose that and we may see $30k
But hold> $44k = rally to $51k.
Weigh scenarios carefully friends.
➡️ Bearish divergence forming
➡️ RSI struggling below resistance
➡️ $44k Critical Resistance
➡️ Below that could hit $30k
➡️ But over $44k keeps $51k+

Bitcoin Bearish Divergence -15% down form our Entry#Bitcoin Bearish Divergence Alert: Ready for $31000 ?
- CRYPTOCAP:BTC Down 15% since our last alert.
- Today $41000 Strong Support Broken so I am Expecting the Next Target would be $35500 and $29800
Are you Ready for #buythedip ?

Bitcoin LTF Bullish BreakoutCRYPTOCAP:BTC
What will you do after #BTCUSDT breakout in LTF?
As a Trader, I am Enter in Long Position with 2% Stop Loss.

VITE printing higher targetsVITE showing upcoming Bullish perseverance and could go easily gain by using Weekly Support. Above this Support it will remain on bullish path, below this support it will be bearish . Targets are mapped via red lines ...always buy in parts for max profit.. ..Always trade with stop loss and OCO ...do your research ..Like and Comment our ideas..Trade Safe Play Safe:))

Major Cycle in Crypto Market (Attention Hedge Funds)Cycle-1: Bitcoin’s First Major Boom–Bust Structure (2013–2015)
(Screenshot-1 Breakdown)
Understanding Bitcoin’s historical behaviour is essential for forecasting macro-cycles in the crypto market. This post is the first of a 4-part series, where each screenshot highlights a repeating structural pattern in BTC’s long-term market psychology. After all four cycles are explained, I will present the combined Buy, Sell or Hold conclusion for long-term investors and institutional desks.
🟦 Cycle-1 Overview (April 2013 – January 2015)
In the first major structural cycle of Bitcoin, a very clear macro behaviour emerged — a pattern that continues to repeat across all future cycles.
🔵 Step 1 — ATH (A) Formed (April 2013)
Bitcoin printed a strong All-Time High (A) in April 2013, marking the top of its first major momentum wave.
🟢 Step 2 — Breakout Above ATH (A) → New ATH (B) (Nov 2013)
Once BTC broke above Point A, it entered an aggressive parabolic rally, setting a new ATH (B) in November 2013.
This breakout phase triggered:
FOMO-driven retail participation
Sharp acceleration in volatility
Rapid expansion in price multiples
🔴 Step 3 — Post-Breakout Collapse: -75% to -80% Drawdown
After forming ATH (B), Bitcoin failed to sustain the parabolic breakout.
A deep correction followed:
–75% to –80% decline
Capitulation phase
Panic selling and liquidity contraction
This phase marks the beginning of the macro mean-reversion cycle, a consistent signature in BTC’s long-term structure.
🟣 Step 4 — Price Returns to Previous ATH (A)
The most important element of Cycle-1:
After making a new ATH (B), Bitcoin retraced back to the previous ATH (A)
Time taken: 15–17 months
This behaviour is extremely rare in traditional markets but has repeated consistently in Bitcoin’s long-term structure.
📌 Why This Cycle Matters
Cycle-1 establishes the foundation for a powerful historical pattern:
BTC tends to fall back to its previous ATH after forming a new ATH.
This phenomenon repeats due to:
Leverage washouts
Liquidity resets
Miner capitulation
Long-term holder profit-taking
Macro monetary tightening phases
This is Cycle-1.
In the next screenshots, we will see how Cycle-2, Cycle-3, and Cycle-4 follow the same structural behaviour.
⏭️ Coming Next (Screenshot-2):
“Post-2017 Cycle — New ATH → 83% Crash → Return to Previous ATH.”
Cycle-2: 2017 Parabolic Expansion → 2018–2019 Reset (Screenshot-2 Breakdown)
This is the second chart in the ongoing 4-part series highlighting Bitcoin’s macro boom-and-bust rhythm—a structural pattern that repeats regardless of market participants, liquidity cycles, or macroeconomic conditions.
Cycle-2 again confirms that Bitcoin follows a highly predictable long-term retracement behaviour after every breakout to a new All-Time High.
🟦 Cycle-2 Overview (2017–2019)
This cycle mirrors the exact structure of Cycle-1:
Break previous ATH
Establish new ATH
Drop –75% to –80%
Return to previous cycle’s ATH
Time duration: 15–17 months
Let’s break down the chart step-by-step.
🔵 Step 1 — BTC Breaks Previous ATH on May–June 2017 (Point E)
In early 2017, Bitcoin broke the previous cycle’s ATH (from 2013–2014).
This breakout point is marked as:
Point E (May–June 2017)
Acts as the new cycle support
Represents the start of the parabolic expansion leg
This breakout confirms institutional liquidity entry and the beginning of a classic crypto macro-cycle.
🟢 Step 2 — Massive Rally to New ATH (Point F) — Dec 2017
After the breakout at E, Bitcoin entered its most aggressive historical rally:
BTC exploded into a full parabolic top
New ATH formed at Point F (Dec 2017)
Extreme retail inflow and speculative leverage
ICO mania peak
This is similar to the 2013 pattern—breakout → acceleration → parabolic top.
🔴 Step 3 — Reversal and Deep Crash: –75% to –82%
Post-ATH, Bitcoin collapsed sharply:
Total Drawdown: –75% to –82%
Duration: 455 days (≈15 months)
Angle of correction: Steep capitulation slope (as shown in your chart)
ICO bubble burst + liquidity draining
Dominance reset + long-term distribution
The depth and duration match Cycle-1 almost exactly.
🟣 Step 4 — Price Re-tests Previous ATH Zone (Point G — Mar 2019)
Just like Cycle-1, Bitcoin returned precisely to the previous breakout area:
Cycle Support (E) → Retest at G
Time Duration: ≈15–17 months
Price forms a demand zone around the previous ATH
Bottoming structure completes at G (March 2019)
This confirms again:
Bitcoin always re-tests its previous ATH after forming a new ATH — within a fixed time band of ~15–17 months.
Cycle-2 perfectly aligns with the behavioural signature of Cycle-1.
📌 Why Cycle-2 Matters to Institutions
This cycle reveals Bitcoin’s predictable macro liquidity reset pattern:
Break previous ATH → Excess speculation → Parabolic top
Systemic deleveraging → –80% correction
Return to previous cycle’s ATH support
Fresh long-term accumulation
This behaviour is structurally identical across multiple halving cycles.
Cycle-3: 2020 Breakout → 2021 Mania → 2022–2023 Reset (Screenshot-3 Analysis)
This third chart demonstrates the strongest confirmation of Bitcoin’s repeating macro-cycle structure.
Despite greater institutional involvement, derivatives expansion, and global liquidity changes, Bitcoin still respected the same 75–80% retracement and 15–17-month correction window.
Cycle-3 proves the pattern is structural, not accidental.
🟦 Cycle-3 Overview (2020–2023)
Like previous cycles:
BTC breaks previous ATH
Creates a new ATH
Drops –75% to –80%
Comes back to retest the previous ATH
Same time duration: ~15–17 months
Let’s decode the chart.
🔵 Step 1 — BTC Breaks Previous ATH in Nov–Dec 2020 (Point H)
Bitcoin broke the 2017 ATH during late 2020:
Breakout Point H (Nov 2020)
This previous ATH (Point F = Point H) becomes the new major cycle support zone
Triggered institutional FOMO: MicroStrategy, Tesla, hedge funds
This breakout ignited the strongest bull run in Bitcoin’s history.
🟢 Step 2 — Bitcoin Forms a New ATH in Nov 2021 (Point I)
Following the breakout at H:
BTC surged to a macro ATH at Point I (Nov 2021)
Fueled by:
Unlimited liquidity (pandemic QE)
Institutional buyers
ETF expectations
Retail mania & leverage
This top perfectly mirrors the parabolic peaks from 2013 and 2017.
🔴 Step 3 — Deep Macro Crash: –75% to –80%
After the November 2021 top:
BTC entered a systemic deleveraging phase
Complete 2022 crypto meltdown:
Luna collapse
Celsius, Voyager, BlockFi
FTX implosion
Price fell 77% from the ATH
Duration: 485 days (~16 months)
Exactly the same timing window as the previous two cycles.
🟣 Step 4 — Retest of Previous ATH Support (Point J — Mar 2023)
Just like Cycle-1 (2013 → 2015)
and Cycle-2 (2017 → 2019):
Bitcoin again returned exactly to its previous ATH zone:
Support Retest Point J (Mar 2023)
Perfect touch of the 2020 breakout zone
Massive demand entered the market
Cycle bottom completed right on schedule
This completes the third full repeat of BTC’s long-term structural cycle.
📌 Institutional Takeaway
Cycle-3 confirms:
Bitcoin’s macro behaviour is identical across 2013, 2017, and 2021 cycles — regardless of market maturity.
Every time Bitcoin breaks its previous ATH:
It creates a new parabolic peak
Then crashes 75–80%
Then returns to retest the previous ATH level
All within a consistent 15–17 month window
This makes Bitcoin the most predictable high-beta asset on the planet at a macro timescale.
Cycle-4: Oct-2024 Breakout → Oct-2025 ATH → Mar-2027 Retest of Legacy Support
After analyzing the previous three Bitcoin macro cycles (2013–2015, 2017–2019, 2021–2023), the new chart strongly suggests that Bitcoin is following the exact same structural behaviour for the 4th time.
This idea explains why BTC may enter a 15–17 month decline starting from the Oct-2025 macro top, and why the next major demand zone sits around 30,000 USD in Mar-2027.
🟥 1. Break of Previous ATH (I = K) — Oct 2024
Bitcoin broke above its previous ATH zone in Oct 2024, exactly like in all earlier cycles:
2013 ATH break → 2013 bull run
2017 ATH break → 2020–2021 bull run
2021 ATH break → 2024 surge
2024 ATH break → current cycle
This breakout (I = K level) becomes the new structural support for the cycle bottom later.
🟩 2. BTC Forms New Macro ATH (Point L) — Oct 2025
One year later, Bitcoin printed a new ATH around Oct 2025, marking the peak of Cycle-4.
Previous cycles also peaked approx. 11–14 months after breaking the last ATH, which strengthens this model.
🔻 3. Post-ATH Crash Begins — Same Pattern, Same Angle, Same Duration
All 3 previous cycles share:
• 75%–80% decline
• Duration: 15–17 months
• Final target: previous ATH or the ATH-1 level
Your chart highlights the same decline angle and same time window (Oct-2025 → Mar-2027).
This is exactly what Bitcoin has done before:
Cycle ATH → Bottom Duration Drop Retest Level
2013 → 2015 15 months –86% Previous ATH
2017 → 2019 17 months –84% Previous ATH
2021 → 2023 16 months –77% Previous ATH
2025 → 2027 (Prediction) 15–17 months –75% to –80% Previous ATH
Nothing in the 2024–2025 structure breaks this long-term behaviour.
🟦 4. Current Price Near “N” = Retesting Breakout Support
BTC is currently trading back near the Oct-2024 breakout level, marked as:
N = Previous ATH Support Zone
Historically, this level is not the final bottom.
It is only the first macro support touch before the full 75–80% correction completes.
Because the full 15–17 month window has not yet played out, a deeper decline remains statistically likely.
🟡 5. Final Prediction — BTC Bottom Around 30,000 USD (Mar-2027)
Following cycle symmetry:
Top: Oct-2025
Drop duration: 15–17 months
Bottom: Mar-2027 (same month as previous major bottom in Mar-2023)
Target zone: $30,000 ≈ last-to-last ATH (2020 level)
This fits perfectly with all 4 historical cycles.
This means BTC may revisit the deep demand zone before the next major bull cycle begins.
📌 Final Outlook (Important for Long-Term Investors)
If Bitcoin truly repeats its macro cycle:
The best long-term buying opportunity would occur in Mar 2027
Price reading: $28K–$32K
After that, BTC begins Cycle-5 (likely targeting $180K–$250K)
This idea is not short-term trading advice; it is a macro-cycle pattern that has consistently repeated for 12+ years.
🟡 BUY / SELL / HOLD — Clear Conclusion
SELL / REDUCE RISK
If you are a trader or short-term investor, Bitcoin is in the post-ATH declining phase, which historically produces 15–17 months of lower prices.
HOLD (Long-Term Only)
Long-term holders can remain calm but should expect deep volatility, not straight-up movement.
BUY (Smart Accumulation Window)
The next high-conviction buying zone will be:
🔥 $28K–$32K
🔥 Timeline: Mar 2027
That will be the start of the next Bitcoin mega cycle (Cycle-5).
📢 Final Message
This research is not about fear or hype—it is about Bitcoin’s consistent repeating macro behaviour.
Every single major crash and rally of the last decade followed the same timing, structure, and depth.
Bitcoin is not random.
Bitcoin is cyclical.
And the cycle says:
**The real bottom is not here yet.
The real opportunity comes in 2027.**

$XPL ALERT: Bearish Now, Massive Accumulation Ahead?AMEX:XPL ALERT: Bearish Now, Massive Accumulation Ahead?
Current Chart View:
AMEX:XPL (Plasma) is showing bearish momentum at current levels. Expect a potential 30%-50% downside, which could create a high-probability accumulation zone for strategic investors.
Key Resistance: $0.32 (blue trendline)
Only a close above $0.32 on higher timeframes (HTF) will trigger a bullish trend reversal. Until then, bears are in control.
Targets if Bullish Breakout Occurs:
Short-term: Price clears $0.32 → bullish momentum resumes
Long-term: $2 possible if price sustains above $0.32
Trading Strategy:
Accumulate in the lower support zone for maximum risk-reward
Wait for HTF confirmation above $0.32 for safer long positions
Watch volume & momentum for breakout validation
Market Insight:
AMEX:XPL offers strategic accumulation potential now, but patience is key. The next bullish move depends entirely on HTF breakout confirmation.
NFA & DYOR

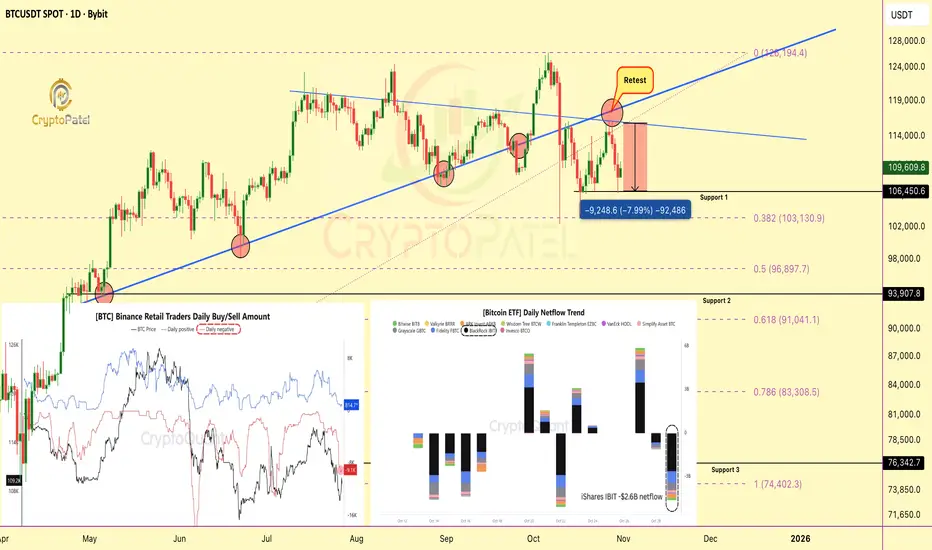
Retail Panic Meets ETF Outflows: $1B Bitcoin Sell-Off Hits MarkeRetail Panic Meets ETF Outflows: $1B Bitcoin Sell-Off Hits Markets
Bitcoin saw renewed selling pressure on Oct 30, as Binance retail traders dumped over 9,200 BTC (~$1B) around $107.7K, just days after another 12,000 BTC sell wave near $108.3K.
Technical View:
Retail traders are aggressively selling into weakness, while long-term holders remain largely inactive.
Historically, these sharp sell-offs from short-term players often form local bottoms, liquidity events where smart money quietly accumulates.
Fundamental Side:
Spot Bitcoin ETFs added more weight to the downside:
🔹 BlackRock: -$2.6B
🔹 Fidelity: -$790M
🔹 Grayscale: -$500M
These ETF outflows likely shifted capital to spot exchanges, amplifying short-term selling pressure.
Key Insight:
▶️ Retail capitulation + ETF outflows = short-term volatility
▶️ But remember, markets often bottom when retail panic peaks.
Note: NFA & DYOR
Will SUI/USDT hit $20 in current bull market or future?SUI Testing Final Demand Zone: Reversal Imminent?
SUI is currently testing a major re-accumulation zone around $2.1 – $1.8, which previously acted as a strong demand area.
A liquidity grab below this level could trigger a sharp reversal, similar to the last time price swept lows before a massive rally.
The structure remains valid as long as this zone holds.
Once price reclaims the $2.7–$3.0 resistance, momentum could shift strongly bullish, targeting the $4.8 zone, and eventually the $20 macro target if the trend continues.
Support: $2.1 – $1.8
Resistance: $2.7 / $4.8
Macro Target: $20
Of course, NFA & Always DYOR

This $4 Token Could Hit $20 And Nobody's Talking About ItThis $4 Token Could Hit $20 And Nobody's Talking About It
Support: $3.70-$4.00 (holding)
HTF Target: $20 (5x potential)
Why it matters:
✅ Exchange tokens outperform in bull cycles
✅ Clear support zone + bullish structure
✅ 500% upside if base holds
While everyone chases pumps, smart money accumulates at support with 5:1 risk-reward.
IF this holds $4 Support, NYSE:BGB could be the millionaire-maker nobody saw coming.
DYOR. Not financial advice.

$TRUMP MEMECOIN: -98% DRAWDOWN ANALYSIS$TRUMP MEMECOIN: -98% DRAWDOWN ANALYSIS
TECHNICAL BREAKDOWN:
▶️ ATH Distribution: $70 (Exit signal executed)
▶️v Current Price Action: 98% retracement from peak
▶️ Market Structure: Parabolic blow-off → capitulation phase complete
▶️ Performance validates early exit thesis.
CURRENT MARKET STRUCTURE:
▶️ Bias: Bearish continuation
▶️ Key Resistance: $8.00 (structural pivot)
▶️ Invalidation Level: Sustained break above $8 with volume
▶️ Breakout scenario → $50 measured move target
▶️ Probability: Low (requires liquidity catalyst)
SPECULATIVE OPPORTUNITY (HIGH RISK):
▶️ Asset Class: Extreme volatility / lottery ticket
▶️ Entry Thesis: 92% discount from ATH = asymmetric R/R
▶️ Position Allocation: 1-2% max portfolio weight
▶️ Time Horizon: 12-24 month hold
▶️ Stop Loss: Total loss acceptable
▶️ This is binary outcome speculation, not investing.
INSTITUTIONAL PERSPECTIVE:
▶️ Celebrity token = coordinated distribution to retail
▶️ Tokenomics favor insiders
▶️ Liquidity profile indicates exit event completed
▶️ Capital preservation >> speculative moonshots
Risk Disclosure: Speculative asset. Trade accordingly.
⚠️ NOTE: Never invest hard-earned money in celebrity/influencer tokens. These are engineered liquidity extraction schemes, not legitimate projects.
Capital preservation > moonshot gambling.
NFa & DYOR

Will TRON hit $1 Club?TRON rise has been nothing short of epic.
From $0.0068 at launch to $0.36 today, over 50x growth.
$1 isn’t a dream anymore… it’s getting closer every day.
Who’s ready for CRYPTOCAP:TRX to crash into the $1 club? 🚀
NFA & DYOR

$BANANAS31 Dumped 58% — Hope You Took Profits, Not Pain.$BANANAS31 Dumped 58% — Hope You Took Profits, Not Pain.
It just dumped 58% within hours. Brutal.
Yesterday: $0.016–$0.018
Now: $0.0071 and still sliding…
Hope you enjoyed huge profit with $BANANAS31 short trade —
and not by buying the top.
This is why I always say:
Never chase green candles.
Don’t be exit liquidity.
Learn the game or pay the price. What’s your biggest FOMO trade?👇
