$LUNA Finally Catching a breath After Brutal Red Days VIE:LUNA Finally Catching a breath After Brutal Red Days 😮💨
From Bloodbath to Bounce:
🔴 -99.88% massacre (RIP portfolios)
🟢 Now +286% relief at $0.23 From $0.06415 within 21 Days
▶️Major Downtrend line overhead
Major resistance at $0.30-0.38 ahead.
Potential bottom formation or dead cat bounce?
Recovery or bull trap? Time will tell 🤔
EXTREMELY HIGH RISK asset - trade with caution
Not financial advice | DYOR
Search in ideas for "CRYPTO"

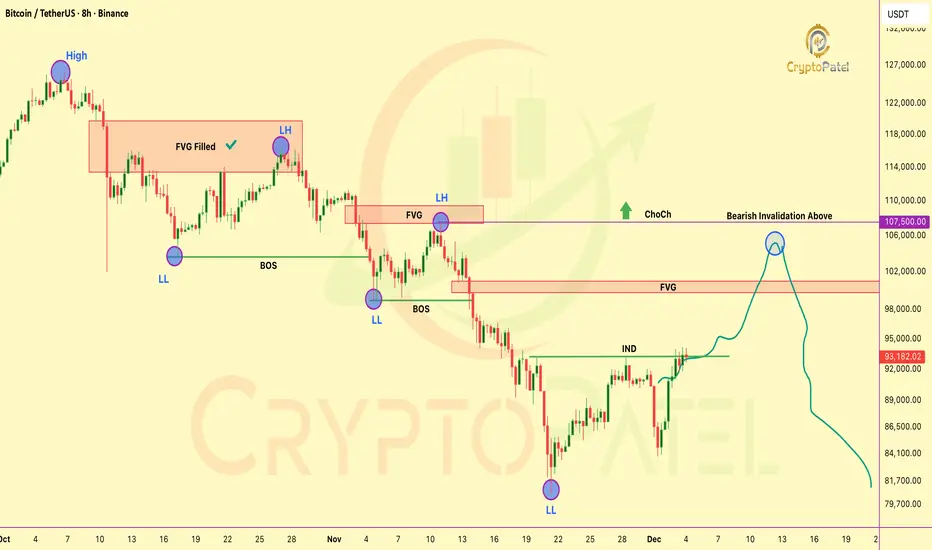
HTF ChoCH Alert: BTC’s Macro Bias Is Still BearishHTF ChoCH Alert: BTC’s Macro Bias Is Still Bearish
BTC is still following clean HTF bearish order-flow (LH → LL → BOS).
The current push up is just a premium retracement, driven by internal liquidity grabs.
Price is reaching for the premium FVG at 99,866–101,184, the next clear draw on liquidity and a prime reversal zone.
Below 107,500 bias stays bearish (Bearish Invalidation / HTF ChoCH)
Expect: BSL sweep → FVG fill → mitigation → sell-side continuation.
ICT view:
Market is simply rebalancing inefficiency before delivering lower.
NFA & DYOR
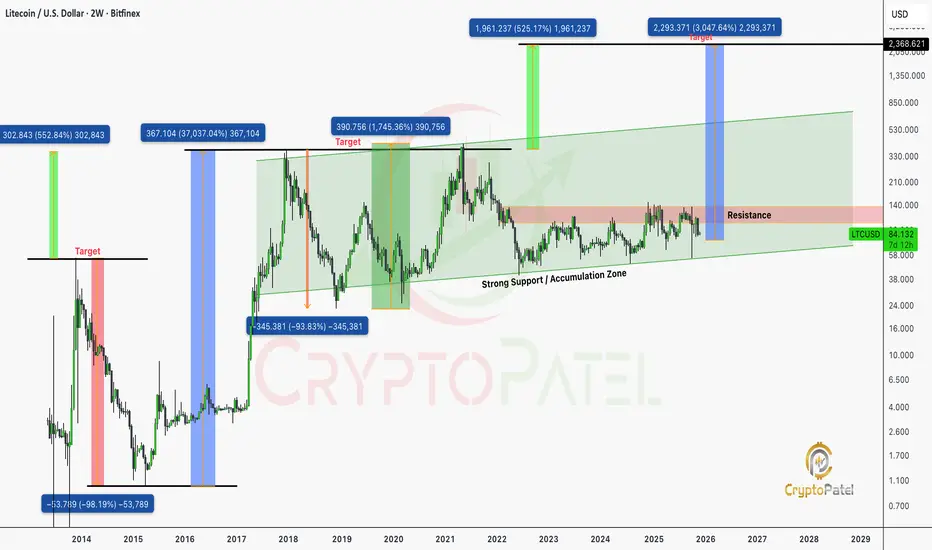
Is $LTC Dead? The Same Question Asked Before Every Major Rally…Is NYSE:LTC Dead? The Same Question Asked Before Every Major Rally…
When markets forget history, they repeat it. Litecoin has gone through multiple full-cycle Retracements, Each time followed by explosive multi-X expansions. Let’s walk through the data:
🔰 2013–2015 Cycle: “LTC is Dead” #1
🔹 LTC hit an ATH of $55 from $1.
🔹 Retraced ~98%, bottoming at $0.985 within 16 months.
🔹 Retail sentiment: “LTC is dead.”
🔹 Smart money quietly accumulated.
Result?
$0.985 → $9 in 4 months (≈ +900%)
Eventually: $0.985 → $370 in 3 years (≈ +37,000%)
🔰 2017–2018 Cycle: “LTC is Dead” #2
🔹 New ATH: $370
🔹 Retracement: 92%, down to $23
🔹 Again: retail capitulation.
Result?
$23 → $146 in 6 months
$23 → $413 by May 2021 (≈ +1700%)
🔰 Current Market Structure (2021–2025)
🔹 Previous ATH: $413 (May 2021)
🔹 Current price: ~$84
🔹 Drawdown: 80%
Retail narrative: “LTC is dead.”
TA narrative: This is historically the accumulation zone.
Technical Outlook (Cycle-Based TA Projection)
Every prior deep-cycle retracement (80–98%) has led to:
🔹 Fresh multi-year impulse waves
🔹 New macro highs
🔹 Massive ROI expansion for accumulator wallets
Based strictly on historical cycle symmetry, volatility bands, and LTC’s halving-driven structure:
LTC Bull-Run Projection:
$600 – $1,000 is a reasonable and technically sound target range for the current macro cycle.
This would represent:
🔹 Breaking the 2021 high
🔹 Completing a full 5-wave macro structure
🔹 Returning to historical expansion ratios seen in every prior cycle
So You Already Know What Happens Next.
Litecoin’s entire history is built on max pain → max gain cycles.
Every 80–98% retracement has delivered its largest multi-X rallies after retail gave up.
Smart investors accumulate when the chart says accumulate, not when the crowd screams “dead.”
FINAL MESSAGE
LTC is not dead. It is in the same deep-value zone where every previous mega-cycle began.
If the market delivers another historical impulse, the $600–$1000 range remains a technically justified target.
Accumulate dips.
Ignore noise.
Let the chart speak.
Not Financial Advice so Always Do your Own Research Before Any Investments.
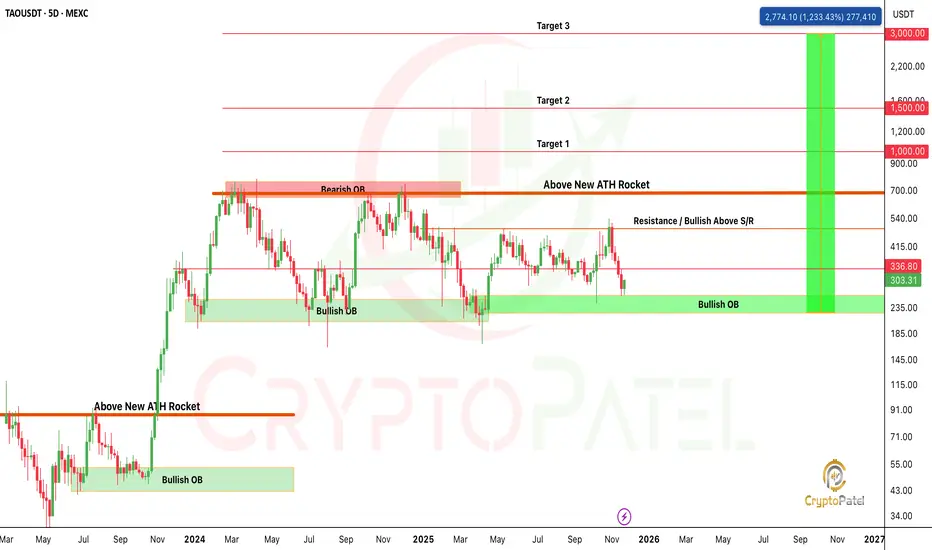
$TAO HTF SMC: Who’s Ready for the $1,000+ Expansion?GETTEX:TAO HTF SMC: Who’s Ready for the $1,000+ Expansion?
Price continues to respect the HTF Bullish Order Block (OB) at $235–$185, which remains the primary demand zone maintaining bullish order flow. Each mitigation of this OB has previously generated strong displacement to the upside, confirming active institutional interest.
The current range is defined by:
🔹 HTF Demand (Bullish OB): $235–$185
🔹 Mid-Range S/R: $540
🔹 HTF Supply (Bearish OB): $640–$700
A decisive close above $540 S/R will shift the internal structure bullish and validate a premium re-pricing phase targeting the HTF Supply at $640–$700.
A clean break of structure (BOS) above $700, combined with a displacement candle, will confirm HTF trend continuation and open up extended liquidity targets:
Target 1: $1,000
Target 2: $1,500
Target 3: $3,000
As long as price maintains the $235 Bullish OB, the HTF narrative remains bullish, with expectation of a sweep of upper-side liquidity and expansion toward unmitigated supply zones.
NFA & DYOR
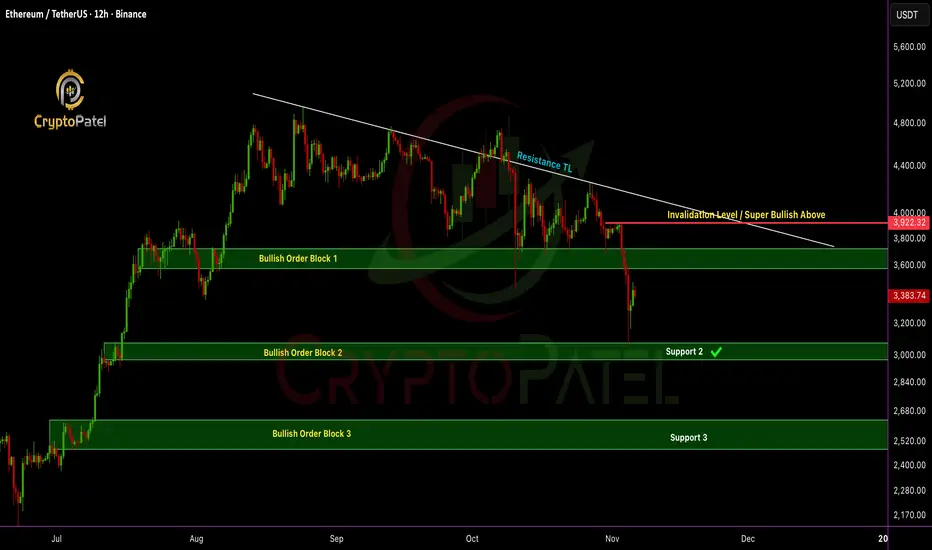
ETH/USDT dumped 20% after my analysisETHEREUM Update: Price just hit the bullish order block at $3,057 and bounced exactly as predicted ✅
Quick recap:
✅ Short-term: I’m bearish below $3,920, next potential leg down $2,500–$2,200 if $3,000 support breaks.
✅ Medium-term: Holding $3,000 support is key, could spark the next bullish wave.
✅ Long-term: Still super bullish & Target remains $10K–$15K ETH
Paper hands panic. Legends load the blood & hold.
Which one are you? 👇
NFA & DYOR
$ONDO Could Be the Next 20x Gem: Are You Ready?LSE:ONDO Could Be the Next 20x Gem: Are You Ready?
Currently in bearish breakdown, but if price falls below $0.50, IMO best accumulation zone starts.
Strong Support Zones:
Support 1: $0.53–$0.46
Support 2: $0.24–$0.20
Targets (Long Term): $5 / $10 (~20x from entry if filled)
Manage risk & DYOR, huge upside if supports hold!

ETH on the road to $10,000? Let’s break it down🔥 ETH on the road to $10,000? Let’s break it down 👇
Here’s why ETH looks stronger than ever:
1️⃣ Big Money Flowing In
🔹 ETFs & public companies bought 4.4M ETH ($20B) this quarter.
🔹 Whales & Web3 firms added another 2M ETH.
🔹 That’s more than 5% of total supply absorbed in just months.
2️⃣ Record Network Growth
🔹 DEX trading volume at new highs.
🔹 Daily transactions & active wallets breaking records.
🔹 Stablecoin supply at ATH.
👉 Demand for Ethereum’s network is exploding.
3️⃣ Massive Supply Crunch
🔹 30% staked, 8% with institutions, 25% with long-term holders.
🔹 5% permanently lost.
🔹 Only 12% left on exchanges, shrinking fast.
🔹 Inflation rate just 0.5%, even lower than Bitcoin.
With retirement funds opening ETH access, rate cuts coming, and pro-crypto regulations, the demand will only increase while supply dries up.
Short-term dips may shake out weak hands… but the bigger picture is clear: ETH is heading above $10K this cycle.
Note: NFA & DYOR

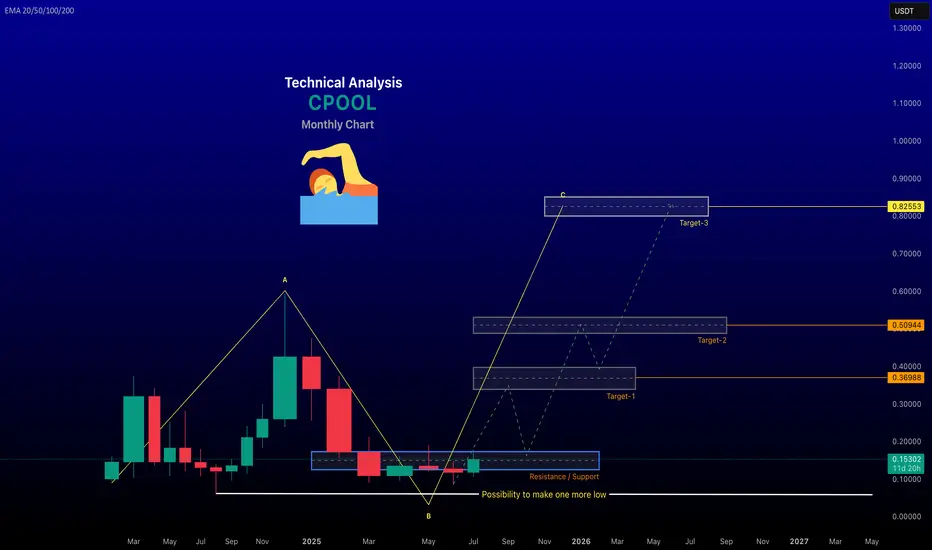
renderwithme || Clearpool (CPOOL) Cryptocurrency Analysis#Overview of Clearpool
(CPOOL)Clearpool is a decentralized capital markets ecosystem that enables institutional borrowers to access uncollateralized liquidity through a DeFi protocol. The CPOOL token is the utility and governance token for the platform, used for voting on borrower whitelisting, staking, and earning rewards. Liquidity providers earn yields enhanced by CPOOL rewards, and the protocol aims to bridge traditional finance with DeFi, targeting the $120 trillion capital markets.
Current Price and Market Data (as of July 20, 2025)Price: $0.1571 USD, down 4.16% in the last 24 hours.
24-Hour Trading Volume: $7,632,433 USD.
Market Cap: $123,303,081 USD, ranking #320 globally.
Circulating Supply: 784,836,183 CPOOL out of a total supply of 1,000,000,000 tokens.
All-Time High: $2.56 (down 95.55% from peak).
Recent Sentiment: Posts on X indicate bullish sentiment, with technical analysis reports showing a 61.54% bullish rating on a 4-hour timeframe on KuCoin.
Technical AnalysisShort-Term Trends: Recent X posts highlight a strong bullish trend on a 1-hour and 4-hour timeframe, suggesting traders may favor long positions. Technical indicators like Moving Averages, RSI, MACD, and others show "Strong Buy" signals on shorter timeframes (5 minutes to 5 hours) but a "Strong Sell" on weekly charts, indicating potential volatility or correction over longer periods.
Risk Assessment: InvestorsObserver rates CPOOL as a medium to high-risk investment due to price volatility relative to trading volume and market cap. Price movements can be significant with limited trading activity, suggesting susceptibility to manipulation or sharp swings.
Key Levels: A clean breakout has been noted, but specific support and resistance levels are not detailed in the provided data. Traders should monitor real-time charts on platforms like TradingView for pivot points and moving averages.
Fundamental AnalysisUse Case: CPOOL’s role in governance and staking gives it utility within the Clearpool ecosystem. The protocol’s focus on uncollateralized lending is unique, appealing to institutions seeking DeFi solutions without traditional collateral requirements. The buyback program, where protocol revenue is used to purchase CPOOL, aims to sustain reward pools and potentially support price stability.
Market Position: Clearpool’s integration of real-world asset (RWA) tokenization positions it in a growing DeFi niche, potentially reducing costs compared to traditional finance. However, its #320 ranking suggests it’s a mid-tier project with room for growth or risk of being overshadowed by larger protocols.
#Price Predictions:
Forecasts for 2025 vary widely:
Optimistic projections: $0.2068–$0.3204 (WalletInvestor, PricePrediction.net).
Pessimistic projections: $0.5024–$0.8255
Contradictory outlooks reflect uncertainty, driven by market sentiment, crypto market trends, and protocol developments. Investors should conduct their own research (DYOR) due to these discrepancies.
Investment ConsiderationsOpportunities: Bullish sentiment, institutional adoption potential, and the buyback program could drive price growth if DeFi and RWA tokenization gain traction.
Risks: High volatility, a significant drop from the all-time high, and a medium/high-risk rating suggest caution. The crypto market’s sensitivity to regulatory, financial, and political events adds uncertainty.
Recommendation: CPOOL may suit short- to medium-term traders comfortable with high risk, given the bullish technical signals. Long-term investors should assess Clearpool’s ability to scale institutional adoption and monitor broader DeFi trends. Always use stop-loss orders and diversify to manage risk.
How to Analyze and Predict CPOOL PriceTechnical Analysis: Use tools like TradingView to track indicators (RSI, MACD, Moving Averages) and identify support/resistance levels. Monitor volume for breakout confirmation.
Fundamental Analysis: Stay updated on Clearpool’s partnerships, borrower onboarding, and protocol revenue for buyback impact. Follow X for community sentiment and news.
Risk Management: Given the high-risk rating, limit exposure and use risk management strategies like position sizing and stop-losses.
External Factors: Monitor broader crypto market trends, regulatory developments, and DeFi adoption rates, as these heavily influence CPOOL’s price.
~~ Disclaimer ~~
This analysis is based on recent technical data and market sentiment from web sources. It is for informational \ educational purposes only and not financial advice. Trading involves high risks, and past performance does not guarantee future results. Always conduct your own research or consult a SEBI-registered advisor before trading.
# Boost and comment will be highly appreciated.
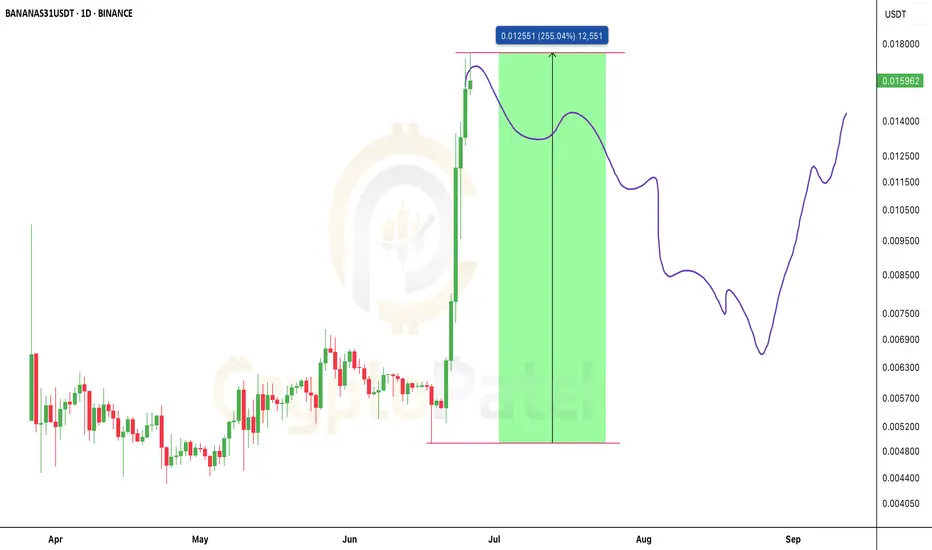
Did you FOMO into $BANANAS31USDT after the 250% pump?Did you FOMO into BINANCE:BANANAS31USDT after the 250% pump? You might want to hit pause… 🛑
$BANANAS31 pumped 250% in just 10 days, including a vertical spike. But the chart now looks top-heavy — consolidation is weakening, and momentum is fading.
I'm expecting a 30–50% retracement if support breaks. Fresh entries here? Extremely risky. High-risk traders may eye shorts — but it's a dangerous game.
Are you riding it or fading it from here? Comment your strategy 👇
NFA & DYOR
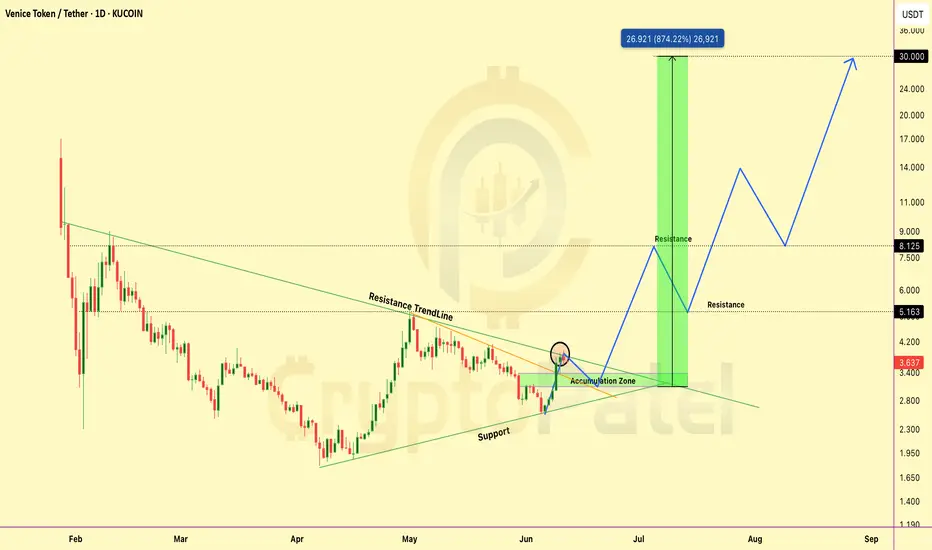
Is VVV The Next 10x RWA Play? Breakout + Strong Fundamentals!VVV is starting to show one of the strongest setups on my radar right now.
Here’s why this could turn into a major long-term bullish play 👇
Technical Picture:
✅ Broke LTF (lower time frame) resistance trendline
✅ Now attempting to break HTF (higher time frame) resistance trendline
✅ Accumulation Zone: $3.40–$3
✅ Strong Support: ~$2.70
👉 If HTF breakout confirms → serious upside could follow.
My Long-Term Targets:
$5 → $10 → $20 → $30 🚀
Why VVV Is Bullish Fundamentally:
✅ Real-world utility → tokenized luxury + travel ecosystem
✅ Strong partnerships → hotels, luxury brands, travel services
✅ Scarce supply + clear token utility (staking, discounts, access)
✅ Aligns with major Web3 + AI + RWA narratives → a trend driving this cycle
✅ Still low market cap → high asymmetry → early opportunity
Summary:
👉 If HTF breakout confirms, this could easily become one of the top runners this year.
👉 Narrative + chart + fundamentals are all lining up perfectly.
🎯 Strategy: Accumulate within the zone, watch for breakout confirmation → hold for long-term targets.
👉 Keep this one on your radar.
Note: NFA & DYOR
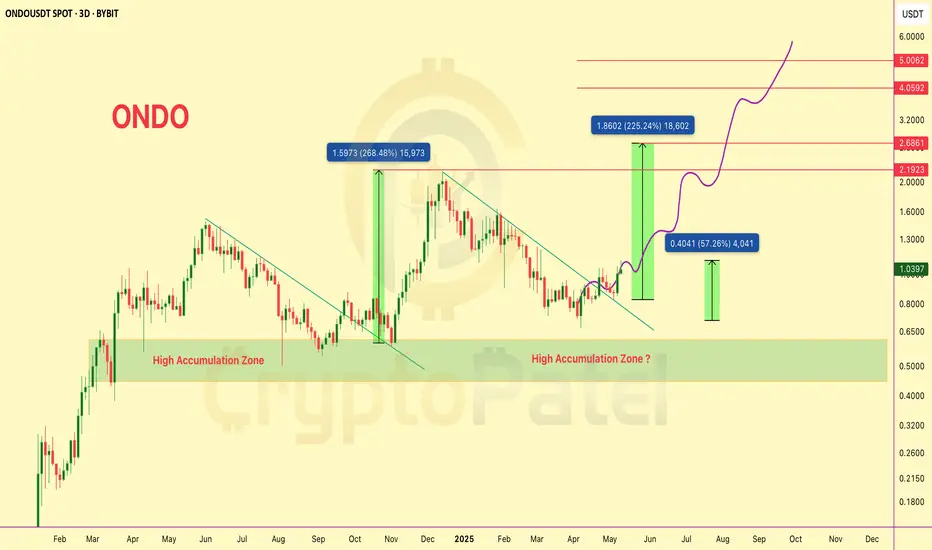
$ONDO/USDT Technical Analysis – Next Move Loading?$ONDO/USDT Technical Analysis – Next Move Loading?
#ONDO just broke out of a long-term descending trendline resistance and is now preparing for its next major wave.
We already shared the dip-entry below $0.80 — and it’s now up 57% from that zone!
Hope you're enjoying the ride.
Chart Highlights:
▶️ Clear breakout from multi-month downtrend.
▶️ Price bounced strongly from the High Accumulation Zone ($0.80-$0.50).
▶️ Previous breakouts resulted in +268% and +225% rallies.
▶️ Short-term move toward $1.30–$1.40 possible if support holds.
▶️ Targets: $2.19 → $2.68 → $4.05 → $5.00+
A healthy pullback or consolidation above $1 could offer the next breakout leg toward $2+.
Stay alert. Accumulation looks complete, and momentum is shifting bullish fast.
The Next Big L2 Gem? $ARB Is Breaking Out —Why It Could it 10x🚨 The Next Big L2 Gem? AMEX:ARB Is Breaking Out — Here's Why It Could 10x+ 🚨
🔰 What is Arbitrum?
Arbitrum is Ethereum’s top Layer-2 scaling solution using Optimistic Rollups.
It powers faster, cheaper transactions without compromising security.
🔰 Ecosystem Highlights
▶️ Arbitrum One – DeFi & dApps
▶️ Arbitrum Nova – Gaming & Social apps
▶️ Hosts major projects: Uniswap, Aave, GMX
▶️ Among the top L2s by TVL dominance
🔰 Tech & Innovation
▶️ Runs on fraud-proof optimistic rollups
▶️ Nitro upgrade boosted throughput + cut gas fees
▶️ Gives near-Ethereum experience with 10x lower costs
🔰 Tokenomics
▶️ Total Supply: 10B ARB
▶️ Airdrop: 1.162B (11.6%) to users & DAOs
▶️ Remaining: Treasury + future ecosystem rewards
➡️ Small circulating supply = potential supply squeeze on demand surge
🔰 Backers & Partnerships
▶️ Built by Offchain Labs
▶️ Investors: Lightspeed, Pantera, Coinbase Ventures
▶️ Listed on Binance, Coinbase, KuCoin
▶️ Integrated by top Ethereum protocols (Uniswap, etc.)
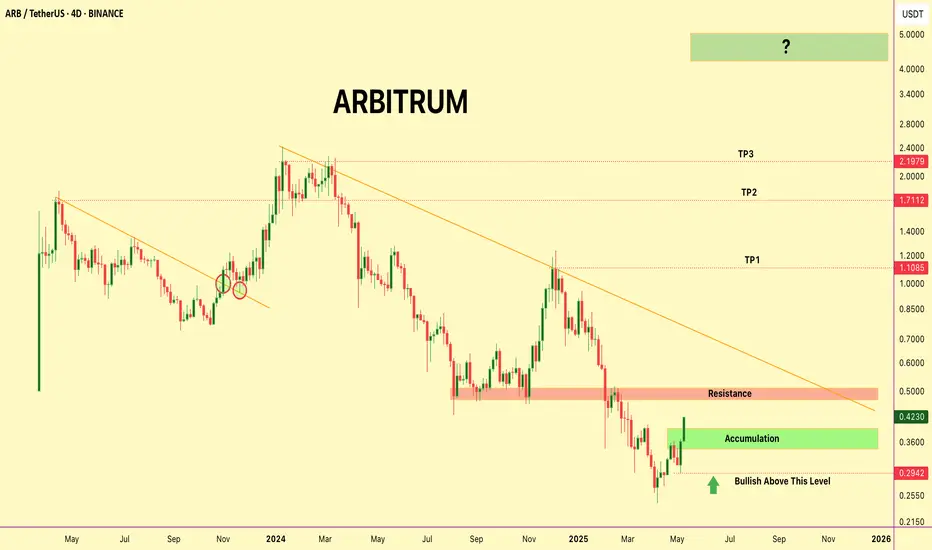
🔰 TECHNICAL BREAKDOWN: ARB/USDT HTF Chart
✅ Accumulation Zone: $0.29–$0.42
▶️ Above $0.4028 = momentum shift zone into Super Bullish
▶️ Next resistance: $0.48–$0.52 (watch for breakout!)
▶️ Targets: $1.10 / $1.71 / $2.19 / $5
⚠️ Hold above $0.2942 to keep setup valid
✅ Strong volume + higher lows = bullish confirmation
▶️ DYOR | NFA
🔰 Why 10x–50x Is Possible
▶️ Top Ethereum L2 by usage
▶️ Real utility, not meme hype
▶️ Limited unlocked supply = buyer advantage
▶️ L2 sector will explode if ETH demand grows
▶️ Could capture a huge chunk of ETH's scaling market
🔰 Final Take
▶️ AMEX:ARB is more than hype — it's infrastructure.
▶️ In a bull market, this is the kind of setup that runs hard.
▶️ Keep it tight on your watchlist.
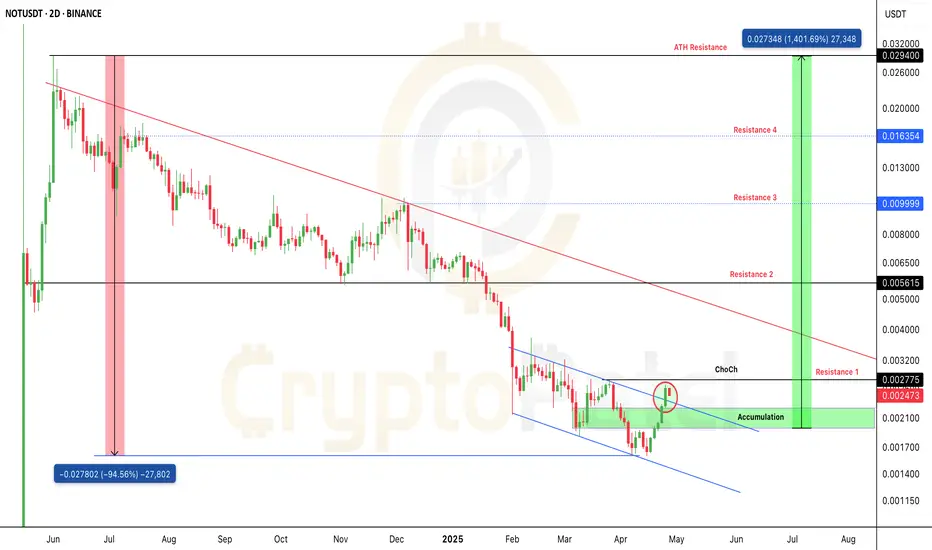
$NOT: Bottomed Out, Breakout Confirmed — Bulls Getting Stronger!GETTEX:NOT : Bottomed Out, Breakout Confirmed — Bulls Getting Stronger! Is This the Last Chance Before $0.03 and New ATH? 🚀
🔰 Current Status:
GETTEX:NOT has corrected -92% from its ATH and recently showed a strong bounce from the bottom, accompanied by a surge in volume.
🔰 Structure Analysis:
▪️ Price is currently forming Lower Lows (LL) and Lower Highs (LH).
▪️ A Change of Character (ChoCh) is identified around $0.0028.
➔ A breakout and candle close above $0.0028 would confirm a major trend reversal.
🔰 Pattern Breakout:
The price has also broken out from a falling wedge pattern, indicating that bullish momentum is building up.
🔰 Accumulation Zone:
Key accumulation area: $0.0022–$0.0019.
🔰 Targets:
Immediate resistance zones will act as the first targets post-breakout.
Major rally potential toward a New ATH if $0.0028 flips into support.
🔰 Risk Management:
Stop Loss suggested at: $0.001590 (below previous support structure).
Key Question:
Can GETTEX:NOT hit $0.03 in this altseason?
If ChoCh breakout and resistance flip are confirmed, $0.03+ becomes a highly probable target during strong altseason momentum.
DYOR — Trade Safe.
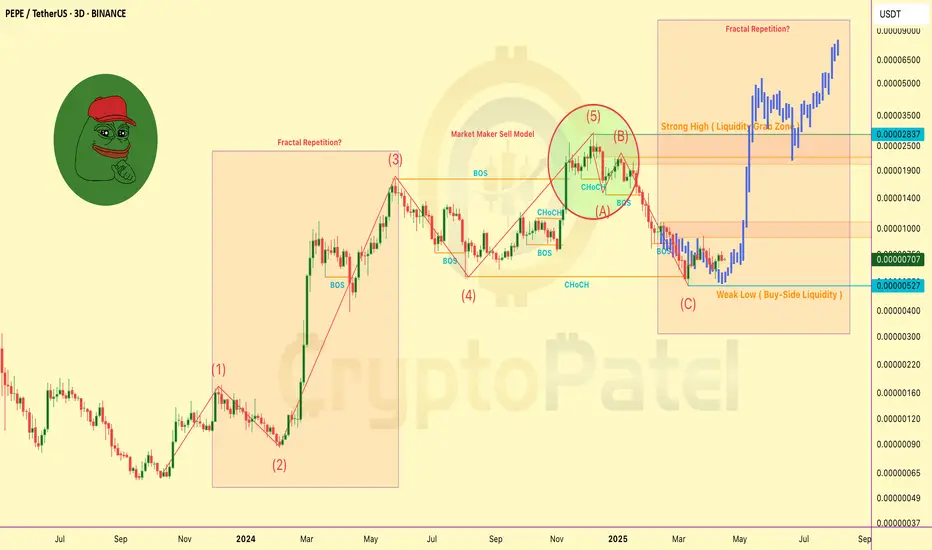
PEPE/USDT – 3D Chart Technical Breakdown (April 2025)PEPE/USDT – 3D Chart Technical Breakdown (April 2025)
Based on SMC, ICT, Elliott Wave, and Fractal Analysis
Major Structure Insights:
▪️ PEPE completed a 5-wave Elliott impulsive rally followed by an ABC corrective wave.
▪️ Wave C swept the buy-side liquidity near 0.00000527, triggering potential reversal.
▪️ Recent CHoCH and BOS suggest a trend shift back to bullish.
Fractal Repetition Detected!
▪️ Previous bullish pattern is repeating – similar structure and accumulation signs.
▪️ Market Maker Sell Model played out perfectly at the top before correction began.
Key Liquidity Zones:
🔵 Weak Low: 0.00000527 (swept)
🟠 Strong High: 0.00002837 (targeted)
▪️ Intermediate Levels: 0.00001000, 0.00001900, 0.00002837
▪️ Final Expansion Projection: 0.000065–0.000090
Smart Money Concepts Confirmed:
▪️ Liquidity engineered and swept at lows
▪️ Institutional entry signs after BOS
▪️ Fractal structure supports a bullish continuation phase
Outlook:
If structure holds and price continues above 0.00000600, next leg toward 0.000019–0.00002837 could be explosive.
Below 0.00000500 = Invalidation zone.
Note: This is a technical viewpoint for educational purposes.
DYOR – Not Financial Advice.
DOGE/USDT – Prime Accumulation Zone & Bullish OutlookDOGE/USDT – Prime Accumulation Zone & Bullish Outlook 🚀
Current Status : Trading at $0.15-$0.20 support zone, a strong accumulation area. DOGE is currently 64% down from its ATH, presenting an attractive risk-reward setup.
Key Levels:
Support: $0.15 - $0.20 (Accumulation Zone)
Targets: $0.60 / $1.50 / $2 / $2.50
Why Bullish?
Technical Perspective: DOGE is holding key support and could see a breakout on volume expansion.
Catalyst: Elon Musk’s continued backing makes it a strong contender for long-term gains.
Strategy: Any major dip is a buying opportunity for long-term holders. Keep an eye on volume surges and market sentiment!
Note: NFA & DYOR

Bitcoin Ready for $69000 ?#Bitcoin followed my chart PERFECTLY! 🚀🎯
I warned you, but some laughed. Who’s laughing now? 😏
From $108K to $79K—NEXT STOP: $75K-$70K (prime accumulation zone!) 🔥
Who’s buying this dip? 🤔👇

ETH/BTC Crashed 70%! Target Achieved! Now Real Bull Market ?ETH/BTC Crashed 70%! Target Achieved! Now It's Time for the REAL Bull Market
◾️ Our Short Entry: 0.075 BTC ✅
◾️ Current Price: 0.02337 BTC ✅
◾️ Total Drop: -70%
◾️ Target Achieved! Now, we are ready for the actual Bull Market!
💰 Accumulation Phase Begins! Time to start positioning for the next big move.
#Crypto #Ethereum #Bitcoin

BONK Breakout Looks Strong so Targeting Huge 500% Jump! Big SEED_DONKEYDAN_MARKET_CAP:BONK Move Coming: Breakout Looks Strong so Targeting Huge 500% Jump! 🚀
SEED_DONKEYDAN_MARKET_CAP:BONK shows a strong bullish breakout and retest above its weekly support at $0.000030. If this level holds, we could see an explosive 500% move from the accumulation zone: $0.000033-$0.000029.
➡️ Target: 500%
➡️ Stop Loss: $0.000024 or weekly close below $0.000028
➡️ Already 350% gave From Previous Analysis
⚠️ Note: Memecoins are highly volatile with high risk/reward. Always DYOR—this is not financial advice. Get ready for a market reset and potential rally!

Bitcoin 2H SMC Chart Analysis: Bearish Outlook Bitcoin 2H Chart Analysis: Bearish Outlook
Currently, Bitcoin is forming a Lower Low (LL) and Lower High (LH) pattern, signaling a potential bearish trend in the short-term. Key support levels to watch are around $88,000 and $85,000.
📉 Next Targets: $88,000 → $85,000
🚫 Critical Level: A 2H close above $101,000 would invalidate this bearish outlook.
Note: If Bitcoin holds below $100,000, expect a possible decline to $85,000.
Remember, always set your stop losses to protect your funds in case the trend shifts.

LTO/USDT Bullish Chart AnalysisLTO/USDT Bullish Chart Analysis
Overview:
GETTEX:LTO is showing bullish signs based on the charts. Since it’s pumped recently, I’m waiting for a dip before buying.
Buy Zones: $0.17 - $0.14
Targets: $0.27/$0.79/$1.37
Stop Loss: $0.10
Important Note: Watch the trend line support closely as it will confirm if the bullish trend continues.
Trade smart and stay safe!

Bitcoin Bearish now as per chart analysisBitcoin remains bearish according to chart analysis.
Currently trading at a strong psychological support level of $60,000. However, I expect a drop to $55,000 if $60K support breaks. Short setup stop-loss (SSL) at $62,500.

Bitcoin Bearish as per SMC Analysis#Bitcoin Update:
IMO, #BTCUSD looks ready for another dump after tapping into the FVG and OB.
Short Area: $63,000 - $63,800
Stop Loss: $64,200
If rejected from the FVG level, the next target is $55,000.

WLD/USDT Looks good for scalpingWLD/USDT looks good for a quick trade!
I’m expecting a 10% move up from here.
Targets: $1.50 / $1.60
Stop Loss: 1H close below $1.38
Let’s see how this goes!
