LOT OF MONEY WILL AGAIN GET PUMPED INTO CRYPTO?Monthly chart of Crypto Market Cap
Looks like we are forming a double bottom and MACD about to make a bullish cross soon.
LOT OF MONEY WILL AGAIN GET PUMPED INTO CRYPTO?
Search in ideas for "CRYPTO"

FTT crypto coin FTT crypto coin given very good triangle breakout ...and also retested its support ..expecting good targets of 70,75 in short term


WINUSDT (Crypto)Cryto currency is a hot topic now. Came across this chart. Trade at your own risk , cryptos are very volatile.


✳️ Litecoin (Feb 22) Big Pump will come soon#LTC/BTC (Binance)
Buy : 0.0075 - 0.0077
Sell : 0.008 - 0.0085 - 0.009 - 0.01 - 0.011 - 0.012 - 0.013
Stoploss : 0.0069
#LTC $LTC #LTCBTC

BTC Update (Feb 17)Our 2 buy orders at 9750$ and 9550$ were filled. This is the best opportunity to accumulate more BTC to catch the big Altcoin season.
Here is our plan
- If you just want to trade BTC/USDT, BTC will back to above 10000$ in next 2 days and will try to test 10500$ zone
- If you want to earn money effectively in this period, let you give BTC a safe range above 9000$ to keep trading Altcoin. And try to gain over 10% profit and don't worry about BTC in this period. Just try to buy Altcoin with the best buyzone

Double top on Cryptocurrency Marketcap/TOTALafter the hidden bearish divergence from obv, Bearish divergence in MACD and RSI with price action few days ago.
it's seems it's now forming a double top.
let see if the price action can hold 200 and 50 ema (green and purple line) as if will continue the bullish growth of crypto market if it's hold and vice versa..
interestingly it's happen not far to distant in the past..
check this out;
Similar double top pattern..
Though from OBV, RSI is quite flat line and follow the price action, MACD do stands out giving hint there's a divergence in volume with correlation a price action.. the price action end up into fibonacci horizontal around 0.236 and 0.382 .. if history keep it self repeat and still in bullish growth.. i expect yellow line in fibonacci retracement could be a good buy zone if the crypto market didnt have negative black swan event.
we will see what happen..
please do take this as a grain of salt, i'm not a financial advisor and this post just all my opinion only and feel free to share what your thought..
peace..

Total MarketCap Ready for 1600% relly ?Altcoin Moon Mission: $3-4 Trillion Market Cap Imminent?
Total Altcoin MarketCap
The total crypto market cap chart (excluding CRYPTOCAP:BTC & CRYPTOCAP:ETH ) just hit a local top.
I'm expecting some healthy consolidation or dip ahead to the 0.5-0.618 fib level.
That would form an ideal accumulation zone before the next altseason breakout!
Remember - dips mean #DCA opportunities.
After the last big falling wedge breakout, the total alt market cap surged over 1600%.
This time around, I wouldn't be surprised to see $3-$4 trillion eventually.
Of course nFA, but I'm slowly accumulating solid #altcoin projects during any dip we get.
The setup is still incredibly bullish overall!
When this chart breaks out, it will likely signal the real start of #AltSZN and some parabolic upside ahead.
Just be patient and stick to your plan.
Pls RT/Comments
#cryptocurrency #CryptoMarketCap #Ordinals #TRIAS #altcoinseason #altseson #Bitcoin

Will XRP hit $10 in this Bull Market?XRP Monthly Chart Update
Chart by: @CryptoPatel
CRYPTOCAP:XRP is looking super bullish right now!
✅ Strong breakout confirmed above the long-term resistance
✅ Price is holding the $2.00 level as new support
✅ Retest likely before the next major leg up
📈 Next major targets: $9.36 → $14.83
Structure is solid, volume building, and the bullish momentum is real.
We're early — $10+ is on the horizon!
Long-term holders, this might be your moment.

USDT.D RSI Oversold, Expected Bounce to 5%-5.5%, Bearish for BTCCRYPTOCAP:USDT.D shows signs of a potential bounce as RSI has reached oversold territory, indicating a likely move up to the 5%-5.5% area.
With #USDT.D rising, we expect #Bitcoin and altcoins to face downward pressure due to the inverse relationship between USDT dominance and the broader crypto market.
Watching for confirmation of this bounce could provide shorting opportunities in CRYPTOCAP:BTC & #crypto .

USDT.D FORMING BEARISH DIVERGENCE IN DAILY TIME FRAMEUSDT.D ( CRYPTOCAP:USDT dominance) appears to be forming a double top pattern on the chart, signaling potential weakness. This is further confirmed by bearish divergence on the RSI, where price action is making similar highs, but momentum is decreasing, indicating the possibility of a reversal.
If this double top confirms with a breakdown from current levels, particularly if it loses the 5.3% support, it could trigger a significant reversal in USDT dominance. This scenario would likely lead to a bullish move across Bitcoin and altcoins since a decrease in USDT dominance typically indicates that traders are moving their funds from USDT into cryptocurrencies.
Waiting for confirmation before making any moves is crucial to avoid false breakouts or invalid patterns.

Impending Drop: USDT.D Faces Significant DeclineHi friends,
If you observe the recent behavior of USDT dominance (USDT.D), it bounced back and touched 5%, but now it has clearly formed a double top pattern, which is a bearish sign. Additionally, the RSI is declining, supporting our bearish scenario. Whenever USDT.D falls, the crypto market tends to rise, and BTC often rallies. These two are inversely related.
#USDT #CryptoMarket #Bitcoin #BTC #CryptoTrading #TechnicalAnalysis #DoubleTop #BearishPattern #RSI #CryptoNews #Cryptocurrency #TradingAnalysis #MarketTrends #InverseRelationship #CryptoInvesting

USDT Bullish Double Bottom patternCRYPTOCAP:USDT DOMINANCE
On the H1 timeframe level the price action converted its Bullish Harmonic Bat pattern to the Bullish Harmonic Shark pattern level where the price action is currently consolidating at its Daily Horizontal S/R level marked between the 8.04% to 7.91% level
Currently, the price action on the H1 timeframe level makes out the structure of the Bullish Double Bottom pattern level
All the EMAs acting as a Resistance level along with weak volume profile
Sent message. CRYPTOCAP:USDT DOMINANCE On the H1 timeframe level the price action converted its Bullish Harmonic Bat pattern to the Bullish Harmonic Shark pattern level where the price action is currently consolidating at its Daily Horizontal S/R level marked between the 8.04% to 7.91% level Currently, the price action on the H1 timeframe level makes out the structure of the Bullish Double Bottom pattern level All the EMAs acting as a Resistance level along with weak volume profile
#Bitcoin #nft #bnb #eth #btc #BSC #Binance #trading #altcoins #cryptocurrency #crypto

#Crypto #Cryptotrade #Cryptosignals #Cryptotrading #LoopringUSDTLoopringUSDT chart after consolidating at bottom showing a breaout
Also Rounding bottom formation at base & after small breakout again consolidating in small range from last 4-5days
Positionally looks good above 1.232 levels for positional target of 1.45/1.63 with SL of 0.81 levels
----
Note:
Above levels are for education purposes only
Do your own analysis before taking any trade

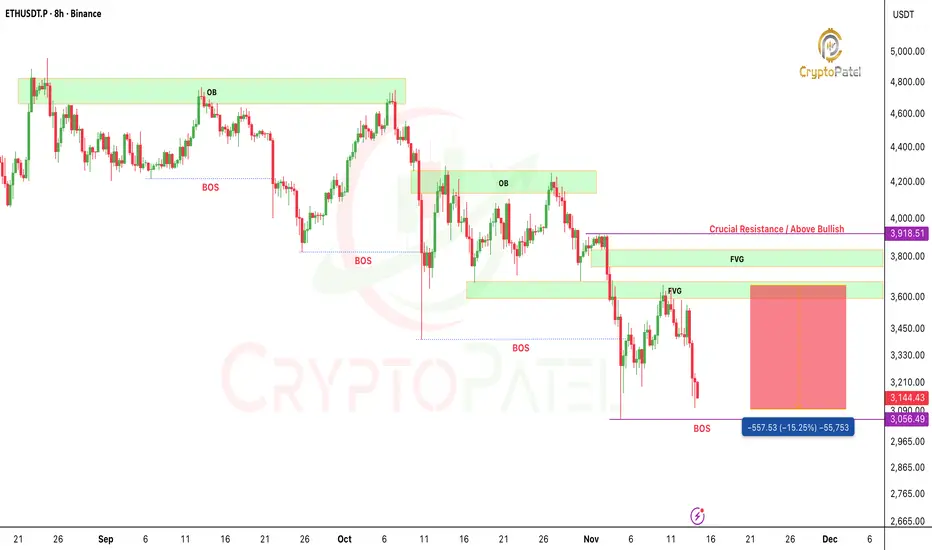
ETHEREUM Bearish Target achieved CRYPTOCAP:ETH has tapped the $3150–$3110 zone, a clean 15% move from our premium setup.
Perfect FVG fill + redistribution structure.
Huge profits for those who executed. Liquidity continues to lead.
NFA & DYOR
XRP down 10% with 48 hoursCRYPTOCAP:XRP is down 10% on the inverse chart right after the first spot XRP ETF went live in the US
This is why I kept Saying Sell the News. Markets move before headlines.
Retail moves after. That gap is where most people lose money.
NFa & DYOR

Breaking: XRP ETF to Launch on Nasdaq TomorrowBreaking: XRP ETF to Launch on Nasdaq Tomorrow
Big news for the CRYPTOCAP:XRP community!
Canary Capital has officially filed to list the first-ever Spot #XRPETF on the Nasdaq, trading under the ticker XRPC. If all goes as expected, trading could begin tomorrow.
This ETF will let U.S. investors get direct exposure to XRP through a regulated investment product, just like Bitcoin and Ethereum ETFs.
Why this matters:
🔹 It opens the doors for institutional investors to enter XRP legally and easily.
🔹 It could bring huge liquidity and more attention to the XRP ecosystem.
🔹 If the launch goes smoothly, it may spark a strong bullish move not only for XRP but also for the broader altcoin market.
Possible outcomes:
🔹 Positive: XRP price pumps as new money flows in.
🔹 Neutral: Market already priced it in.
🔹 Negative: Any delay or SEC hurdle could cause a short-term dip.
Overall, this launch could be a major milestone for XRP and the crypto market beyond BTC and ETH.
Keep your eyes on the charts tomorrow, The market reaction could be big!
NFA & DYOR

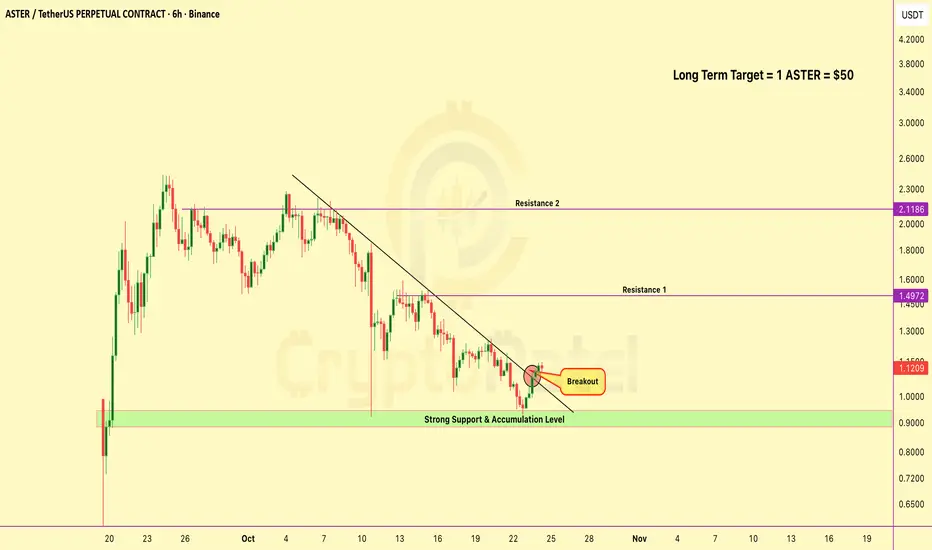
Will $ASTER hit $100 in future which is 100x from Current Price?IMO, SEED_WANDERIN_JIMZIP900:ASTER has the potential to become the next CRYPTOCAP:BNB within 4–5 years. I’m gradually accumulating for the long term.
Accumulation zone: around $1 or below, these levels may not return once the market matures.
If fundamentals and adoption grow as expected, a $50–$100 valuation in the future isn’t impossible.
Note: NFA & DYOR
Bitcoin Is Flashing a Major Warning Signal Right NowBitcoin Is Flashing a Major Warning Signal Right Now ⚠️
KEY LEVELS:
Resistance: $123K (triple top) & $115.9K barrier
Support: $106K - CRITICAL level
BEARISH PATH (if $106K breaks):
→ Target 1: $91K (-18%)
→ Target 2: $79K (-28%)
BULLISH SCENARIO:
Reclaim $115.9K & break $123K to invalidate bearish structure
STRUCTURE ANALYSIS:
▶️ Lower highs forming = Reversal signal
▶️ Weakening momentum post- New ATH
▶️ Distribution pattern visible at resistance
STRATEGY:
✅ SHORT: Below $106K | Targets: $91K-$79K
✅ LONG: Above $115.9K | Stop: $106K
The chart doesn't lie. $106K is the line in the sand.
Risk management > predictions.
Trade smart. Adapt fast. Survive longer.
CRYPTOCAP:BTC #Bitcoin
NFa & DYOR

BITCOIN DECLARED DEAD... AGAIN (498th TIME)BITCOIN DECLARED DEAD... AGAIN (498th TIME)
You know what happened the first 497 times?
It came back stronger. Every. Single. Time.
Meanwhile:
✅ Countries buying it
✅ Institutions loading bags
✅ Miners refusing to sell
But sure, THIS time it's different 😂
The graveyard is full of Bitcoin doubters. Don't be next 💀
CRYPTOCAP:BTC #Bitcoin
Note: NFA & DYOR

Bitcoin LTF Analysis & Market OutlookBitcoin LTF Analysis & Market Outlook
#Bitcoin still doesn’t look strong on LTF, and I’m expecting some more downside movement in the coming days. So if you’re holding high leverage longs, manage them carefully and always use strict stop loss.
Here’s the key structure to watch:
Resistance 1: $116,000
If CRYPTOCAP:BTC fails to break and hold above this level, momentum stays weak and we could revisit the $100,000 zone again.
Resistance 2: $122,500
Only a confirmed breakout above this level can trigger the next leg toward a new ATH around $150,000.
Until then, play defense. Avoid emotional trades, don’t gamble with your hard-earned money, and only take entries backed by clear confluence, strategy, and discipline.
Remember: The market always rewards patience, not greed. Stay alert, follow structure, and let the setup come to you.
