#USDT Dominance (USDT.D) Loses Support, Plunges to 4%#USDT Dominance (USDT.D) Breaks Support, Now Acting as Resistance with Potential Drop to 4% Key Support Area**
1. **Support Break and Role Reversal**: #USDT.D recently broke through its significant support level, which has now flipped to act as resistance. This shift indicates a potential for continued downward movement.
2. **Technical Patterns**: The previous support level is now exerting downward pressure as resistance, aligning with bearish technical patterns observed in the market.
3. **Target Levels**: With resistance firmly established, #USDT.D is poised to decline further, potentially reaching the critical support area around 4%. This zone is essential for traders to monitor as it could provide a temporary halt or reversal point.
4. **Market Implications**: The weakening of #USDT.D suggests a possible increased confidence in alternative cryptocurrencies, as funds might be flowing from stablecoins to other digital assets. This shift could indicate a broader bullish sentiment in the cryptocurrency market.
Search in ideas for "CRYPTO"

USDT.D: Identifying a Falling Wedge#USDT Dominance (USDT.D) Analysis
#Current Technical Setup
**Timeframe**: 4-hour chart
**Patterns Observed**:
1. **Bullish Divergence**: USDT.D has formed a bullish divergence, indicating potential upward momentum. Bullish divergence occurs when the price makes lower lows, but the oscillator (such as RSI or MACD) makes higher lows, suggesting weakening downward momentum and a possible reversal to the upside.
2. **Falling Wedge**: The chart is currently forming a falling wedge pattern, a bullish reversal pattern. This pattern is characterized by converging trend lines sloping downward, indicating a potential break to the upside if the price manages to break out above the upper trend line.
#### Key Resistance Levels
1. **5.18%**: This is the initial resistance level that USDT.D might encounter after a breakout from the falling wedge. It marks a significant level where the price has previously faced selling pressure.
2. **6.2%**: If USDT.D successfully breaks above the 5.18% resistance, the next major resistance level is at 6.2%. This level represents a more substantial barrier and could be a pivotal point in determining the continuation of the upward trend.
#### Support Levels and Bearish Scenario
1. **4.5%**: If USDT.D fails to sustain above the current support level within the falling wedge, it could experience a significant decline, with the next support level at 4.5%. This would represent a bearish scenario, suggesting a potential plunge in USDT dominance and possible increased risk appetite in the broader cryptocurrency market.
### Detailed Description
**Bullish Divergence**: The presence of a bullish divergence on the 4-hour chart is a positive sign for USDT.D. Divergences are powerful indicators that often precede significant price movements. In this case, the divergence suggests that despite the recent downward price action, the selling pressure is diminishing, and buyers may soon gain control.
**Falling Wedge Pattern**: The falling wedge is a well-known bullish reversal pattern. It indicates that while the price is falling, the downward momentum is slowing down, and a breakout to the upside is likely. Traders often look for confirmation of this pattern by waiting for the price to close above the upper trend line with increased volume.
**Resistance Levels**:
- **5.18%**: This level is crucial as it has acted as resistance in the past. A break above this level would likely attract more buyers, pushing the price higher.
- **6.2%**: A further move to this level would confirm the strength of the breakout. It is a more significant resistance level and could determine whether the bullish trend continues.
**Support Level at 4.5%**: If USDT.D fails to hold its current support level and breaks downwards, a decline to 4.5% is possible. This would indicate a bearish turn and suggest that traders are moving away from USDT into other assets, reflecting a more risk-on sentiment in the market.
#Conclusion
USDT.D is at a critical juncture with a bullish divergence and a potential falling wedge pattern. The key resistance levels to watch are 5.18% and 6.2%. A break above these levels would confirm the bullish outlook. Conversely, failure to hold support could lead to a decline to 4.5%, indicating a shift in market sentiment. Traders should closely monitor these levels and patterns to make informed decisions.

NOTCOIN Ready for Another Leg down?GETTEX:NOT Fresh Update & Chart Still Super Bearish ❌
IMO As per Chart Analysis We can see Small Pump toward $0.006-$0.0065 before Next leg down to $0.004
Do you own Research also before investing in Any crypto. NFA

Bullish Flag Pattern Emerging on #USDT.D The formation of a bullish flag pattern on #USDT.D (Tether dominance index) could have significant implications for the broader cryptocurrency market, particularly Bitcoin (BTC) and altcoins.
A bullish flag pattern typically occurs after a strong upward price movement (flagpole), followed by a period of consolidation (flag). This consolidation phase is characterized by lower trading volumes and a narrowing price range, forming a flag-like shape on the chart.
If USDT.D breaks out of this bullish flag pattern to the upside, it could indicate a continuation of the previous uptrend in Tether dominance. In the context of the broader market, this could mean a preference for stablecoins like USDT over other cryptocurrencies, suggesting a potential shift towards risk aversion or uncertainty among investors.
Given the inverse relationship between USDT.D and the rest of the crypto market, a breakout to the upside in USDT.D could indeed lead to a significant correction in both Bitcoin and altcoins. This is because investors may perceive stablecoins as safer assets during periods of market turbulence, leading to selling pressure on riskier assets like BTC and altcoins.
In summary, a bullish flag pattern formation on USDT.D carries implications of potential risk aversion in the cryptocurrency market, with the possibility of Bitcoin and altcoins experiencing a notable correction if the pattern breaks to the upside. Traders and investors should closely monitor USDT.D for confirmation of this pattern and adjust their strategies accordingly to manage risk effectively.

Tether Dominance #USDT.D Falls on Bearish Divergence Warning#USDT.D (Tether Dominance) has recently formed a bearish divergence pattern, signaling a potential reversal in its trend. The price has lost its support and is now heading towards a retest of the 4.5% level.
Bearish divergence occurs when the price forms higher highs, but the indicator (in this case, Tether Dominance) forms lower highs. This indicates a weakening of the current trend and a potential reversal.
The next key level to watch is the 4.5% support level. If USDT.D breaks below this level, it could indicate a further decline in Tether dominance, potentially leading to increased volatility in the cryptocurrency market.
Traders should monitor the price action closely and wait for confirmation before making any trading decisions. Factors such as market sentiment and overall market conditions should also be considered when analyzing USDT.D's movement.

#LINK/USDT Shows Strength with Bullish Divergence#LINK/USDT has recently formed a bullish divergence pattern, indicating a potential trend reversal. The price is now bouncing back towards the resistance area around $15.20. If LINK/USDT breaks above this resistance, we could see a continuation of the upward trend, potentially leading to new all-time highs.
The bullish divergence, coupled with the bounce from key support levels, suggests a strengthening bullish momentum in the LINK/USDT pair. Traders should keep a close eye on the price action around the $15.20 resistance level, as a successful breakout could signal further gains in the near term.
However, it's important to exercise caution and wait for confirmation of the breakout before entering any trades. Factors such as market sentiment and overall cryptocurrency market conditions should also be taken into consideration when making trading decisions."

RUNE/USDT 764% Up from Our Entry zoneRUNE/USDT Profit Analysis
1⃣ CRYPTOCAP:RUNE Currently 764% up from our Entry Setup
2⃣ Entry Zone: $1-$0.8 ✅
3⃣ I am Expecting $20-$30 in this bull Run
4⃣ If your Entry is Around $1 then don't forget to secure some Profit
5⃣ Strong Support = $4.10
6⃣ #THORChain is a decentralized liquidity protocol that enables cross-chain asset exchange.

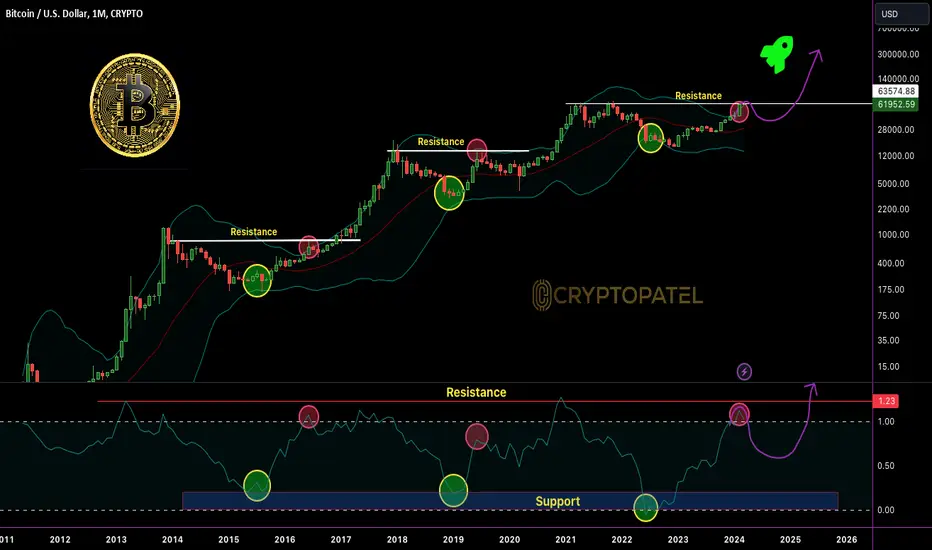
BITCOIN READY TO FLY ?The #BITCOIN party is just getting started
Bollinger bands are still tight - massive expansion ahead.
This bull run is in the early innings.
HODL on, the best is yet to come!
NFA
Bitcoin Soon $200k if ETF get to Approved ?BIG NEWS: Bitcoin Aiming for $209,000 / MIL:BTC
Get ready for a potential surge as history repeats itself:
2004: Gold Spot ETF Approval
Result: Gold Price Soared by 481%
#Bitcoin currently at $43,480
High chance of #ETF Approval in days
A 481% increase from now = $209,000 BTC
Fun Fact: #Gold never returned to its pre-approval price.
Are we in for a wild ride?

Bitcoin Current update analysisBitcoin Current Scenario:-
#BTCUSDT is bullish above $41300 Support Level.
But
Don't forget Trend will Change into Bearish if BTC/USDT Breakdown $41300 Support level.
Never forget Risk Reward and Stop Loss in Any trade.

DOT/USDT Scalp Chart Analysis for ScalpDOT/USDT Scalp Chart Analysis
Current Price: $5.19
- Anticipating a solid 8-10% upward surge!
- Strong support at $5, eyeing an entry between
$5.0-$5.20.
- Targets: $5.48 & $5.72.
- Set Stop Loss at $4.90 for risk management.

USDT.D INVERSE HEAD AND SHOLDER PATTERNUSDT.D will take correction 7.25% and it need to break 7.44% to conform inverse head and shoulder pattern , once conformation breaks we will see massive dump total crypto market. usdt target is 7.9%. so wait for the breakout.
#Bitcoin #nft #bnb #eth #btc #BSC #Binance #trading #altcoins #cryptocurrency #crypto

TOTAL 3 BEARISH SHARK PATTERN TOTAL3 clearly bearish and chance to loose support or can bounce till 380B level. in case bad economy with high interest rates can break support and next support will be 290B.
#Bitcoin #nft #bnb #eth #btc #BSC #Binance #trading #altcoins #cryptocurrency #crypto

BTC.D FORMED BULLISH SHARK PATTERN BTC.D is clearly shows bullish shark pattern and double bottom which bounced successfully from the level 40% . after that now signs are showing that it will make bearish shark pattern which can be done 65% to 70% level and it will happen in November beginning then it is a time os ALTSEASON begins.
#Bitcoin #nft #bnb #eth #btc #BSC #Binance #trading #altcoins #cryptocurrency #crypto

USDT.D WILL MAKE BEARISH SHARK PATTENUSDT.D will have most chances to make bearish shark pattern before halving bullish rally.
#Bitcoin #nft #bnb #eth #btc #BSC #Binance #trading #altcoins #cryptocurrency #crypto

USDT.D FORMING BULLISH SHARK PATTERNUSDT.D have 3 chances to move, bearish case i will movie till 6.7% to 6.45% level becoz head and shoulder pattern, if it breaks bullish becoz of bullish shark pattern and chance of good bullish divergence along with falling wedge will give the rise till 8% to 8.5% which i am expecting will happen mid of aug to end of sep. then you will see missive bullish rally of halving moon.
#Bitcoin #nft #bnb #eth #btc #BSC #Binance #trading #altcoins #cryptocurrency #crypto

ETH FORMED HEAD AND SHOLDER ETH have chance to go down if it breaks 1870 support level then we can see proper head and shoulders, so we can expect next support levels are 1740$ to 1690$ area.
#Bitcoin #nft #bnb #eth #btc #BSC #Binance #trading #altcoins #cryptocurrency #crypto

BTC BEARISH DIVERGENCE BTC clearly forming bearish 3 top pattern and RSI, MACD and SCOTH RSI are indicating negative sentiment, so chances are their for the support level from 28400$ level to 26500$.
#Bitcoin #nft #bnb #eth #btc #BSC #Binance #trading #altcoins #cryptocurrency #crypto

USDT.D INVERSE HEAD AND SHOLDER USDT.D forming INVERSE head and shoulders, if it breaks the resistance we will see bleeding in BTC and ALTS.
#Bitcoin #nft #bnb #eth #btc #BSC #Binance #trading #altcoins #cryptocurrency #crypto

$BTC | 1H: Today PlanLooking for continuation higher towards $32,000. CRYPTOCAP:BTC is truly bullish until above 31k. I'm bull as long as we hold above Monthly open. If we get a bullish retest I will try long. GL!
Previous day:
VAH: $30235
POC: $30549
VAL : $30233
Date: 14 July 2023

USDT.D BULLISH USDT.D clearly showing bullish strength @ bullish divergence and bullish shark pattern, falling wedge also formed so if it increases atls starting bleeding.
#Bitcoin #nft #bnb #eth #btc #BSC #Binance #trading #altcoins #cryptocurrency #crypto

BTC FORMING TRIPLE TOP BTC is rejecting around 31k level which mostly have chances of high selling pressure.
#Bitcoin #nft #bnb #eth #btc #BSC #Binance #trading #altcoins #cryptocurrency #crypto

ETH FORMING INVERSE HEAND AND SHOLDERSETH showing bullish pattern but it is valid when eth crosses 1940 level orals invalid.
#Bitcoin #nft #bnb #eth #btc #BSC #Binance #trading #altcoins #cryptocurrency #crypto
