Bitcoin Fresh update#Bitcoin Fresh Update:
1⃣ If CRYPTOCAP:BTC breaks $51500 then we can see GETTEX:48K & $43k
2⃣ If Break Red Line Resistance then Target would be $56k-$58k
3⃣ Trade with confirmations & Never trade Blindly
Search in ideas for "CRYPTO"

Ethereum Ready to $3000 ?#ETHEREUM Ready for $3000
As per the chart, CRYPTOCAP:ETH Broke $2380 Resistance and trading above Resistance.
We can see $3000 in a Few Days but Must hold $2340 Support.
#Cryptocurrency

XRP/USDT RIPPLE Ready for $10 in bull market ?#XRP/USDT Bull Market Technical Analysis:
➡️ Last bull #XRP seriously underperformed while stuck fighting the #SEC
➡️ BTC hit new highs while XRP failed to pass 2017's $3.30 ATH
But with the SEC case now won - the floodgates may finally BE OPEN!
➡️ Similar triangle breakdown to 2017 is FORMING!
➡️ If 2017's 40,000% pump repeats - we could see mind-blowing $10+ XRP!
➡️ Survived 2,291 (6+ Years) brutal bear days - this coiling pattern signals Ripple's ready to ERUPT!
My Accumulation Zone: $0.40 - $0.50
Targets: $0.90/$1.95/$4/$7/$10+( bonus )
If you believe in parabolas, triangles, and cycles - CRYPTOCAP:XRP may be on the launching pad again here!!

Ethereum Ready for Another Dump till $1700 ?Ethereum Chart Technical Analysis CRYPTOCAP:ETH
Currently #ETHUSDT Trading at 4H Support Level.
1️⃣ If $2160 level breaks, ETH could drop to $1,750 (Scenario 1)
2️⃣ But if price bounces off $2,160, we could see a 5-10% relief rally. ( Scenario 2 )
My view:
- Bearish below $2,240
- SUPER bearish if $2,160 breaks!
Overall, #ETH is standing on thin ice at a very crucial support zone.
One break could lead to a cascade of selling.
Trade safe!

Bitcoin LTF Chart Analysis#BITCOIN LTF Bearish Update:
CRYPTOCAP:BTC Currently Trading in Bearish as per Fractals.
If this Bearish Fractals work then Next Stop will be at $36800
Current Sequence According This Fractals:
$40800 ➡️ $36800 ➡️ $38800 ➡️ $35000
Note: LTF Fractals Invalidated if #BTCUSDT 2H candle Closed above $41000

Bitcoin Ready for $30700 ?#Bitcoin Fresh Update:
CRYPTOCAP:BTC Ready for Another -25% Dump if $41600 Level not Breakout upward Side.
I am Planning to Buy More #BTC around $30,000
I'm Short Term Bearish & Long Term Bullish.

Bitcoin ( $BTC ) Surges Past $45,000 for First Time Since April Bitcoin ( CRYPTOCAP:BTC ) Surges Past $45,000 for First Time Since April 2022!
In the early hours of the day, Bitcoin's price surpassed $45,000 for the first time since April 2022, driven by expectations of a U.S. Securities and Exchange Commission ( #SEC ) approval for a spot Bitcoin exchange-traded fund (ETF).
Are you ready for the next wave of crypto growth?
Strong Resistance: $48600-$50600
#Bitcoin #Crypto #ETF #BitcoinETF

Bitcoin Ready for $51000 or $31000 ?CRYPTOCAP:BTC Chart Analysis:
Bitcoin Bull Flag:
Chart pattern suggests bullish trend with targets of $48000-$52000.
However, #Bitcoin is heavily influenced by #BitcoinETF news, so caution is advised.
What to do?
If BTC/USDT holds above $41000, a bullish run to $48000-$51000 is possible.
But, a breakdown below $41000 could quickly lead to $31000.
Remember: Always trade with the trend and confirmations, never gamble.
#BULLRUN2024

Ethereum Ready for $3000 or $1500 ?CRYPTOCAP:ETH Chart Pattern:
#Ethereum price is currently experiencing a bullish pattern in higher time frames, forming both a symmetrical triangle and a bull flag.
The breakout and subsequent retest of the support level have been confirmed, indicating a potential target of $2,800.
However, if the price of #ETH breaks down below the $2,240 support level, it could turn bearish, potentially dropping to the $1,900-$2,000 range.
It is always important to trade with caution, considering the trend and confirmations before making any decisions.
#TRBUSDT #BULLRUN2024 #HappyNewYear

Bitcoin Ready for $50,000 ?#Bitcoin Bull Flag Analysis: CRYPTOCAP:BTC
Breakout Point: $44000
Targets: $48000-$50000
Note: Chart Invalidated and Reverse if Break down $41000 Level.

Ethereum Symmetrical Triangle Chart Analysis #Ethereum Symmetrical Triangle Analysis CRYPTOCAP:ETH
#ETH is currently forming a symmetrical triangle, presenting a potential breakout or breakdown scenario.
A successful breakout above the $2340 level indicates a bullish trend till $3000 Target.
But
Conversely, a breakdown below the symmetrical triangle support at $2200 suggests a bearish trend And Traders should be prepared for a potential retest of the $1500 level in this scenario.
- Avoid Blind Trades:
- Trade with confirmed signals.
- Utilize technical analysis for precision.

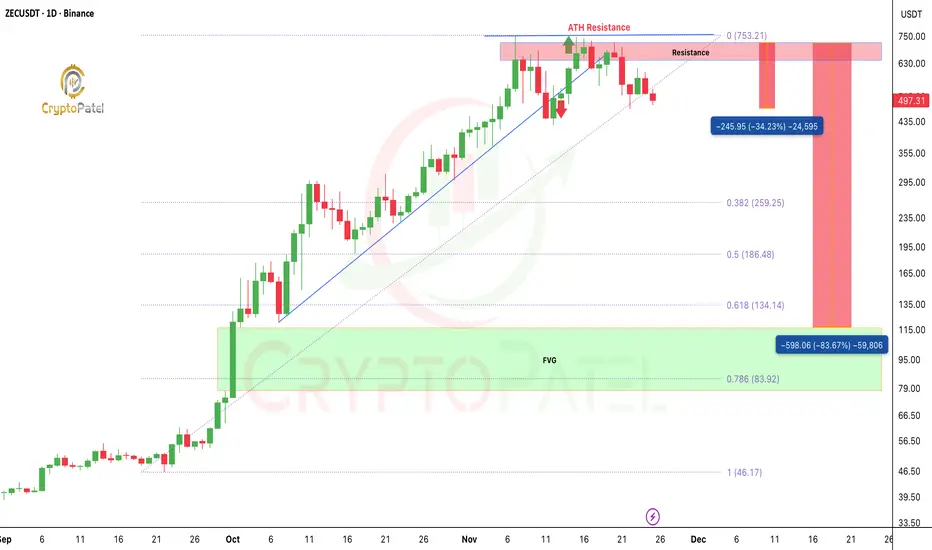
UPDATE: $ZEC Playing Out EXACTLY As WarnedUPDATE: CRYPTOCAP:ZEC Playing Out EXACTLY As Warned
ZEC tagged the $700 HTF resistance and dumped 35%+ right from the level I highlighted earlier.
The move toward the $100 zone is unfolding step-by-step, exactly what the HTF structure hinted at.
I’m not saying ZEC can’t reclaim $700 and even squeeze toward $1,000 again…
But the risk is extremely elevated up here. Smart money enters where risk is low + reward is high, not at euphoric tops.
This is NOT a short signal.
This is awareness analysis, don’t jump into high-leverage longs blindly in a corrective environment.
My Radar Levels: $259 / $186 / $134
Invalidation : Any HTF candle closing above $760
Stay disciplined. Protect capital. Market always rewards the patient, not the emotional. NFA.
$NEAR Ready for a Massive Breakout: Next Stop $20+ Incoming CRYPTOCAP:NEAR Ready for a Massive Breakout: Next Stop $20+ Incoming
The chart structure looks absolutely explosive right now! $NEAR/USDT has bounced hard from the triangle support, confirming strength and signaling that a massive rally is brewing.
I’ve been accumulating heavy in the $2.50 - $1.90 zone, expecting a big breakout rally ahead!
Targets: $7.70 / $16.70 / $30 / $50
If CRYPTOCAP:NEAR can smash through the $5 resistance, get ready for a vertical flight toward $20+, with long-term eyes on $50
Why I’m ultra-bullish:
✅ Strong recovery from key support zone
✅ Bullish triangle breakout structure
✅ Volume uptick showing accumulation
✅ Momentum shifting rapidly toward bulls
Chart invalidation below $1.50, but above that, it’s looking unstoppable. NFA & DYOR

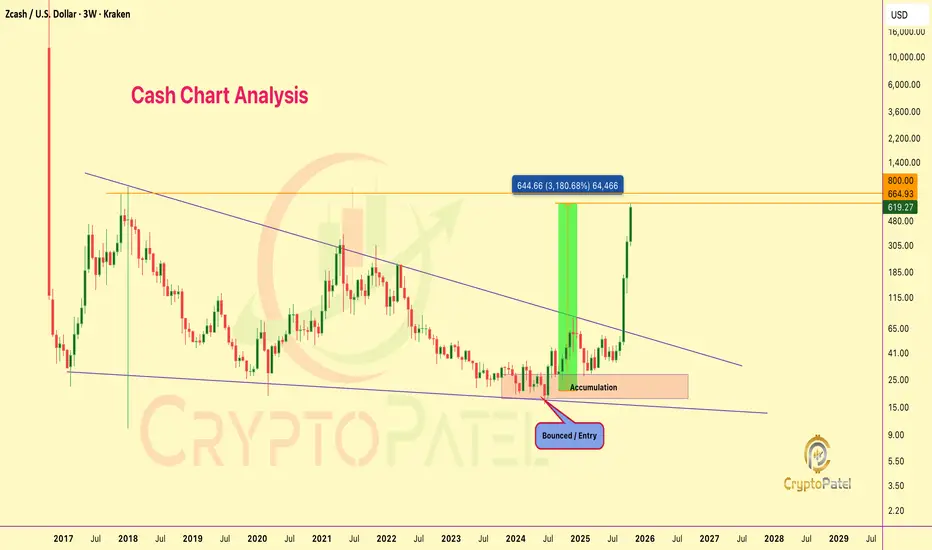
When I called $ZEC at $20, they laughed. Now it’s $662. When I called CRYPTOCAP:ZEC at $20, they laughed. Now it’s $662. Still think I’m crazy?
From our call at $20–$24, CRYPTOCAP:ZEC just went insane: Now at $662 🤯
That’s a massive 3100% GAIN from entry.
I told you legends about that $800 target, and we’re almost there!
Hope you’re counting profits and maybe ordering that new LAMBO already 🏎️
Who believed when I said #Zcash would rise again?
NFA & DYOR
Will TRON hit $2 in this bull run?If CRYPTOCAP:TRX loses $0.26 I'm deleting this tweet. If it holds? We're going to $2 💎
Currently: $0.26 ✅
Target: $2.00 🔜
Upside: 600%
Bulls in full control and NOT losing this level 💪
Screenshot this tweet
NFA & DYOR

Bitcoin is just 2% away from a new all-time high —will it break?Bitcoin is just 2% away from a new all-time high — will it break or fake? 🚀
BTC is currently trading near $109K–$110K, only 2% below the $112K ATH level.
Strong supports: $94,000 / $80,000
Bullish Case:
If BTC breaks $110K–$112K with strong volume + a bullish weekly close → we could see a rally toward: $135K → $150K
Bearish Case:
If BTC rejects at $110K–$112K, a deep retracement below $100K is possible. Watch for strong support at $100K and $80K levels.
My Personal Take:
I'm bullish overall — but since we’re this close to ATH, I’m opening a short trade with 3% stop loss targeting near $100K.
👉 Not financial advice — do your own research. The crypto market is highly volatile.
Watch this level closely — next big BTC move may be starting NOW. 👀

Why Is Hamster Kombat ($HMSTR) Dumping Hard?Why Is Hamster Kombat ($HMSTR) Dumping Hard? Here’s What’s Happening 👇
Hamster Kombat ($HMSTR) was one of the most anticipated airdrop tokens this year — but after going live, the token is now seeing a steep decline.
Here are the main reasons behind this big dump:
▶️ Massive Airdrop Sell Pressure
→ Over 131M users received free tokens
→ Many are selling immediately to lock in profits
→ Top wallets (insiders) are also unloading heavily
▶️ Weak Tokenomics
→ Circulating supply ~64B, max 100B
→ More tokens set to unlock = more selling expected
▶️ Community Frustration
→ Many users reported unfair airdrop mechanics
→ Only 88.75% unlocked at launch
→ Trust in the project took a big hit
▶️ Technical Issues
→ Telegram wallet & TON blockchain faced glitches during trading
→ Early trading experience was poor → More sell pressure
▶️ Tap-to-Earn Model Fatigue
→ The tap-to-earn hype is fading
→ Most players are cashing out, not holding or building
▶️ Bearish Chart Structure
→ Broke key support (~$0.00235)
→ No bullish signals yet — latest low ~$0.001214
Bottom line:
Right now, $HMSTR is following the typical pump & dump cycle we’ve seen with other tap-to-earn tokens. Until trust is rebuilt and real utility emerges, expect cautious trading ahead.
👉 Are you holding $HMSTR or watching from the sidelines?
#HamsterKombat #HMSTR #CryptoNews #CMC #Altcoins

When Altcoins Bounce From 99% Down... They Don’t Just Recover, When Altcoins Bounce From 99% Down... They Don’t Just Recover, They Moon
Structure Analysis:
SEED_DONKEYDAN_MARKET_CAP:ILV has been in a multi-year downtrend but is now showing signs of a potential macro reversal.
Accumulation Zone:
Price has been consolidating between $9.63 – $13.75, forming a strong base. Multiple rejections from this zone suggest heavy demand and smart money accumulation.
Downtrend Break Incoming:
A breakout above the descending resistance trendline would confirm a trend reversal and open the gates for a major rally.
Key Resistance Levels Ahead: $71.32/$185.56/$322.15/$672.19 (Previous ATH)
Major Resistance Zone: $31.74 – $37 (expect some sell pressure here on the way up)
Trade Setup Idea (Mid to Long Term):
Entry Range: $11 – $14
Stop Loss: $9.63
Target: $31.74/$71.32/$185.56/$322.15/$672.19
Potential Gains:
▶️ 10x looks highly possible if momentum builds.
▶️ If ILV reclaims its previous ATH, returns could reach up to 180x
▶️ Already down ~99.5% from ATH — this makes it a high-risk, high-reward setup.
Yes, 180x sounds insane, and it nearly is—but this is crypto. Anything can happen. That said, high reward comes with high risk. Always DYOR (Do Your Own Research), manage your risk, and remember: This is not financial advice.

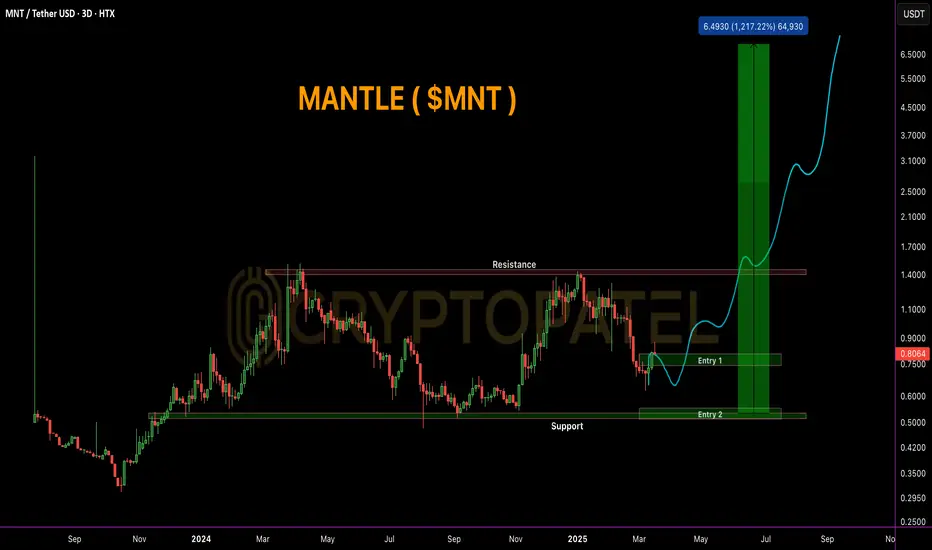
$MNT Technical Analysis – Road to $8? 🚨 TSX:MNT Technical Analysis – Road to $8? 🚨
🔹 Market Sentiment: High potential in #Altseason with TSX:MNT being a key contender. Likely $TRUMP's World Liberty Pick, adding more bullish conviction.
🔹 Best Accumulation Zones:
📍 Entry 1: $0.80 - $0.70
📍 Entry 2: $0.55 - $0.50
🔹 Targets:
✅ $1.40 – First breakout test
✅ $3.00 – Mid-range bullish target
✅ $5.00 – Major resistance flip
✅ $8.00 – Full altseason target
⚠️ Risk Management: Below $0.50, I do not recommend holding. Always manage risk & secure profits at key levels.
💡 Conclusion: TSX:MNT has strong upside potential, but NFA – DYOR before investing.
#Mantle #MNT #Crypto #Altseason
Ethereum Accumulation Alert! 🚀 Ethereum Accumulation Alert! 🔥
Ethereum is entering a potential spring accumulation zone, presenting a solid long-term opportunity.
📉 Buy Zone: $1,900 – $1,550
🎯 Targets: $5,000 / $7,500 / $10,000
🔹 Key Support: $1,550 – Holding above this level keeps the bullish structure intact.
🔹 Breakdown Risk: If ETH loses $1,550, expect further downside toward sub-$1,000, where the next strong entry lies.
📊 Smart money is accumulating—don’t miss the dip!
#Ethereum #CryptoTrading #Accumulation #ETH #NFA #DYOR

#TRON to $1? Highly Possible! But Gold Entry is Key #TRON to $1? Highly Possible! But Gold Entry is Key 🚀
📉 Best Accumulation Zone for CRYPTOCAP:TRX : $0.140 - $0.10
🏆 Patience & Strategy Win the Game!
NFA. DYOR!
CRYPTOCAP:TRX #Altcoins

TRON Bull Market Performance Over the Years:#TRON Bull Market Performance Over the Years:
2017 Bull Market: 🚀 +23,800%
2021 Bull Market: 🚀 +1,650%
2025 Bull Market: +900% till now
My Take: TRX/USDT is $1 Potential But CRYPTOCAP:TRX has likely delivered most of its returns already. While it may pump again, don't expect massive gains in this cycle.
📊 IMO, $0.60 is a good exit range. Anything above $0.6 would be a bonus!
NFA & DYOR
#TRX #Crypto

Bitcoin Poised for $94K: High Bullish Momentum AheadBitcoin is currently forming an ascending pattern, signaling a potential bullish market. Additionally, the RSI has formed a bullish divergence, and the decreasing selling volume supports this outlook. If the breakout occurs successfully, we could see Bitcoin reach $94,000.
#Bitcoin #Crypto #BullMarket #BTC #RSI #CryptoTrading #TechnicalAnalysis #CryptoBullRun
