CRYPTO: HOLO (HOT) LONGChart is self explanatory
There are two strategy to enter in the script :
1. Buy at CMP and then Average around 0.012000
2. Buy around 0.013000
Kindly see which strategy suited you the best. Personally I will go for first strategy
The highlighted range was earlier acting as profit booking zone now it is acting as supply zone.
Fundamental:
Holo is one of it's kind, it uses holochain instead of blockchain. which means in upcoming future this can be a leader in holochain tech.
Disclaimer: This view is for only educational purpose.
Search in ideas for "CRYPTO"


CRYPTO TOTAL MARKET CAP: $5 Trillion on the Horizon?The Total Crypto Market Cap has confirmed a strong bullish breakout from a long-term descending trendline on the weekly timeframe, signaling a major shift in market structure. Following this breakout, the market is now undergoing a constructive retest of key support levels around the $3T zone—a typical and healthy phase before continuation.
Momentum indicators such as the RSI (currently above 56) and the positioning of weekly moving averages further reinforce the strength of this uptrend. With price action maintaining higher lows and consolidating above previous resistance, the crypto market appears well-positioned for good growth in the coming months to $5 Trillion+
Check out my last post here:
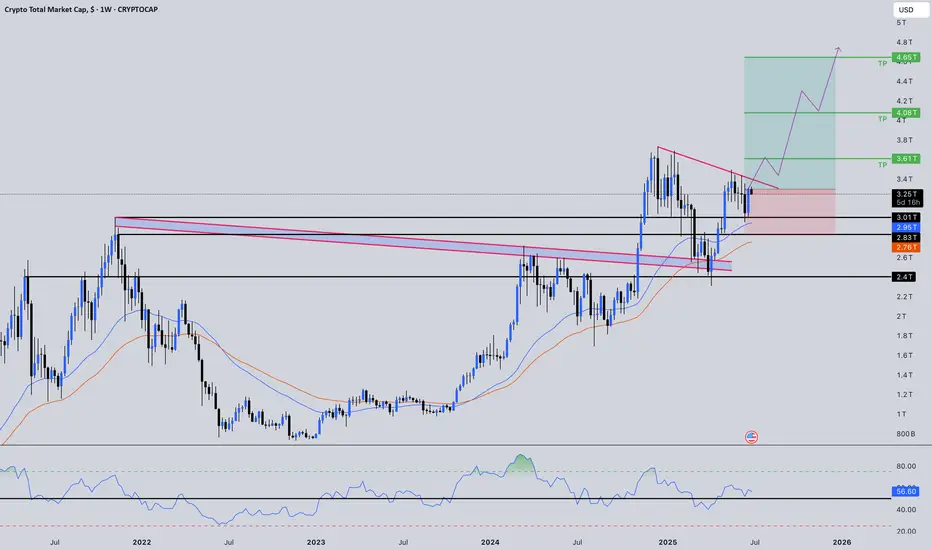
Crypto Total Market Cap: Ready for expansion to $5 Trillion!⚡️Price Analysis:
1️⃣ Trendline Support.
2️⃣ The overall structure is Bullish.
3️⃣ Price showing bounce from EMAs
4️⃣ BO & RT done of the previous ATH level.
✨ Key Observations:
➡️ Expecting price to push higher to form a higher high.
➡️ Currently, RRR is very attractive
➡️ Good momentum post 3 trillion mark can be seen
⚠️ Disclaimer: This is NOT a buy/sell recommendation. This post is meant for learning purposes only. Views are personal. Please do your due diligence before investing. Also, Crytos are highly volatile assets; act accordingly & manage your risk always.⚠️
💬 What's your view on cryptocurrencies? ✌️
🔥Happy Trading!✅🚀

Crypto trading challenge (BTC SHORT)took this trade earlier, my poi will be towards 16500's for now to start looking for any longs !
i try to stick to basic pa with minimal help of technical analysis for taking all my trades. also , for this trade, i had set a limit order because it was a high conviction setup even though usually im against it.
will keep updating the challenge here occasionally!

Bitcoin Support Cryptos are crashing like anything.
I’ve used XABCD pattern in conformation with ABCD to find the support of Bitcoin by Harmonics.
35-40% crash is still left.
Shall buy at the bottom.
10300-10600 USD may be very precise range for bottom, (8.3-8.6 lacs- INR)

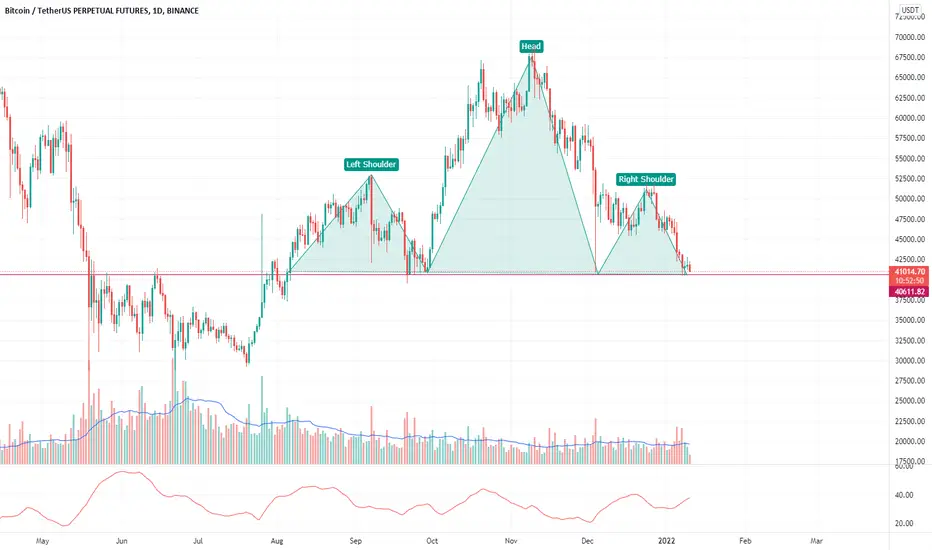
BTCUSDTPerp showing Head and Shoulder patternCryptos have been dumping pretty hard and it seems BTC is still not out from the bearish grasp
Crypto currency technical strategyits for education purpose of the crypto currency technical aspects of the crypto

CRYPTO : BitTorrent (BTT) LongChart is self explanatory
Entered at CMP. with stop loss closing below trendline
Highest Ever Volume Recorded last week
Disclaimer: This view is for only educational purpose.

Verasity [VRA]- Crypto : VRAUSDT
- Weekly Chart
- Sustaining above Weekly Highest Closing level
- Decent upside potential
- Position Sizing & Risk Management

Crypto Marketcap bounce nicely from support, what next?Technical Analysis: Total MarketCap (Update)
In Daily timeframe Chart, Crypto Total Market Cap is Moving Above the Strong Support (1.32T) and did not want go further down
If Crucial Support Broken Down then Next STOP Could be 832bln (So We Could see Crash in Coming Days)
In Bullish Case, If MarketCap Remains Above the Support, Expecting Bounce Back towards the 1.72( 50 DMA)
RSI made bullish hidden divergence and slowly slowly increasing thats means bull seams strong now, it could probably break daily down
trend which is minor resistance as well as 21 DMA (1.50 T).
❤️ If you find this helpful and want more FREE forecasts in Tradingview.
. . . . . Please show your support back,
. . . . . . . . Hit the 👍 LIKE button,
. . . . . . . . . . Drop some feedback below in the comment!
❤️ Your Support is very much 🙏 appreciated!❤️
💎 Want me to help you become a better Crypto trader?
Now, It's your turn!
Be sure to leave a comment; let me know how you see this opportunity and forecast.
Trade well, ❤️
#totalmarketcap #crypto #nextmove #bullmarket #sideways #bitcoin

[CRYPTO] Buy WINGBTC Around 680Wing looks good at these levels for marked targets with green lines until 640 is intact on a closing basis.
To motivate me, Please like the idea If you agree with the analysis.
Happy Trading!
InvestPro India Team

Cryptocurrency Going Below 2 Trillion... 😭The charts are now changing... This is the total cryptocurrency market capitalization, Bitcoin + Altcoins.
Today, we have the highest volume, bear volume/red, since February 2021.
Yesterday, TOTAL close below EMA10 and EMA21 with EMA50 being tested today.
We have bearish cross on the MACD and the RSI is dropping...
The whole cryptocurrency market capitalization is going lower. Not nice.
From 2.072 T to 1.767 T soon.
After this level is hit which also coincides with EMA100, we will know what might come next.
Lower or bounce back up?
I like to believe that it will bounce but I don't know... For now, the whole market capitalization is about to drop.
Conditions for change
We would need to see TOTAL move and close above EMA21 in the least for the bulls to be able to consolidate and recuperate, not very likely at this point.
Corrections are part of the market...
In April, we had 9 days of correction.
In March, we had 6 days.
In May, we have 2 days so far including today... It can go for much longer or it can reverse right away... But the signals are pointing lower...
What's your take?
Leave a comment in the section below.
How long will this market correction last?
For a few days?
Multiple weeks?
Or months?
Share with us.
Namaste.

[CRYPTO] ONTBTC LOOKS GOOD AROUND 4200ONT looks good around 4200 levels for marked targets with green lines until 3800 is intact on a closing basis.
To motivate me, Please like the idea If you agree with the analysis.
Happy Trading!
InvestPro India Team

[CRYPTO] BUY KNCBTC AROUND 6070KNC looks good around 6070 these levels for marked targets with green lines until 4780 is intact on a closing basis.
To motivate me, Please like the idea If you agree with the analysis.
Happy Trading!
InvestPro India Team


Crypto:- Btcusd ForecastHello Crypto Friends,,
Again we add sell analysis for Btcusd.
1) When you think how much down...??
Ans) We don't know how much point down in upcoming, but now Btcusd down we think.
2) Now which place you trade for sell??
Ans) Btcusd best selling level 60250/60950 price. But we recommend 60150 above to start sell. Every upper 0.01 value lot size you trade Btcusd. But how much distance sell add, so we recommend 30 to 90 point distance level sell add.
3) How much tp & SL add??
Ans) Btcusd per 30 to 90 point distance level (60200 above) you sell add. So your tp per level 190 Point to 370 point and SL same but maximum 1000 point it okay. Midum time trading 500 to 1000 point good for tp & SL.
4) When fully this sell analysis stop?
Ans) We Btcusd resistance add 61500, so if it broke, then stop our this analysis.
HOPE U UNDERSTAND OUR ANALYSIS. IF YOU DON'T UNDER SO ASK.
IF YOU LIKE OUR ANALYSIS , SO PLS CLICK THE LIKE BOTTOM ADD STAY WITH US.

Rectangle nearing breakout levelCrypto small cap marketcap is currently in consolidation in rectangle and breakout is expected soon as Altcoin marketcap has broke major resistance.

ETH/USDT:- Bullish Momentum Building Towards 1760-1770 Levels ?In this technical analysis, we delve into the current market trends of the ETH/USDT trading pair. The Ethereum cryptocurrency has shown promising signs of bullish momentum, with key buying and selling levels identified for traders to consider.
Buying Area at 1760-1780 Levels:-
Ethereum's recent price action reveals a strong support zone between the 1760-1780 levels. Traders looking to establish long positions can consider accumulating Ethereum within this range, aiming to capitalize on potential price appreciation.
Price Targets at 1950-1960 Levels:-
The ETH/USDT pair is exhibiting a promising uptrend, with price targets set at the 1950-1960 levels. It is essential to monitor price movements closely, as a sustained breach above this range could trigger further gains.
Bullish Order Block Opportunity:-
An intriguing opportunity arises from the presence of a bullish order block at 1760-1770 levels. This block signifies a strong demand area, highlighting the potential for upward price movement. Additionally, if the market corrects itself and ETH/USDT retraces to the 1650-1680 levels, astute traders can consider this a "buy for bag" opportunity.
By staying informed about these key levels and potential opportunities, traders can position themselves for success in the dynamic world of cryptocurrency trading. Follow us on Trading View for real-time updates, in-depth analyses, and actionable insights to enhance your trading journey.

MATIC/USDT: Anticipating Bull Journey After a Corrective Phase ?In this technical analysis, we will examine the MATIC/USDT trading pair's recent price action and chart patterns.
1. Resistance Area - 0.8000-0.8150:
MATIC/USDT has been facing a significant resistance area around 0.8000-0.8150. Multiple attempts to break above this zone have resulted in pullbacks. Traders should closely monitor this level as a successful breakout could trigger a bullish rally. .
2. Expected Corrective Phase and Potential Buying Zone - 0.5500-0.6000:
Based on our analysis, we anticipate a corrective phase for MATIC/USDT in the near term. This retracement could find support around the 0.5500-0.6000 region, a crucial buying zone.
Traders looking to enter long positions may find this level attractive as it aligns with historical support and offers a favorable risk-to-reward ratio.
3. Continuation of Higher Lows Patterns and Liquidity Sweep:
Despite the resistance, MATIC/USDT has been forming higher lows, indicating potential bullish momentum. However, before resuming its upward trajectory, the price might perform a liquidity sweep towards the 0.5500-0.6000 support zone.
Such a move is a common occurrence in crypto markets and should not be mistaken for a trend reversal.
Conclusion:
In conclusion, MATIC/USDT presents an intriguing trading opportunity for followers of our Trading View ideas. The resistance area of 0.8000-0.8150 and the expected corrective phase towards 0.5500-0.6000 make for crucial decision points. Traders should exercise patience, wait for confirmation signals, and manage risk effectively for potential gains towards 0.9000 and beyond.

BTC | 1H: Today Plan
Is the CRYPTOCAP:USDT Fud Gone? $25,000 Buy wall was filled. Expect CRYPTOCAP:BTC to hit Weekly open(26k) by the end of this week. Looking for a pullback to YVAH for a better long entry. LFG!
Previous day:
VAH: $25296
POC: $24989
VAL : $24867
Date: 16 June 2023

BTC Bullish Outlook: Riding the Wave to $170K in 2026CRYPTO:BTCUSD
Asset: BTC/USD
Timeframe: Weekly
Hey traders! 🚀 With Bitcoin kicking off December on a softer note around $85K, the market's digesting some Q4 turbulence, but we're eyeing a major reversal. Drawing from JPMorgan's fresh take, BTC could mirror gold's trajectory and surge to $170K within the next 6-12 months. That's an 84% upside from here—don't sleep on this!
Key Analysis:
Macro Tailwinds: BTC's negative correlation with the USD is flashing green as the dollar weakens. Pair that with its risk-on dance with stocks (watch Nasdaq for cues), and we're primed for a breakout.
Technical Setup: We've got support holding firm at the $80K psychological level—classic round-number magnet for BTC. RSI is oversold on the daily, MACD showing divergence, and options data screams "range-bound now, explosive later." Break above $90K, and it's game on toward the next roundie at $100K.
Risks: Short-term chop if stocks wobble further, but long-dated option builds suggest stability before the boom.
Trade Signal:
Entry: Long BTC/USD at $82,000 (confirmation above $80K support).
Target 1: $100,000 (short-term, ~20% gain).
Target 2: $170,000 (JPM moonshot by mid-2026).
Stop Loss: $75,000 (below key support to protect downside).
Risk/Reward: 1:3+ on the primary target. Position size: 1-2% of portfolio.
Chart snapshot: Imagine a weekly candlestick with a bullish engulfing at $80K, Fibonacci extensions pointing to $170K, and gold overlay for that JPM vibe. (Pro tip: Overlay GLD on your BTC chart for visual confirmation!)
Idea by Signal Squad
Published: December 8, 2025
What do you think, squad? Bullish breakout or more consolidation? Drop your thoughts below—let's discuss! #BTC #CryptoSignals #SignalSquad

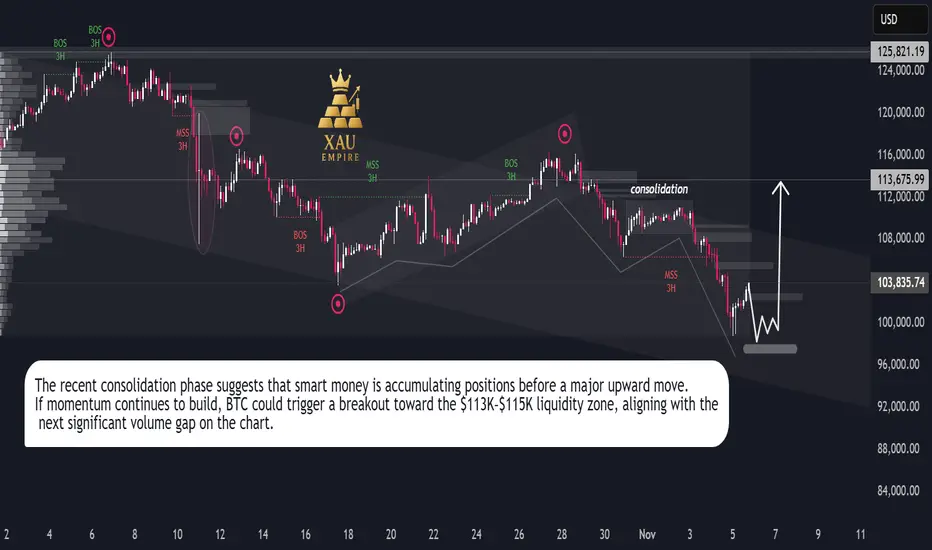
Bitcoin Bulls Target $113K**Bitcoin (BTC/USD) Analysis — November 2025**
Bitcoin has been moving within a controlled downtrend channel, facing continuous lower highs since late October. The market recently went through a **liquidity sweep**, followed by a minor **market structure shift (MSS)** on the 3-hour timeframe. This suggests exhaustion in the current bearish leg.
After a period of **sideways consolidation**, price is testing a strong accumulation zone near the **$100K–$97K** region. This zone aligns with prior demand and high-volume nodes, making it a potential base for a bullish reversal.
A clean rebound from this level could drive Bitcoin toward the **$113K–$115K** area, where the next liquidity cluster sits. If buyers regain momentum, this move could accelerate into a **V-shaped recovery**, confirming the start of a fresh mid-term bullish cycle.
Overall sentiment remains **bullish**, supported by renewed buyer activity and potential macro-driven inflows ahead. Traders should watch for volatility spikes as the market transitions from accumulation to breakout mode.
**Key Takeaway:**
BTC is stabilizing near key demand, eyeing a rebound toward $113K+. Momentum confirmation above the short-term consolidation zone could trigger a strong upward continuation.
**#Bitcoin #BTCUSD #CryptoAnalysis #BitcoinForecast #BTCPricePrediction #CryptoTrading #BullishReversal #CryptoMarket #TradingViewAnalysis**