ron crypto has displayed a sign of revivalThe price performance of Tron highlights a good performance on the chart in the quarter by 12.11% respectively. But, this week's and month's performance was not good as it deteriorated with a -5.79%, and -13.91% respectively, its price dropped to form a support at $0.110.
The Tron asset is showing bullish traits and is experiencing a minor decline of -1.35 % in the last 24 hours, currently trading at $0.118, this displays that it can achieve more growth in the coming session.
The recent price structure of Tron crypto has displayed a sign of revival as the price showed a spike from a critical level of around $0.110 on the chart.
The TRX asset is showing bullish strength and rising potential as it is on its way to cut the 20-day EMA and 50-day from below. In the same way, the Tron asset shows positivity as the histogram is declining, which is causing the gap between MACD and the signal line to converge.
Likewise, the RSI displays a u-turn in its curve, suggesting that the TRX asset has more room to grow, as it has crossed 14-SMA from below, these conditions signify bullishness.
Therefore, if the demand for the Tron asset price rises, it could bounce back from the current level. The next target for the price is to reach $0.126, and $0.132.
However, if the TRX crypto price fails to stay above the $0.110 level, it could decline further, and breaking this support will lead to lower depths.
Search in ideas for "CRYPTO"

ShibaDoge CryptoThe ShibaDoge crypto price is down nearly 3.46% in Intraday and currently trades close to 0.00016 USD.
The SHIBDOGE price has broken below the 20 day exponential moving average suggesting weakness over the daily chart.
The ShibaDoge crypto is on a four day losing streak and is continuing its move towards the south on Saturday. The bears seem to be strong at the moment as the price has made a breakdown below the 20 day exponential moving average.
Earlier, the SHIBDOGE crypto experienced a short term bull run in the 1st week of March 2024 and surged 130% a week. The short term gain triggered a profit booking among the short term traders and Investors and the price dropped.
The 20 day EMA acted as a dynamic support and tried to halt the further decline. The bulls could not hold more and the crypto made a breakdown after witnessing a short term consolidation near it.
Currently, the bears seem to have won the short term trend control as the price has broken below the 20 EMA. The price is headed towards the 50 day EMA at $0.000159. On the lower side, the $0.00016 is the previous breakout zone which may act as a support and try to prevent the further fall.

The Pi coin price structure shows that the crypto had been in a The Pi coin price structure shows that the crypto had been in a consolidation phase for a long time on the daily chart and was bound in a range.
However, the price action showed a spike as big as a skyscraper on the chart, and the price breached the resistance level of $42 reached the top of $135, and broke in between hurdles like $50, $60, $73, $86, and $104 in the hurdle.
The overall price indicates a pump-and-dump kind of situation, as its surged gains have plummeted on the chart and are back to the support at $42, which was an earlier resistance.
The price-performance exhibits that, in the last week price plunged -55.94% and an intraday loss is -0.45% with a current price at $42.22.
Moreover, the PI coin asset is displaying bearish characteristics as it has been trading below EMA bands, MACD shows a bullish cross with histogram increasing downwards, and the RSI is falling smoothly by taking rejection from 14-SMA, implying that the asset is losing momentum and can achieve new depths.
Therefore, if the demand for the asset declines then buyers will lose more traction and could slip the holding of the $42 support level and after destroying this level of support, the price could end up back in the previous consolidation range.
On the flip side, the game can change entirely and different possibilities can occur, only if demand increases abruptly this could make the PI coin bounce back from the level and could give targets like $50.0 and $60.0 easily.

The EGO crypto price aaction has revealed strong recoveryThe EGO Token has been addressing bullish scenario from quite some trading sessions, and has shown exponnential growth so far over the daily chart.
The EGO crypto price aaction has revealed strong recovery as the price rallied abruptly from a crucial level of around $0.4500 on the chart and showed massive gains in its price and has jumped previous resistance high at $0.11700.
On the further note, based on the recent price structure on EGO chart, it appears like the crypto is set for breaking more resistance level and rocket to new peaks around $0.15107 and $0.20017 from the current support zone.
The EGO asset is showing bullish signs and displays enormous potential to grow further ij the coming sessions. During the previous sessions, it has performed well in the past week by 57.92%, and month by 215.42%, indicating a strong uptrend.
At the time of writing, the EGO crypto is experiencing a surge of 13.00% in the last 24 hours, and the price is currently trading at $0.12010.
Therefore, if the demand for this EGO token remains high, the asset price could continue advancing. However, if the crypto price fails to stay above the $0.10500 level, it could decline further and the present condition of price could reverse as well.

The BOME crypto looks like it is set for a colossal surgeThe volume analysis shows that the BOME cryptocurrency has received $5.19 Billion in volume, on March 17th 2024. The price vs Volume charts describe a hefty surge in volume on 17th, along with the price rise. But, the price failed to climb higher and price started to plunge along with the volume.
The current volume of BOME is 1.7 Billion, and the price is at $0.0122, this data shows that the volume is seamlessly declining and has came to a point where it is showing sustenance sign.
BOME price Action Analysis Over Daily Time Frame
However, the crypto has revealed a sign of recovery as the price rallied from a crucial level of around $0.010 on the chart.
The BOME crypto looks like it is set for a colossal surge, as it gears up to crack the hurdle price levels above and could rocket to new peaks from the current support zone.
The Book of Meme crypto is experiencing a surge of 20.65% in the last 24 hours intraday session, and currently trading at $0.0122.
Therefore, if the demand for the BOME surges the asset price could bounce back from the current level. The next goal for the price is to reach $0.0300 and primary resistance would be $0.0200.
However, if the crypto price fails to stay above the $0.0100 level, it could decline further and reach lower levels.

👑Bitcoin Analysis: Trading Amid Price Correction📉🔍Today is Tuesday, and it's a favorable day for trading. The cryptocurrency I'm analyzing today is Bitcoin. In the initial candle of the day, Bitcoin experienced a downward movement of around 6%, reaching a support level of $63,054. We need to observe its behavior in the subsequent candles around this support level.
🌊From a Elliott Wave Theory perspective, we've seen a reversal in the lower wave cycle on the 4-hour chart, indicating a minor downturn. However, in the higher wave cycle, Bitcoin remains predominantly bullish, and this correction appears to be a minor adjustment necessary for subsequent upward movements.It's important to note that these corrections on higher time frame charts can shape long-term trends, potentially providing profitable opportunities on lower time frame charts like the 4-hour.
💪The latest key level where price bounced back is around $68,100, forming a strong Potential Reversal Zone (PRZ). This zone coincides with the Point of Control (POC) indicator of the fixed range volume profile, the 0.38 Fibonacci retracement level of the downward wave, and the resistance line of the Elliott Wave Theory. Additionally, the golden cross of the SMA7, 25, and 99 further strengthens this zone.
📊The volume of red candles confirms the short-term downward trend but currently doesn't show any weakness. We need to monitor how the volume behaves in case of a correction.
✅For traders holding short positions, consider taking profits if the price finds support at $63,054. Otherwise, exercise patience and wait for a potential drop to $60,849. If the price sharply rises, take pleasure in your profits. For risk management, set your stop-loss if the sharp upward movement occurs, as it could happen easily due to the overall bullish trend.
📉If you don't currently have a position, wait for the market to establish a new structure before taking any action. If you're unable to wait for a new structure to form, consider opening a short position when the RSI enters oversold territory. However, be aware that this is a risky move. By considering these factors, traders can identify potential trading opportunities amidst Bitcoin's price correction.
🧠💼It's important to acknowledge the inherent risks in futures trading, with the potential for margin calls if risk management is neglected. Always adhere to strict capital management principles and utilize stop-loss orders, ensuring that the initial target offers a risk-to-reward ratio of 2

COS Sailing the Crypto Seas: A Strong Buy Signal Beckons!Gemini
Conversazione con Gemini
immagine del profilo
Short Fondamental, recent news and desclaimer COS coin in english usa
Mostra bozze
Contentos (COS) Coin: A Short Summary
Fundamental Analysis:
Contentos (COS) is a cryptocurrency that powers a content ecosystem focused on video sharing and entertainment.
It operates on the BNB Beacon Chain (BEP2) platform.
There's a total supply of 9.9 billion COS, with over 5.1 billion currently circulating.
The current price of COS is around $0.0088 (as of March 17, 2024).
Recent News:
There isn't any major news specific to Contentos circulating at the moment. However, you can find more information and stay updated by checking the project's official channels or CoinMarketCap and CoinGecko.
Disclaimer:
I am not a financial advisor and this is not financial advice. Please do your own research before making any investment decisions. Cryptocurrency is a volatile market and investing in it carries inherent risks.

the IMVU crypto revealed a sign of sustenanceIMVU price plummeted by 29.64% in trading volume on all tradeable platforms in the last 24 hours, as per CoinMarketCap. Its market value is $900,615.11 and its trading volume is $132.167.79. There are 226.37 Million VCORE self-claimed assets in circulation, while its total supply is 8 Billion VCORE.
The IMVU token highlights that the price has been in an uptrend earlier over a daily timeframe and showed a sharp increase over time. The price flew from the demand zone at $0.001800 to the supply level at $0.005350. This scenario looks like a quick dump over the chart as the uptrend got violated and the price came back to the demand zone.
After a prolonged consolidation in the same demand zone, the price flew once again from the price point of $0.001800 to the new greater supply level at $0.017000. This phenomenon was repeated and the price plunged again, as buyers failed the war with the sellers.
However, the IMVU crypto revealed a sign of sustenance as the price is not going below the support level of around $0.003250 on the chart.
At the time of publishing, the crypto experienced an 8.74% surge in the last 24 hours, trading at $0.003721. Therefore, if IMVU manages to surge based on buyers' interest, the resistance would be at $0.005350.
On the flip side, if the IMVU crypto price fails to stay above $0.003250, it could decline further and reach new depths.
The technical indicators tools like EMA, MACD, and RSI illustrate the bullish potential. As the price is sustaining on dynamic support of 20, and 50-day EMA, the MACD line is above the zero line and the RSI of IMVU is above the median line.

the Renq Finance crypto asset is displaying strong buyingThe price action earlier displayed a tremendous downfall in RENQ price by making lower lows and highs on the daily chart. It dipped like a falling knife shattering all nearby support but failed to pierce through the major demand zone area and formed a support at $0.005000.
on the overall chart, it has shown bad performance in the past month, and three months by 7.18%, and 14.29% respectively, indicating a consistent downward trend.
However, the Renq Finance crypto has indicated a sign of a major turnaround as the price rose from a critical key level of around $0.005000 on the chart.
Its price action appears like the RENQ crypto is ripe for an upcoming splendid surge, as it harnesses energy to pierce the above resistance level and climb strongly to new altitudes from the current demand zone. In the same way, the Renq Finance asset is demonstrating bullishness and upward momentum as it keeps above major trend 20-day and 50-day EMA's, subject to the buyers' surge the price could thrust upward strongly from the dynamic supports of these major EMA's as well.
Similarly, the RENQ asset's technical indicator is exhibiting bullish performance as MACD shows a bullish cross with a growing graph of the histogram. The Renq Finance asset is showing that bulls are gaining control gradually and can continue to rise in the forthcoming sessions. Likewise, the Renq Finance crypto asset is displaying strong buying characteristics, as sellers are getting weaker over time over the daily chart and bulls can make the price jump higher and extend its gains.
The recent chart of the past week has shown good performance as it rose 23.70%, which indicates a possible healthy sign of the beginning of a consistent upward trend.
The RENQ crypto has experienced a decline of 1.55% in the last 24 hours and currently is trading at $0.0067.
Therefore, if the demand surges abruptly, the Renq Finance asset price could bounce back from the current level. Then the next goal for the price could be to reach $0.01000 and in between resistance could be $0.008950.
Another possibility would be, if the RENQ crypto price fails to stay above the $0.005000 level, it could decline further.

APE Sailing the Crypto Seas: A Strong Buy Signal Beckons!"APE Coin: Short Fundamentals, Recent News, and Disclaimer
Fundamentals:
Launched in March 2022: Created by Yuga Labs, the company behind the popular Bored Ape Yacht Club (BAYC) NFT collection.
Utility token for the APE Ecosystem: Grants access to exclusive features within the APE Metaverse and future Yuga Labs projects.
Governance rights: APE token holders can vote on proposals related to the APE ecosystem.
Total Supply: 1 Billion APE, with a circulating supply of around 660 million (as of March 13, 2024).
Recent News:
Feb 28, 2024: Yuga Labs announces a partnership with Spotify to integrate NFTs and potentially APE into the music streaming platform.
Feb 14, 2024: Animoca Brands announces a $100 million metaverse fund, potentially fueling future APE integration with various games.
Jan 31, 2024: OpenSea integrates APE staking, allowing users to earn rewards for holding APE tokens.
Disclaimer:
Newer coin with high volatility: Launched in 2022, APE is a relatively new cryptocurrency with a higher degree of price fluctuation compared to established coins.
Reliance on Yuga Labs' success: The value of APE is heavily tied to the success of the APE Ecosystem and future Yuga Labs projects.
Consider the risks: Cryptocurrency investments are inherently risky. Do your own research before making any investment decisions.
Additional Notes:
The recent news highlights potential future growth for APE through partnerships and integrations.
The price of APE has been volatile since its launch, reflecting broader market trends.
It's important to be aware of the risks involved before investing in APE.
I hope this information is helpful! Please let me know if you have any other questions

The Ethereum crypto appears to be geared to keep on going upwardThe Ethereum on Tuesday 12th shows a pause in price after a splendid long run in the northward direction. As of Wednesday 13th, the current market price (CMP) is $4036.3, representing a 1.45% intraday increase, and is showing bullish traits for more growth in future sessions. It has demonstrated good performance in the past week by 13.54%, month by 61.09%, and three months by 78.70%, indicating a reliable upward trend.
Since the ETH crypto has displayed a prime price rally from a critical level of around $2900 on the chart and showing sustenance signs at another critical level at a $4000 price level. This price structure on the daily chart shows that Ethereum has the potential to surpass its all-time-high level, similar to Bitcoin.
The Ethereum crypto appears to be geared to keep on going upwards on this remarkable price rally after it recently paused at the $4000 level on Tuesday. Now, it seems mobilizing its buying force again to overcome the resistance level of the next supply zone around $4600 and ascend to new.
Moreover, the crypto asset has shown a bullish strength already by giving a bullish rally so far, and more rising potential lurking on the ETH chart as it stays above major 20, and 50-day EMA's.
Therefore, the Ethereum price prediction highlights that, if the price manages to thrust above by carrying solid buying volume, then the next possible targets could be $4400 and $4600, respectively.
However, if the crypto price fails to stay above $4000, it could decline to $3800, starting a downtrend. The next support would then be $3400.

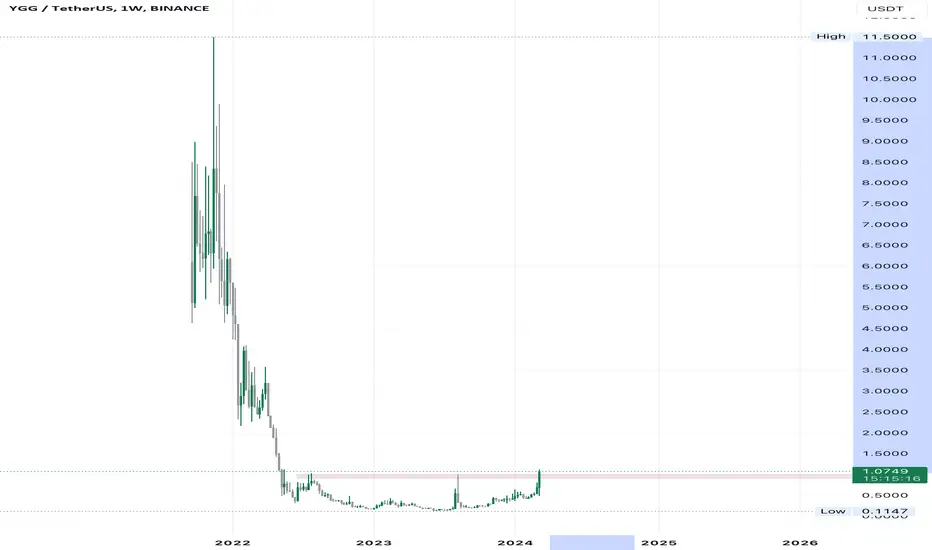
Ygg coin bullish*coin of hottest sector (gamefi)
*huge potential for good returns
*good breakout on chart
*buying in a crypto bullrun24
What else you need .
LADYS "Sailing the Crypto Seas: A Strong Buy Signal Beckons!"## Milady Meme Coin (LADYS): Fundamentals, News, Disclaimer
**Fundamentals:**
* **Milady Meme Coin (LADYS):** A cryptocurrency inspired by internet memes and humor.
* **Launched:** Information not widely available.
* **Market Cap:** Likely very low (based on its meme coin status).
* **Rank:** Not listed on major exchanges (CoinMarketCap, CoinGecko).
* **Unique Features:**
* Community-driven and meme-centric branding.
* Aims to be the "drip currency" and a symbol of online clout (unverified claim).
**Recent News:**
* There isn't widespread news coverage for LADYS due to its lesser-known status.
* You can find its price and basic information on some cryptocurrency tracking websites.
**Disclaimer:**
* This information is for educational purposes only and should not be considered financial advice.
* Meme coins are highly speculative and extremely volatile investments.
* They often have limited real-world use cases and are susceptible to hype and manipulation.
* Do extensive research before investing in LADYS or any meme coin.
**Additional Notes:**
* LADYS likely has a small user base and low trading volume.
* Investing in LADYS carries a high degree of risk.
* Consider your risk tolerance and investment goals before making any decisions.

Pepe Coin: The New Meme Coin Sensation of 2024Pepe coin, a meme coin that’s quickly becoming a legend in its own right, has astonishingly reached the 3B market cap mark, positioning itself as the 3rd meme coin ever to achieve such a feat. This remarkable achievement comes after a staggering 400% gain in just the last week. 🔥
Currently, it stands proudly at the 40th rank by market cap and an impressive 9th rank by volume in the last 24 hours . Let’s take a closer look at Pepe coin and see why everyone’s talking about it. 👇
✅ Pepe’s Market Performance: A Quick Overview
The buzz around Pepe coin is palpable, and it’s already being hailed as one of the top meme coins of this cycle. And guess what? The real euphoria hasn’t even kicked in yet. 🔥
Pepe is coming out of the long-term accumulation range, and with the crypto market starting a new bull cycle, the momentum is going to accelerate soon. The current candles’ range and the volumes are a testament to the underlying strength.
✅ Comparative Analysis: Pepe vs. Doge
⚡️ Structural Similarities between PEPE and DOGE
If we place Pepe and Doge alongside, it’s like looking at two sides of the same coin . The market structures and fractals of Doge from 2020 to 2021 bear a striking resemblance to Pepe’s current trajectory. And what do the market gods say about history? It is often similar and repeats itself! 👀
At the moment, it looks like Pepe is right at the same stage as Doge was in 2021 , when it started it’s monster rally. The momentum building up around Pepe suggests we’re just at the beginning of what could be an exhilarating euphoric phase.
⚡️ Relative Performance of PEPE and DOGE
Since there’s no symbol for PEPEDOGE, we can make a ratio chart by dividing PEPE by DOGE to make a custom symbol. Looking at the chart, Pepe has significantly outperformed Doge by over 300%. I’ve used the latest swing as a reference because it’s the most relevant point in the current scenario, as meme coins have been rallying from that point onwards.
✅ Broader Market Context
⚡️ Relative Performance of DOGE and BITCOIN
We’re examining this chart to grasp how the market context is evolving. Doge has consistently been lagging behind BTC for a couple of years . Both its price and momentum are at historic lows.
However, there are early indicators suggesting a reversal and a change in trend. This implies that once the alt season kicks in, Doge will gain momentum and surpass Bitcoin. This context is crucial because it sets the stage for Pepe’s performance, suggesting that its lead over Doge could extend throughout this market cycle.
⚡️ Relative Performance of PEPE and BITCOIN
Despite Bitcoin’s dominance, Pepe has been making waves, outperforming the crypto giant and hinting at the immense potential it holds for the upcoming alt season. This strengthens the fact that once the market-wide alt rally begins, Pepe can outperform others by a huge margin.
Conclusion
Pepe coin’s journey is a fascinating tale of unexpected triumphs and the unpredictable nature of meme coins. Its rapid ascent to a SEED_TVCODER77_ETHBTCDATA:3B market cap and its standout performance in the market are clear indicators of its potential to climb even higher, possibly reaching the $50B mark or beyond.
While the crypto market is known for its volatility and surprises, Pepe coin’s current trajectory suggests that it’s on its way to becoming one of the top 10 coins in this cycle. The excitement around Pepe is undeniable, and for those of us watching, participating, or just cheering from the sidelines, it’s a reminder of the thrilling unpredictability that draws us to cryptocurrencies.
Thanks for reading. Hope you found it useful.
Let me know your thoughts in the comments. Cheers!
Disclaimer: This post should NOT be construed as investment advice and is meant for learning purposes only. Please consult your financial advisor before making any investments.

The graph is bullishGrt coin is absolutely bullish as its broke out the weekly structure as AI narrative shows potential growth in next crypto bull market we can do investment in the graph for next bull run ☄️

Tight close range - One side moment is expected in coming weeksThese tight ranges often result in a one-sided moment. Considering the current sentiments, there is concord among market participants about what the future holds for crypto, which is reflected in the price moment.
Resistance: 44k-49k
Support: 37-38 K
