DASH LOOKS BULLISHFlipping the $40.5 range will lead Dash up to the $47 range, the condition being BTC does not dump from here.
Flipped the resistance and now testing back with 21EMA supporting the price below. SL is around $37.
Search in ideas for "FLIPPING"

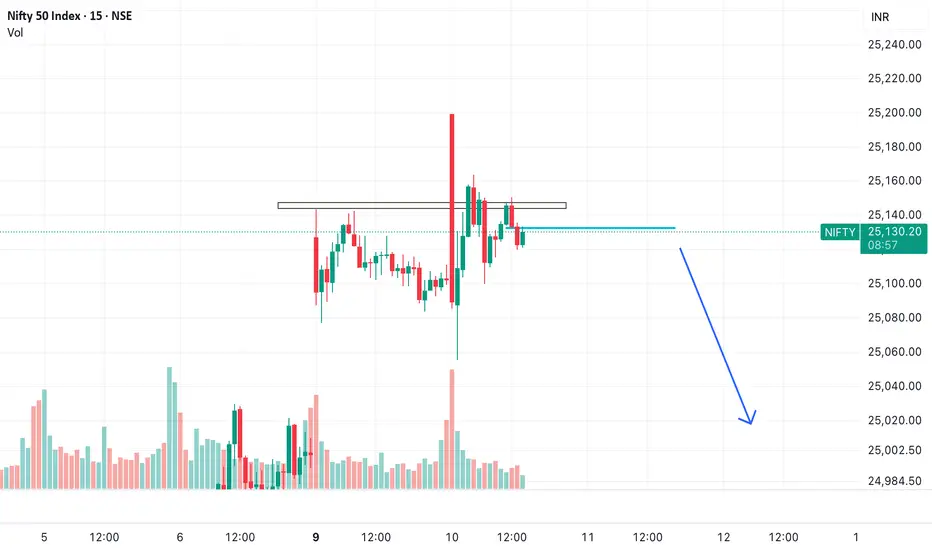
Nifty 50 – Gravity Check in Progress
Technical Breakdown
• Double Trouble: Nifty made two failed attempts to break out above 25,150. Both got slapped back down. That’s a double top on the 15-minute, with rejection wicks to prove it.
• Trend Shift Brewing: Lower highs and a breakdown from minor support suggest momentum is flipping.
• Volume Tells a Story: Weak up-move volume, strong sell volume on the last leg down. Classic signs of distribution.
⸻
Fundamental Undercurrent
• RBI Already Fired the Bazooka: Post the surprise rate cut and liquidity injection, Nifty rallied hard. Now the stimulus sugar rush looks priced in.
• Valuation Fog: Forward PE is at ~20.2x, slightly below average but not a bargain. Some brokerages are warning that midcaps and smallcaps are getting bubbly.
• External Jitters: Global market mood is cautious, with geopolitical and trade-related grey clouds lingering.
⸻
The Trade Setup
• Entry: Sell if price decisively rejects 25,130–25,140
• Stop: 25,170 (15-min candle close above)
• Targets: 25,000 → 24,900 → 24,800
• Time Horizon: 2–4 sessions
• Risk-Reward: 1:2 or better
⸻
Bottom Line
The chart says sellers are lurking near the top. The fundamentals say the rally’s narrative is weakening. The mood? Feels like the market’s looking for a reason to exhale. Until Nifty can punch through 25,150 with volume, the path of least resistance could be down.
Trade Idea on AMD: The Case for a Sweet Double BottomAssumption & Context
Let’s address the elephant in the room: the $118 level. Technically, it's a lower low, just 3% below the previous $122 low. However, in my view, it’s not a lower low in the traditional sense. Why? Because this area likely attracted a ton of stop-loss orders, creating what I call (Wyckoff ripped me off) a "selling climax" — a quick 3% shakeout that wiped out the obvious players. It's like AMD decided to yell, "Gotcha!" before flipping.
This leads me to my current trading hypothesis: $118 could be the sweet spot for a double bottom, precisely the entry point that many savvy traders have been waiting for.
I’m betting AMD will leave NVIDIA eating its dust in the short to mid-term. Why? AMD’s upside potential is like spotting a rocket on the launch pad, while NVIDIA feels more like a plane that’s already cruising at 35,000 feet. And let’s face it, semiconductors + GPUs ?? — you can’t go wrong with them these days.

Bitcoin Bounce Alert: Holding the $100K Fortress! 📉 Market Context & Technical Levels
Key support at ~$100K: As the chart shows and multiple analysts confirm, this level continues to act as a strong defence zone. Cointelegraph noted bulls have been “defending the $100K key support level strongly,” triggering bounces during dips
Descending channel overhead: Bitcoin has retraced into a downward channel. A clean breakout above ~107K–109K (past recent peaks) is needed to signal a bullish shift .
Liquidity target at ~106K: Plenty of orders await in that region—flipping it to support may pave the way for another push higher .
📊 Indicators & Momentum
RSI dip near 25 during the latest drop indicates oversold conditions—often a precursor to rebounds
.
Volume surge on rebounds suggests absorbing sell pressure and strong accumulation interest at lower levels.
🚩 Key Price Zones to Watch
Level Significance
$100K Crucial support; losing it risks a slide toward $95K–97K or even $92K
.
$105K–106K Liquidity zone; flipping here as support could confirm upward momentum .
$107K–109K Resistance from channel tops and prior highs; a successful break is key to next leg up .
$112K–$112K+ If breakout occurs, upside targets extend toward prior ATH near $112K and beyond .
🎯 Chart Analysis Summary
Your chart shows three distinct bounces from the $100K–100.7K supply zone (highlighted in blue) and the latest one includes a sharp wick and rebound. This aligns with broader market dynamics emphasizing support at $100K and building liquidity at $106K. The arrow projection signals a probable retest of ~106K, with room to challenge ~107–109K after consolidation.
🧭 Trade Outlook
Bullish scenario: Hold above $100K → reclaim $106K → trendline breakout → potential rally to $112K+.
Bearish risk: Fails support at $100K → breakdown toward $95K–92K region.
📌 Bottom Line
Support $100K is alive and well. Bounces have been crisp and volume-backed.
Next test lies at $105–106K. That’s the battleground—flip it, and we may see bitcoin reclaim recent highs.
Watch the channel overhead (~107K–109K). A breakout could open the door to fresh records.
✅ Conclusion: BTC is defending its psychological base firmly. If this zone holds once more, the path to $106K and beyond is in focus. Breaking above demands conviction, but it’s the pivot to watch.

Chart Analysis — Rounded Bottom Reversal Toward Key ResistanceMarket Structure
Price formed a rounded bottom (cup-like reversal) after a sharp selloff, signaling exhaustion from sellers and a gradual shift to buyers.
The lowest point (circled) shows strong demand absorption, followed by higher lows → early trend reversal behavior.
Key Levels
Support zone: ~4,890–4,950
This area held firmly and acted as the base for the bounce. Buyers consistently defended it.
Entry zone: Just above support
The pullback into prior support + bullish reaction suggests a safe long entry on confirmation.
Mid resistance: ~5,100
Price already reclaimed this zone, flipping it from resistance into short-term support.
Major resistance / target: ~5,210–5,250
This is the next liquidity zone and logical profit target, aligned with previous supply.
Momentum & Price Action
The white projected path shows a bullish continuation scenario:
Break and hold above 5,100
Brief consolidation / retest
Push toward the upper resistance band
No immediate signs of distribution yet; momentum favors continuation unless price loses the support zone.
Bias
Bullish while above ~4,950
Invalidation if price accepts back below support with strong bearish candles.
Trade Idea Summary
Bias: 📈 Bullish continuation
Entry: Support retest / bullish confirmation
Target: 5,210–5,250
Risk: Breakdown below support

Symmetrical Triangle Masterpiece : Multi-Layout W,DtfStep into this dynamic multi-layout window opened right in front of you—a split-screen showcase of pure price action artistry.
Left Side: Weekly Timeframe
Here, a symmetrical triangle (a classic continuation or reversal pattern formed by two converging trendlines of equal slope) takes center stage. Framing it are a green uptrend line (connecting higher lows for bullish structure) and a red downtrend line (linking lower highs for bearish pressure), creating a tightening coil of market indecision. A subtle white counter-trend line (acting as dynamic support/resistance opposing the main trend) adds layers of geometric elegance, hinting at its heightened significance when viewed on lower timeframes.
Right Side: Daily Timeframe
Flipping to the daily chart reveals how this white line shines as a pivotal counter-trend barrier, interacting seamlessly with intraday swings. Multi-timeframe analysis (comparing higher timeframe structure with lower timeframe details for confluence) illustrates the fractal beauty......how weekly patterns cascade perfectly into daily price action without a single forecast or bias.
This is markets at their most poetic: old-school chart patterns and trendlines weaving symmetry across scales. No predictions, just appreciation for the elegance.
Disclaimer: This post is for educational and illustrative purposes only, highlighting historical price action and chart patterns. It does not constitute financial advice, trading recommendations, or predictions of future market movement. Always conduct your own research and consult a professional advisor

Bajaj Finance: Impulse Complete, Correction in ControlBajaj Finance completed a clean five-wave impulsive advance , topping out near ₹1,102.5 , followed by a clear loss of momentum. Since that peak, price action has shifted from trend to overlap , signaling a corrective phase rather than continuation.
Structurally, the decline is unfolding within a descending channel , fitting well with a W–X–Y corrective structure . The internal swings remain choppy and overlapping — classic correction behavior — with price respecting the channel boundaries so far.
During the impulsive rally ( Waves 1–5 ), the 50 DMA acted as dynamic support , confirming strong upside momentum. Post the top, price has slipped below the 50 DMA and is now oscillating around it, indicating momentum fatigue . A sustained hold below the 50 DMA, combined with a rollover in the average , would reinforce the short-term bearish / corrective bias , with the average potentially flipping into dynamic resistance .
From a price projection perspective, the ongoing Wave Y is favoring a move toward key Fibonacci retracement levels . The 0.618 retracement near ₹945 stands out as a high-probability reaction zone , while a deeper flush could extend toward the 0.786 retracement near ₹903 if downside pressure accelerates.
Risk is clearly defined. A sustained break above the upper boundary of the corrective channel would invalidate the W–X–Y interpretation and signal a structural shift back toward strength . Until then, the path of least resistance remains corrective .
Bottom line:
The impulsive phase is done. The market is digesting gains. Structure — not emotion — favors patience and respect for the corrective channel.
Disclaimer:
This analysis is for educational purposes only and does not constitute investment advice. Please do your own research (DYOR) before making any trading decisions.

MARAL Execution Example — WIFUSDT.P 1H (Short 0.01234 → 0.01196)MARAL Execution Example—Discretionary SHORT (Entry 0.01234 → Exit 0.01196) in Binance
This post is not about prediction. It’s about execution quality — how MARAL guides a trader before entry, during the hold phase, and into the exit decision using context + risk controls.
Trade Snapshot
Position: SHORT (manual)
Entry: 0.01234
Exit: 0.01196
Move captured: ~0.00038 (≈ 3.1%)
1) Pre-Entry: Why MARAL allowed the trade
Entry Checklist (Permission Layer)
MARAL’s checklist was green across core pillars:
HTF Alignment: OK
Structure: OK (Bear Structure)
Momentum: OK
Volatility (ATR + ADX): OK
Liquidity Confidence: WARN
Score: 93 / 65 → ENTER SHORT
Important: “Liquidity = WARN” is not a “no-trade.”
It means nearby liquidity pools exist, so the trade may include wick risk / stop-sweep behavior, and execution must be disciplined (no FOMO entries, no oversized risk).
2) Signal vs Framework: What the Master Engine confirmed
MARAL didn’t just show “short.” It confirmed the internal quality of the short context:
Last Signal: SHORT
Direction: Bearish
H1 / H4 / Daily Bias: Bearish alignment
Structure: Bear Structure
Short Score: 93 (A++)
Trend Probability: 93%
Reversal Probability: 7%
This is the key difference:
MARAL doesn’t “tell” you to trade — it grades the environment so your entry is not emotional.
3) Execution Board: What happened AFTER entry (the real value)
Post-entry, the Execution Board shifted into execution guidance:
Execution State (Holding Logic)
Trade Status: VALID
Market Phase: CONTINUATION
TP Probability: HIGH
Obstacle Ahead: NO
Exit Pressure: LOW
Momentum Health: STRONG
Score Trend: Stable / Improving
Active Window: ON
Action: HOLD
Trade Age: FRESH
This is execution intelligence:
VALID + CONTINUATION = trend conditions still supportive
Obstacle Ahead: NO = fewer immediate barriers in path
Exit Pressure: LOW = no urgent reason to panic-exit
Action: HOLD = stay in trade as long as structure remains intact
4) Risk State: Why “OVEREXTENDED” matters even in a VALID trade
MARAL showed:
Risk State: OVEREXTENDED
This does not mean reversal.
It means:
“The move is mature / extended relative to volatility. Continuation can happen, but holding requires risk-managed behavior.”
Execution behavior under OVEREXTENDED:
Don’t add to position (no stacking late)
Protect profits (tighten or trail logically)
Expect wicks/pullbacks even if trend remains bearish
Prefer partials / controlled exits near objectives
5) My exit decision (0.01196): Execution > greed
Even though MARAL was still VALID / HOLD, I chose to exit at 0.01196 to:
Lock a clean capture (~3.1%)
Respect OVEREXTENDED risk
Avoid giving back profit during possible liquidity reaction / mean-reversion
This is exactly what MARAL is designed for:
Stay in when the environment is valid — but exit like a risk manager, not like a gambler.
6) What would invalidate the HOLD (how MARAL helps you stay objective)
For me, a HOLD becomes questionable if MARAL starts flipping these:
Trade Status: VALID → RISKY/WEAK
Exit Pressure: LOW → RISING
Obstacle Ahead: NO → YES
Momentum Health: STRONG → WEAK
Score Trend: IMPROVING → DETERIORATING
Active Window: ON → OFF
That’s the execution framework in action: no emotions, only conditions.
Due to TradingView attachment limitations, the full chart is shared via the link below.

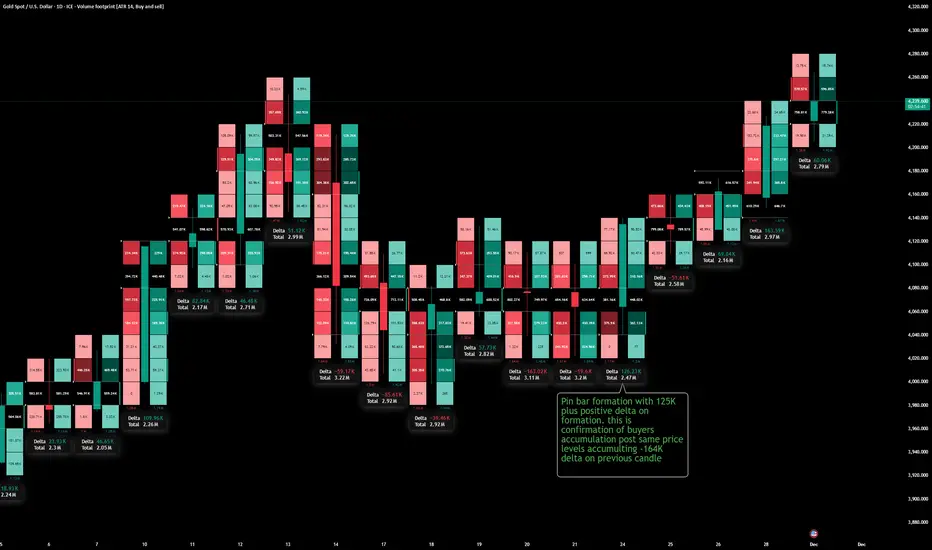
Positive Delta Formation time to buy at dips again. XAUUSDThis footprint shows aggressive sellers getting absorbed, then buyers stepping in and reversing the auction, confirmed by a change in delta and a bullish pin bar structure.
What delta is showing
- Each candle’s delta is buy volume minus sell volume, so negative delta = aggressive selling at the bid, and positive delta = aggressive buying at the offer.
- When you see a series of candles with heavy negative delta at similar prices but price is not breaking lower, it often means sellers are getting absorbed by passive buy limits sitting in the book.
Reading your highlighted zone
- The previous candle has a strongly negative delta (around −164K), meaning aggressive sellers hit the bid hard at those same price levels but could not push the market down much further, which hints at seller exhaustion or absorption.
- The next candle forms a pin bar with a long lower wick and flips to a solid positive delta (around +125K), meaning that after sellers tried again at the lows, aggressive buyers lifted the offer and reclaimed the range, trapping late shorts in the wick.
Logical order‑flow narrative
- Step 1: Into the low, repeated negative delta shows traders selling aggressively, but the lack of fresh lows means big passive buyers are absorbing that flow at the bid (large negative delta, small net progress in price).
- Step 2: On the pin bar candle, sellers again attack the same prices, but this time buyers respond even more aggressively, flipping delta positive and bidding price back above the prior traded cluster – that’s buyer accumulation at the same levels where sellers just loaded up.
- Step 3: Once price lifts, those trapped sellers must buy back to exit, adding fuel to the upside; the following candles keep printing higher with mostly positive or improving delta, confirming that control has shifted to buyers and the move is likely to continue.
How to trade this logic
- Treat “big negative delta at lows + no breakdown” as a potential trap/absorption zone, then look for the next candle to show a clear rejection wick plus a decisive flip to positive delta as entry confirmation for longs.
- Manage risk just below the pin bar low (where sellers failed), and only stay in the trade while subsequent footprints keep showing supportive or at least non‑bearish delta; if price makes new highs on weakening or negative delta, start expecting profit‑taking or a possible stall.
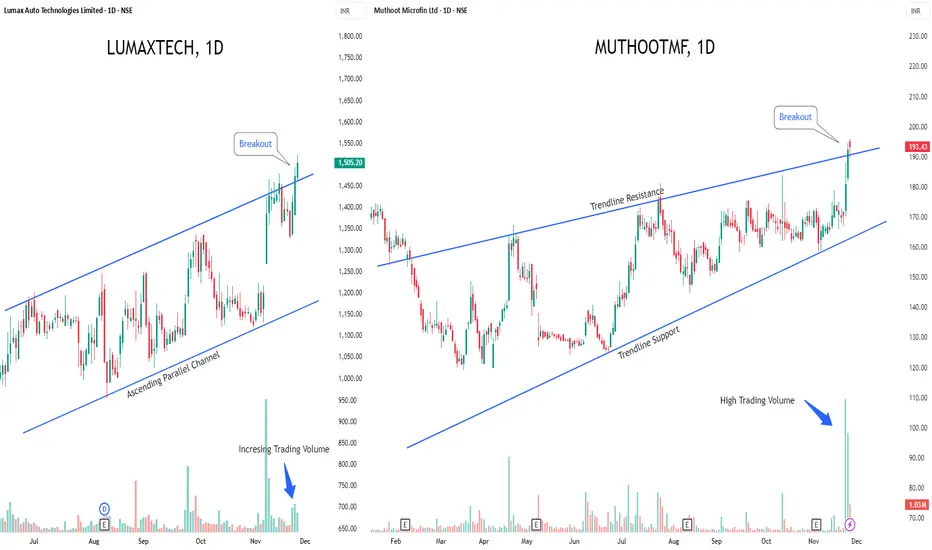
LUMAXTECH & MUTHOOTMF - Breakout Stocks to Watch This Week!1️⃣ Lumax Auto Technologies NSE:LUMAXTECH — Fresh Breakout Alert
Lumax is riding a strong uptrend and has cleanly broken above the upper boundary of its ascending parallel channel.
If this breakout sustains, the stock could see a sharp upside rally ahead.
Rising volumes are confirming strong buyer interest, giving this move an extra edge.
2️⃣ Muthoot Microfin NSE:MUTHOOTMF — Failed Rising Wedge, Strong Reversal Setup
A failed rising wedge pattern is playing out as the price has broken above the trendline resistance, flipping the structure into a bullish signal.
Even better — heavy volume buildup is reinforcing the strength of this emerging reversal.
⚡Both counters show early signs of momentum — watch for follow-through!
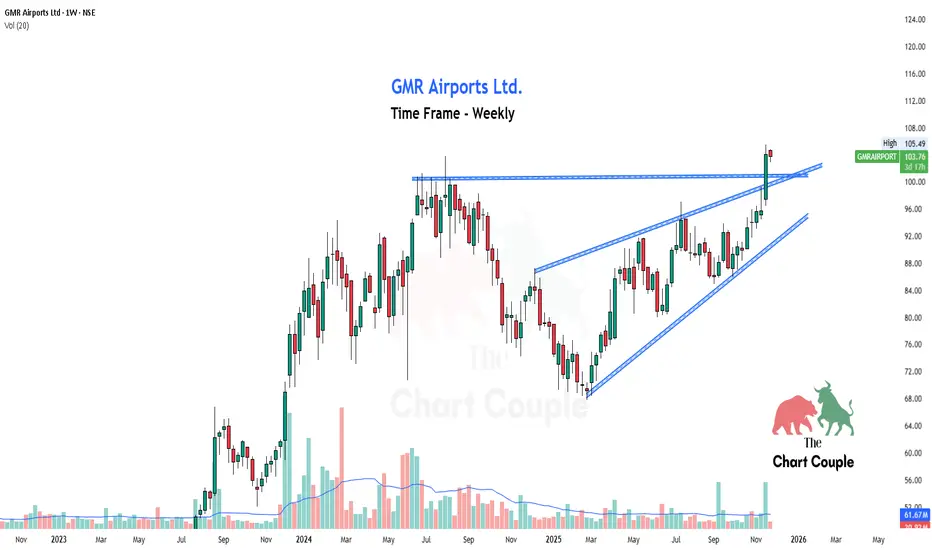
GMR Clean breakout above major resistance.“Price traded inside a rising wedge for weeks, squeezing toward resistance.
A strong bullish candle finally broke the structure, flipping old resistance into new support.
Volume confirms buyer strength—now watching for a retest and continuation.”
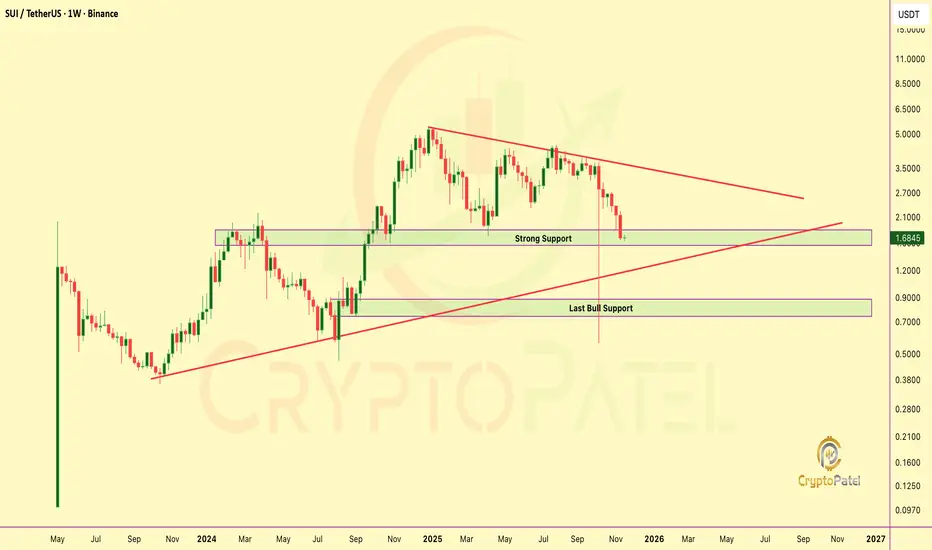
$SUI $1.66: The Liquidation Event That Just Printed the Next CycCRYPTOCAP:SUI Sharp ~70% Drawdown to the $1.66 zone has triggered broad Capitulation, with sentiment flipping decisively risk-off.
This is market structure: forced liquidity, weak-hand exits, and a reset in positioning after an overextended leg.
But historically, deep corrective sweeps often mark the final stage before trend re-acceleration. The $1.70–$1.00 range is emerging as a high-conviction accumulation pocket for investors with longer time horizons.
Should liquidity rotate back into high-beta assets later this cycle, a re-pricing toward the $10 region stays firmly on the Table.
In Crypto, Volatility Punishes Impatience and Rewards Discipline.
NFA & DYOR
Raghav Productivity Enhancers Ltd | Weekly VCP Breakout | Moment🏭 Company Overview
Raghav Productivity Enhancers Ltd (NSE: RPEL) is India’s leading producer of silica ramming mass, a key refractory material used in steel manufacturing furnaces. The company operates modern facilities with global quality standards, catering to both domestic and international steel producers.
Fundamental Keys
Company's market cap ₹35,887 Cr
PE Ratio : High Valuation (78.90)
Price to sales: >15.75
ROE: >30% Excellent
ROA: >26% Good
Net Profit Margin: >19% Good
Operating Margin: >45% Good
EBITDA Margin: >28% Good
Debt-to-Equity: 0.0279 (debt-free profile)
Quick Ratio: 3.67
Cash Ratio: 0 (working capital tightness)
Debt to EBITDA: 0.098 Good
Annual sales have increased for 3 consecutive years.
Quarterly revenue trending upward for 5 years.
Strong balance sheet with growing total assets and minimal debt.
Financially robust with excellent profitability and asset efficiency.
Valuations are stretched, but strong earnings momentum supports short- to medium-term bullish sentiment.
Technical Analysis (Weekly + Daily)
Stock formed a perfect VCP (Volatility Contraction Pattern). A series of tightening swings leading to a breakout with a massive green candle.
Breakout candle closed near high - shows conviction buying.
Volume expansion on breakout confirms institutional participation.
Price now comfortably trades above key resistance zone (~₹740) flipping previous resistance into new support. All moving averages aligned bullishly with expanding volume signaling a high-probability breakout continuation.
Price trades above 9, 20, and 50 EMA - bullish alignment. ADX is showing healthy trend strength. RSI mildly overbought, typical for breakout continuation. MACD confirmed strong bullish crossover. Weekly volume surged to ~995K, 3× above average clear sign of institutional activity. Daily volume >615K confirms multi-timeframe buying interest.
Swing Trade Plan : For 1-3 weeks
Breakout Aggressive Entry: ₹795–805 On (close above breakout high)
Retest Entry: ₹740–760 (On low-volume retest of breakout zone)
Stop-Loss ₹650 Below 50 EMA / prior base
Target 1: ₹850–880 (First resistance zone)
Target 2: ₹950–1,000 )Measured flag projection)
Trailing Strategy:
Move SL to ₹740 after T1 achieved.
Trail below 9 EMA (daily) as price trends higher.
Exit if weekly candle closes below 20 EMA with volume expansion.
⚠️ Disclaimer
This analysis is for educational and research purposes only. It is not financial advice. Always conduct your own due diligence and use proper risk management.

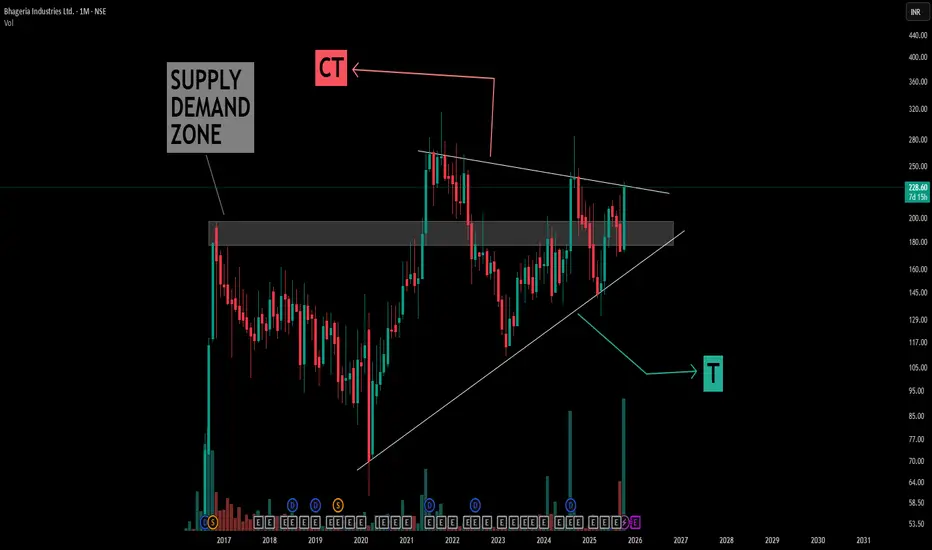
Understanding Symmetrical Triangle Patterns in depthThis chart illustrates a classic example of a symmetrical triangle pattern formed over several years, with simple compression trendline (CT) and trigger (T) lines drawn in white for clarity.
Key learning points from the structure:
- Symmetrical Triangle Formation: The pattern is defined by converging trendlines representing successive lower highs and higher lows, indicating a period of price consolidation and market indecision
- Supply Converts to Demand: The boxed area initially acted as supply, where price faced resistance repeatedly. Over time, after multiple interactions and a structural shift, this area began to act as demand, offering support to subsequent price movements. This showcases how prior resistance can evolve into a support zone as market dynamics shift.
- Pattern Context: A large symmetrical triangle is forming above this zone, highlighting sustained equilibrium between buyers and sellers, and price compressing within clearly defined boundaries.
- Educational Note: Patterns like these offer valuable case studies for understanding consolidation phases, the role of supply and demand flipping, and how market structure can evolve. They can be identified and studied without making directional assumptions, serving as an excellent foundation for technical analysis practice.
This post is aimed purely at technical education, emphasizing the process of chart marking, pattern recognition, and structural interpretation, without making market predictions or outcome forecasts.
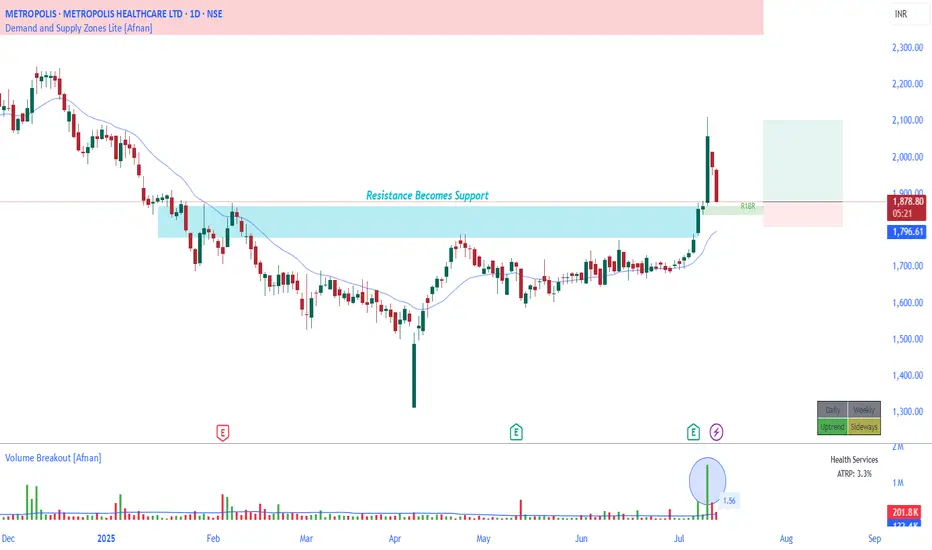
Metropolis Healthcare: A Confluence of Bullish Signals?I've had Metropolis Healthcare NSE:METROPOLIS on my radar for a bit, and what I'm seeing now is a technical setup that's hard to ignore. It’s one of those charts where a few different analytical approaches all seem to be pointing in the same direction—a confluence that always gets my attention.
The Key Level I'm Watching
The price is currently pulling back into a well-defined Rally-Base-Rally (RBR) demand zone on the daily chart. For those who follow institutional order flow, these zones are significant. They often represent the 'footprints' of smart money—areas where large players stepped in and likely left a trail of unfilled buy orders.
Now, here’s where it gets interesting. This isn’t just any demand zone floating in space. It lines up almost perfectly with a prior resistance level that was recently broken. This is a textbook example of the polarity principle —old resistance flipping to become new support. It’s a powerful combination.
What really strengthens this setup for me is the volume signature. Look at the volume on this pullback. It’s been steadily declining, which suggests sellers are losing steam. This isn't aggressive, panicked selling; it looks more like a healthy breather before a potential move higher.
🔍 Putting It in a Broader Context
To really appreciate this setup, we have to zoom out a little. After a significant downtrend bottomed out around what looks like April, the stock went into a long consolidation phase that lasted for months, from late February into early July. This sideways action built a solid foundation where accumulation was likely taking place.
In early July, we finally saw a decisive breakout from that range on heavy, convincing volume . That action signaled a potential shift in the larger trend, and this current pullback looks like the first classic retest of that breakout area.
📝 My Takeaway 📝
So, when you pull all these threads together, you get a compelling picture. It's not about one single indicator, but how they all align.
A High-Probability Zone: We have a fresh demand zone overlapping perfectly with a classic support/resistance flip level.
Volume Confirmation: The initial breakout happened on strong volume, while the current pullback is on weak volume—exactly what bulls want to see.
Favorable Risk/Reward: From a trade management perspective, an entry near this level offers a clear-cut location for a stop-loss just below the zone, creating a potentially attractive risk-to-reward profile.
The setup gets you in the game, but risk management is what lets you stay in it.
Of course, no setup is a sure thing. The market can and will do whatever it wants, and any zone can fail. That's why a disciplined stop-loss is non-negotiable for any position built around this idea.
This is purely my analysis for educational discussion; it's not a formal trading recommendation. I am not a SEBI registered analyst, so please do your own homework before making any financial decisions.
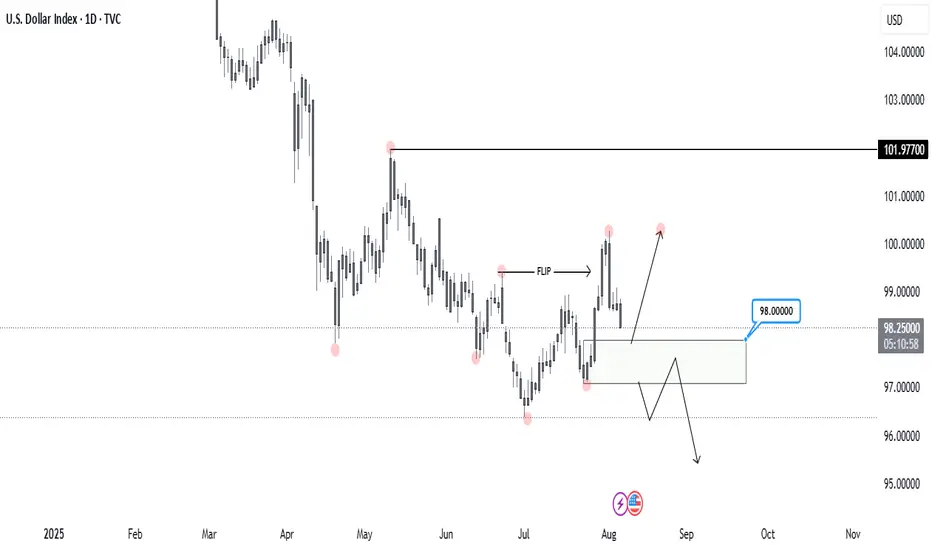
DXY, DAILYLet’s take a look at DXY on the Daily timeframe.
Price recently broke the previous Higher Low, flipping the structure to the downside. This marks a significant shift in momentum.
Now, I'm watching the 98.000 level, which I’ve identified as a Daily Demand Zone. It’s the origin of the move that broke the previous bearish structure, making it a key area of interest.
I’ll be waiting for a reaction from this zone to see if buyers step in again ( most likely ) or if the bearish momentum continues.
That would be my confirmation for xxx/usd shorts.
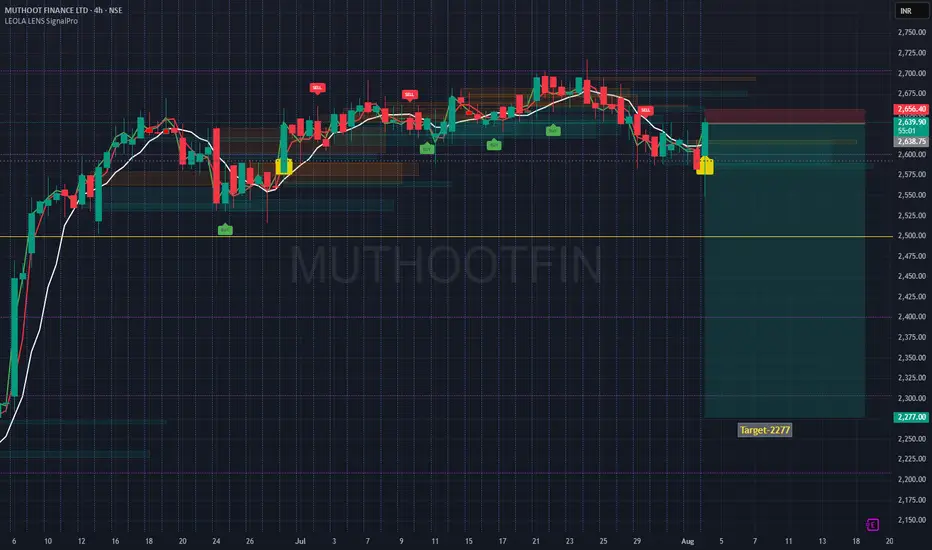
MUTHOOTFIN Structure Breakdown- 2277- Step Towards a Fall 🔍 Technical Structure Breakdown:
🟡 Caution label printed after extended distribution — often a signal for upcoming directional shift.
🔴 Price rejected strongly from the upper red supply zone near ₹2,656, confirming resistance from prior SELL cluster.
⚪ Structure broke below a multi-session accumulation zone, flipping the bias to bearish.
🟢 Current rebound is testing the underside of broken structure — often a key area for rejection or continuation.
📉 Target: ₹2,277, aligning with a major historical reaction zone and potential liquidity pocket.
This setup reflects a classic breakdown-retest structure where price may revisit lower order blocks if it fails to reclaim the broken support zone.
⚠️ Disclaimer:
This post is intended solely for educational purposes and does not constitute financial advice. Please do your own research and consult a licensed financial advisor before making any investment or trading decisions.
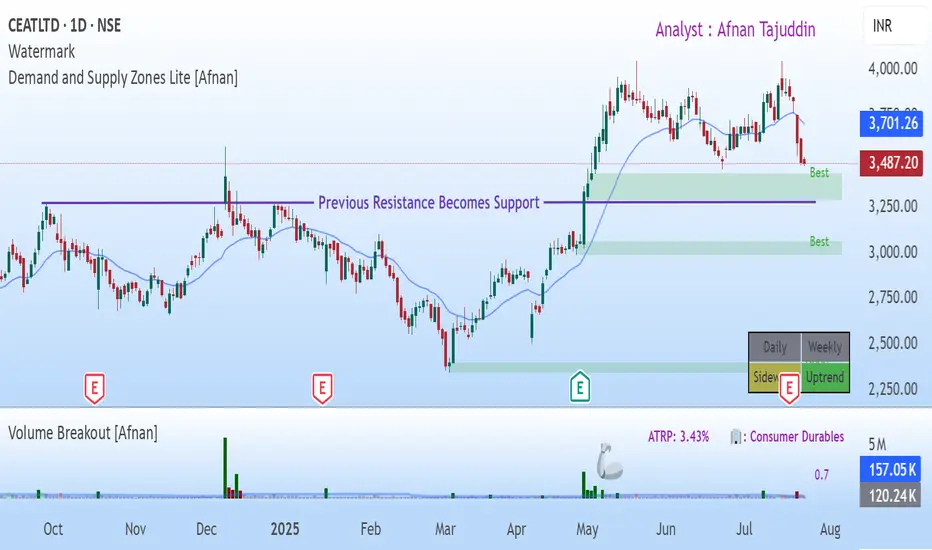
CEAT Ltd: Is a Rebound on the Horizon? A Confluence of TechnicalTraders — let’s dig into CEAT Ltd NSE:CEATLTD . where both demand-supply dynamics and classic technical signals are flashing something worth watching. What’s setting up here isn’t just noise — there’s real structure underneath the surface.
Demand Zone & Institutional Footprints
Let’s start with the core of this setup: the Demand Zone. CEAT’s price is inching toward a daily timeframe Rally-Base-Rally zone — and not just any zone, but one that stands out in terms of quality.
Why does this matter? Because these aren’t retail-driven bounces. These are often the hidden footprints of institutions quietly building positions.
On June 23rd, price came close to this very demand zone — and without even touching it, we saw a sharp bounce. That’s a strong tell. There’s clear demand waiting just below.
Institutions don’t throw their entire order book at the market in one go. They scale in. So when price comes back to this area, it’s likely to trigger those leftover buy orders — potentially leading to another move higher.
Zooming out to the broader view : Both weekly and monthly charts are still in an uptrend. There are no obvious supply zones on the higher timeframes That clears the runway for bullish continuation.
💡 Traditional Technical Analysis Perspective 💡
Now let’s switch gears for a moment and take a look through the lens of classic technical analysis. What’s the chart telling us in plain sight?
CEAT spent months coiling within a consolidation range — nothing impulsive, just sideways chop.
But that changed on April 30th with a decisive breakout. And this wasn’t on light volume — it came with strong participation, a real sign of conviction.
Post-breakout, we’ve seen consistent volume buildup alongside price progression. This isn’t a one-day wonder — it’s been developing.
Act of Polarity at Work: The breakout level had previously acted as firm resistance multiple times. Now that price is retesting it from above, it’s doing exactly what we expect — flipping that resistance into potential support.
Interestingly, this retracement is happening on declining volume. That’s key. It often suggests a healthy retest rather than a breakdown — a potential “buy the dip” scenario, if you will.
🤝 The Confluence: Where Two Worlds Meet 🤝
Here’s where things get really compelling — that demand zone we highlighted? It aligns perfectly with the same level that’s being retested post-breakout. That overlap — this confluence — is no coincidence.
It dramatically increases the odds of a strong bounce, because we’re getting validation from two independent analytical frameworks. When price, psychology, and institutional footprints all point to the same zone — you pay attention.
We could consider a tactical Stop Loss just below the demand zone. And in terms of upside? The previous swing high near ₹4000 stands out as a logical first target.
"Success in trading is a marathon, not a sprint. Consistency, discipline, and effective risk management are your true North Stars."
Stay sharp. Even the cleanest setup can fail — and that’s why managing risk isn’t optional. If price violates the zone and closes below your SL, step out without hesitation.
Thanks for reading — your support, feedback, and questions always help drive this community forward. Let’s keep sharpening our edge together.
🚀 Trade smart, stay disciplined, and let your journey be one of continuous learning! 🚀
Disclaimer: This analysis is intended purely for educational purposes. It does not constitute investment advice or a trading recommendation. I am not a SEBI-registered advisor.
Nifty Ready to Soar?Alright, let’s zoom in with institutional clarity and take this NIFTY setup to the desk like a serious trader — no noise, just tape-reading logic.
⸻
NIFTY – Positional Buy (Not an intraday flirtation)
Chart: 15-min
CMP: 25,080
Type: Positional Long — 3–5 sessions
Sentiment Shift: Bears are fatigued, bulls are loading under the radar
⸻
The Real Story:
1. Demand Zone Held:
24,960–25,000 was tested multiple times. Volume reaction confirms that strong hands defended — not random buying. Markets don’t bounce 100+ points off a zone unless the order book is thick.
2. Volume-Led Pop Above Structure:
This is your first clean breakout after days of bleed. It’s not just the price uptick — volume confirms belief. Even the 14th July candle had absorption. Today’s spike is a statement.
3. Pattern Recognition (Institutional Playbook):
This is a “breakdown failure reversal” setup. Smart money tried pressing lower, couldn’t hold — they’re likely flipping sides now. This is exactly the kind of inefficiency institutions like to scale into.
4. Macro Context:
Crude is cooling. VIX is rangebound. Midcaps are showing resilience. BankNifty is not capitulating — and that’s a sign that the NIFTY drop was more rotational than fundamental.
⸻
Execution Plan:
• Buy: Around current zone 25,070–25,100
• Stop-Loss (Positional): Below 24,960 (strong structural invalidation)
• Target 1: 25,270
• Target 2: 25,375–25,420
• Duration: 3–5 sessions max. This is not a carry into results season or policy week.
⸻
Risk-Reward Thinking:
You’re risking ~120 pts for a potential 300+ pt move.
This isn’t about chasing highs — it’s about catching rotation early, before media and retail wake up to the bounce.

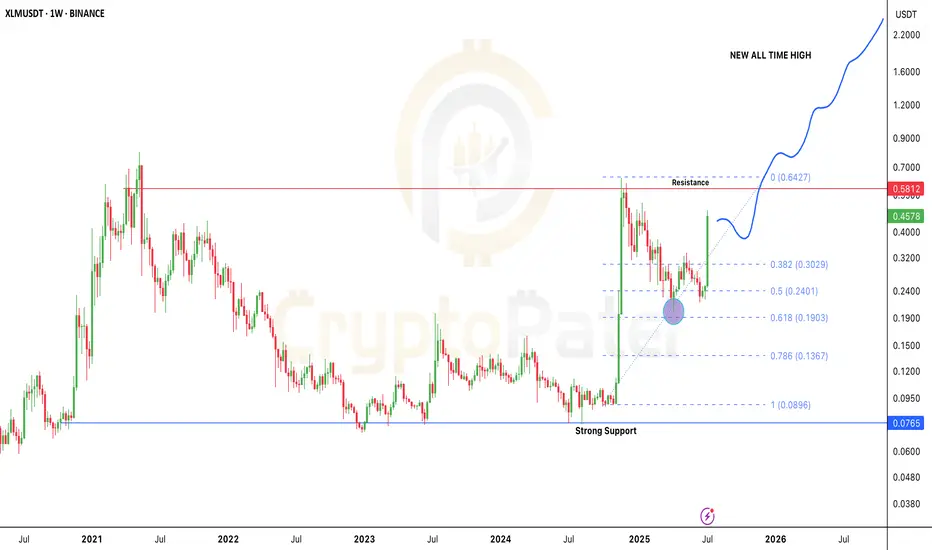
Stellar Breakout: Is $XLM the Next 10x Altcoin of 2025?After months of sideways action and accumulation, Stellar is finally showing real strength.
In the last 4 weeks alone, CRYPTOCAP:XLM has pumped over 120%, bouncing perfectly from the key 0.618 Fibonacci level near $0.19 — a classic reversal zone.
Here’s what’s really going on 👇
🔹 Back in Nov 2024, CRYPTOCAP:XLM went from $0.09 to $0.6374 in just 30 days — that’s a 600% move!
🔹 After that huge rally, price corrected nearly -68%, landing right at the golden Fib zone.
🔹 And guess what? Buyers stepped in hard, flipping the trend back to bullish.
Could we see a pullback?
Sure — maybe a small dip toward $0.30 (0.382 Fib). That’s normal. But the overall structure looks super bullish right now.
Major Resistance: $0.58
If that breaks and flips into support — we’re likely headed toward $2–$5 in the next wave.
This is one of the cleanest macro charts in the altcoin market right now.
👇 Drop your XLM target for this bull run in the comments!
Let’s see who’s aiming for the moon.
Note: DYOR & NFA
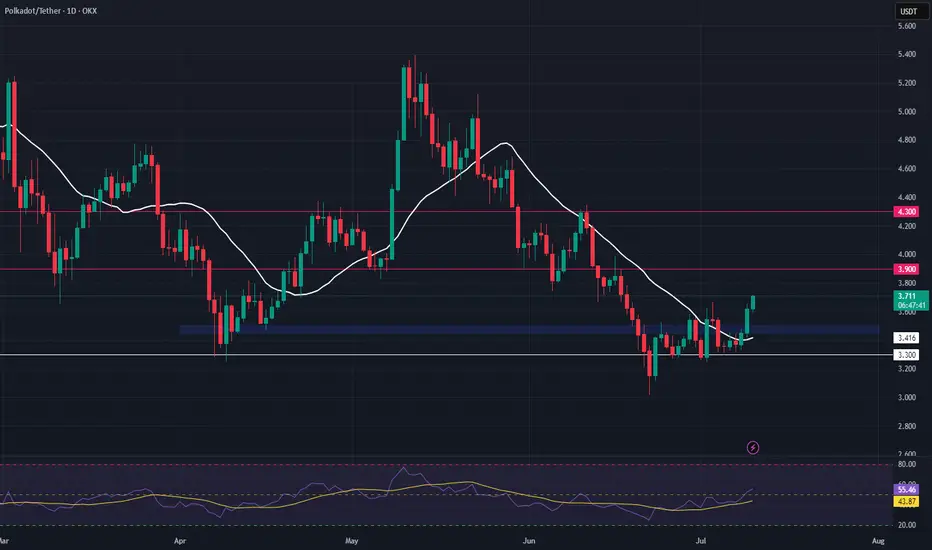
DOT Long Swing Setup – Structural Recovery with Support RetestDOT is showing early signs of recovery, reclaiming its 20-day SMA and flipping key horizontal resistance into support. We’re now watching for a retest of the $3.45–$3.50 zone to confirm the level and trigger a long entry.
📌 Trade Setup:
• Entry Zone: $3.45 – $3.50
• Take Profit Targets:
o 🥇 $3.90
o 🥈 $4.30
• Stop Loss: Daily candle close below $3.33
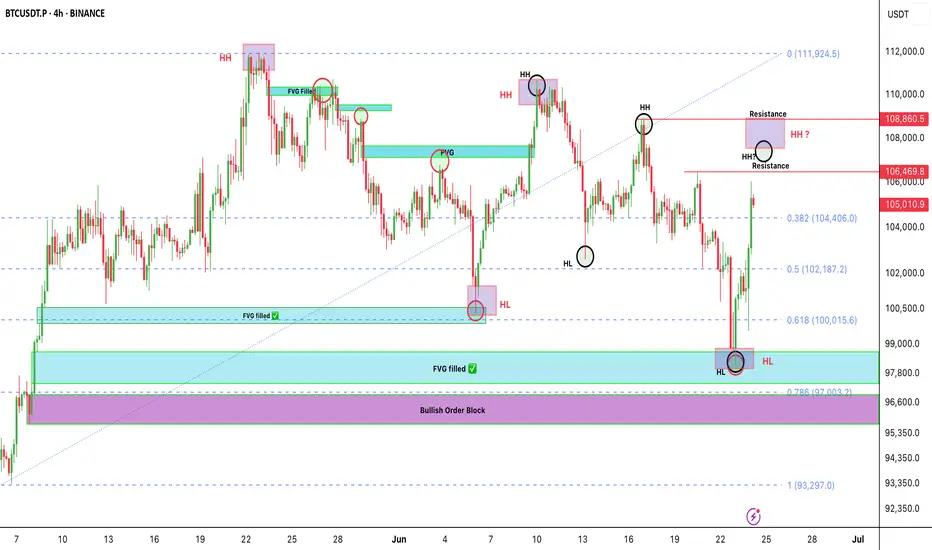
Bitcoin isn’t fully bullish yet — most people are falling for thBitcoin isn’t fully bullish yet — most people are falling for the trap
BTC just bounced beautifully from the $97.8K–$98K demand zone.
It tapped into key confluences:
✅ FVG filled
✅ 0.618-0.786 Fib level
🟪 Bullish Order Block just above 0.786
But let’s be real — we’re not in full bullish mode yet.
This looks more like a short-term pullback, not a trend reversal.
What I'm Watching Closely:
🔹 BTC is forming two HH & HL patterns.
🔹 Super important for us to track both — they’ll guide the next big move.
🟥 LTF last HH = $108,900
🟥 HTF last HH = $110,654
As long as BTC stays below these, the structure is still bearish.
We only flip bullish when candles break and close above them.
If Bullish Breakout happens? We’re eyeing new ATH targets toward $150K 🚀
My Plan Right Now:
🔹 Watching $107K & $109K levels for clean short setups.
Why?
👉 Low-risk entries
👉 Tight SL
👉 Big reward — Targeting around $100K
Stay alert, don’t chase. Let the levels come to us.
Let me know in the comments 👇 Are you flipping bullish, or still cautious?
NFA & DYOR
Weekly CT Breakout + 200EMA Flip | GALAXYSURF Structure📉 Main CT Line (Dotted White)
A well-defined counter-trendline finally gave way after weeks of price compression. The breakout was clean, with a strong bullish candle closing decisively above it.
📊 Volume Confirmation
Breakout candle posted a solid spike in volume — the highest weekly volume in months. 💥
📈 200 EMA Broken (Blue Line)
Price has also cleared the 200-week EMA, a key dynamic resistance, now potentially flipping to support. 📉
🟧 Higher Timeframe Supply (Orange Line) / ⚪ (White Lines)
The breakout candle has also stepped into a tight zone between Weekly + Monthly supply, marked by the orange line.
📌 As always, the chart tells the story. No predictions. No assumptions, just structure.
