Short Term Sell EUR/AUDEUR AUD is trading on his Daily resistance, on other side AUD is trading on weekly support we can see a short term Aud bounce from this point , technically EUR/AUD the 1 hour right side is down with a bearish sequence. Near-term while below the the 1/24/19 highs the pair can continue lower again to correct the cycle up from the 2/22/17 lows.
Sell EUR AUD
@1.5985/ 1.6005
target: 1.5925
Stop Loss: 1.6030
Gud luck !
Search in ideas for "FOREX"

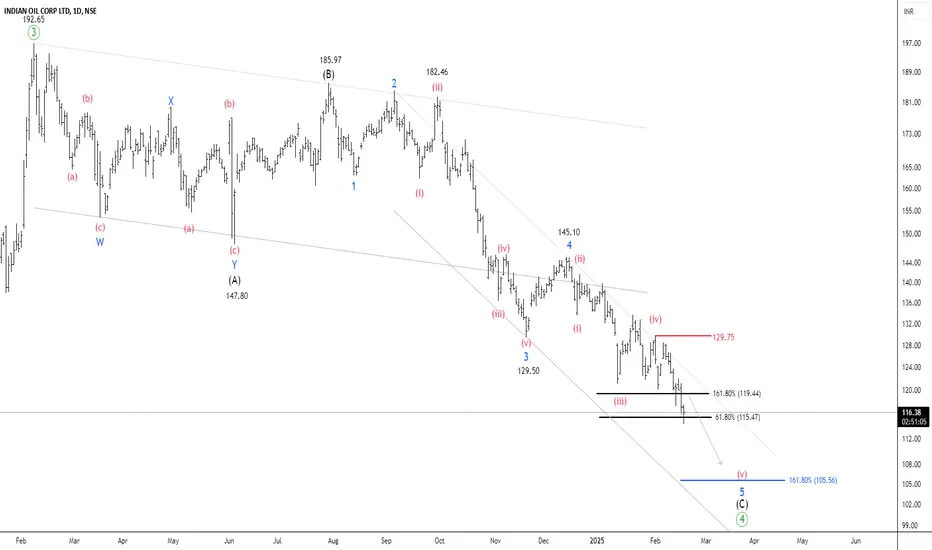
NSE IOC – Approaching a Key Demand ZoneTimeframe: Daily
After reaching a high of 196.8, the price has declined by over 39% in 13 weeks. It is currently trading below the 50/100 EMA band, with ATR at 3.68 and ADX at 26.02 . According to the Elliott Wave projection, the peak of 196.80 can be identified as a wave ((3)). The security is currently undergoing the formation of a corrective wave (4).
Wave (B) formed at 185.97 , while wave 4 of wave (C) was completed at 145.10 . NSE IOC is now setting up for the final wave 5 of wave (C).
Two key Fibonacci relationships help estimate the end of the correction:
1.618 Fibonacci extension of wave (A) at 106.54 (for wave C)
0.618 Fibonacci extension of wave 1 at 115.52 (for wave 5)
The price is expected to settle between 115 and 105 , which serves as a key demand zone for buyers. If the price breaks out and sustains above 129.75, traders can target the following levels: 139 – 156 – 172+.
we will update further information soon.
Can NIFTY Regain Its Balance or Will It Plummet Further?Timeframe: 4h
After reaching a peak of 26,277 , the NSE NIFTY has begun to decline within a downward parallel channel. The Elliott wave structure can be identified as (W) – (X) – (Y) , where wave (X) peaked at 24,867 , followed by a downward movement for the final wave (Y). The price has fallen below the 20 , 50 , 100 , and 200 EMA levels, with an ATR of 166.36 .
The correction has several key levels to consider:
At 100% retracement of wave (W) at 21,962
At 100% retracement of wave (a) at 22,827
At the lower boundary of the corrective channel
Bearish sentiment is currently stronger than buyer demand. A reversal may occur either after a breakout from the parallel channel or at the lower boundary of the channel. This is possible as long as the swing low of 21,283 remains intact.
We will update further information soon.

Is Tata Motors Ready for a Bullish Reversal?Timeframe: Daily
Tata Motors (NSE) has been in an expanded flat correction pattern for the past 11 months. In this pattern, the highest high (HH) was 1179, and the lowest low (LL) was 683.2. Currently, the price is trading below the 200, 100, and 50 EMA levels, indicating a bearish trend.
In this expanded flat correction:
Wave (A) completed at 855.4,
Wave (B) peaked at 1179,
Sub-wave 4 of Wave (C) touched 786.65,
Sub-wave 5 is now unfolding.
Once Wave 5 is completed, traders can look for buying opportunities with target levels at 799 – 951 – 1050+. First, it’s crucial to identify the end of Wave (C) to confirm the correction’s completion and a bullish reversal.
Projecting ending point of wave (C):
Wave (C) may end at 2.618% of Wave (A) around 628.7.
Wave 5 has multiple potential targets/support levels:
0.618 extension of Wave 1 at 526,
0.382 extension of Wave 1 at 628,
1.618 reverse Fibonacci of Wave 4 at 657,
2.618 reverse Fibonacci of Wave 4 at 562.
We will update further information soon.

NSE LINDEINDIA – Elliott Wave ProjectionTimeframe: Daily
NSE LINDEINDIA is currently trading below both the 100 and 200 EMAs, indicating a bearish trend. The ATR stands at 232, reflecting low volatility while supporting the ongoing downward movement. The price action has formed a descending channel, with a clear corrective pattern visible within this structure.
The price has completed wave 5 of wave (C) and begun moving upward. A downward value area is visible near the lower band of the descending channel. The price has reached 100% of wave (A), suggesting it has hit the anticipated Fibonacci ratio, indicating a potential correction. To confirm this assumption, the price must break above wave 4 of wave (C) at 6800 . If this breakout occurs, traders can look for the following targets in a long setup: 7500 – 8198 – 8660+.
We will update further information soon.

GUARGUM51! - Key Trends and Price PredictionsOn the NCDEX, guar gum has formed an Elliott Wave cycle, with the final Wave E of Wave (4) approaching completion. A confirmation above Wave D could shift the entire outlook in favor of buyers. From a price action perspective, 9830 serves as a strong support level, while 13,650 acts as a supply zone, both of which have remained significant for over four years. Wave D represents a critical midpoint, ensuring a push toward the upper supply zone once the price sustains above this level or Wave D.
If the price has completed Wave (4) and has broken above Wave D, it is likely to reach the upper boundary of the value area, around 13,650 . However, with the ADX (Average Directional Index) at 17, this suggests a weak trend, indicating that the current price movement lacks strength. If the price closes below the demand zone at 9,830 , it could delay the expected bullish move. Traders should wait for confirmation before entering a long position to ensure a stronger trend.

TMCFGRNZM: Breakout Could Fuel Bullish MomentumNCDEX TMCFGRNZM is showing signs of potential growth, but the increase so far hasn't been significant. According to Elliott Wave analysis, the price has formed an impulsive pattern, with wave (c) of wave ((4)) reaching a level of 13,000 .
The price is currently in the final wave ((5)) of the impulsive cycle. For this to confirm the impulsive movement, the price needs to break above the level of wave (B), which is at 16,590.
A strong resistance is expected at wave B, and if the price breaks through this level, it could boost the bullish momentum, leading to a new high. However, without this confirmation, the price may not be suitable for long-term investment and could remain in a corrective phase.
We will update further information soon.

GOLD H1hi guys
i hope all of us doing good quick update on gold h1 chart
bullish targets
1777,holding above next targets open on 1782,1787,1796,1799
1782 holding above next targets open on 1787,1796,1799,1805
1797 holding above next targets open on 1799,1807,1825
1799 holding above next target open on 1807,1817,1825
bearish targets
1812 holding below next targets open on 1807,1799,1796,1791,1787
1782 holding below nextbtargets open on 1777,1772

GOLD H1hi guys
all of us doing good,previous chart analysis are playing perectly and we are now update on gold h1 chart,yesterday i mendioned swing trade are hit hit accuretly on our favour review on previous posts how well its performed you got a idea
bullish targets
1776 holding above next targets open on 1776,1796
1796 holding above next targets open on 1805
beraish targets
1790 holding below next target open on 1776
1805 holding below next targets open on 1796,17901776,1765
1765 holding below next target open on 1760

GOLD H1hi guys
quick update on gold h1 chart
bullish targets
1783 holding above next targets open on 1788,1797,1803,1806
1791 holding above next targets open on 1797,1803,1806
1806 holding above next target open 1815
bearish targets
1780 holding below next target open on1776
1788 holding below next target open on 1783
1803 holding below next target open on 1797,1791,1788

GOLD H1hi guys
i hope all fo us doing good ,previous chart analysis tragets are hitting accuretely review on it ,past week we are traveling full swing that movement hold on rest litelbit today we are expecting range market buyers and seller aggrasively battel on it stay focus on importans areas
bullish targets
1791 holding above next targets open on 1797,1803,1806
1806 holding above next target open 1815
bearaish targets
1788 holding below next target open on 1783
1788 holding below next target open on 1783

GOLD H1HI GUYS
i hope all of us doing good uick update on gold h1 chart
BULLISH TARGETS
1763 holding above next targets open on 1773,1783,1796
1783 holdng above next target open on 1796
BEARISH TARGET
1804 holding below next target open on 1796,1783,1773, 1763
1796 holding below next target open on 1783
1773 holding below next target open on 1764
1755 holding below next target open on 1739

GOLD H1HI GUYS
i hope all off us doing good ,quick update on gold h1 chart ,
BULLISH TARGETS
1804 HOLDING above the price next target open on 1817
1782 HOLDING above the price next targets open on 1796
BEARISH TARGETS
1796 HOLDING below the price next targets open on 1782
1775 HOLDING below the price next targets open on 1765

GOLD H1HI GUYS
i hope all of us doing good ,previous post i mentioned target levels and its playing perfectly ,review on it
BULLISH TARGETS,
1737 HOLDING above the price next trarget open on 1746,1749,1753,1762
1749 holding above the price next targets open on 1753,1762
BEARISH TARGETS
1746 HOLDING BELOW NEXT TARGETS OPEN ON 1737,1732
1732 HOLDING BELOW NEXT TARGETS OPEN ON 1720

GOLD H1hi guys
i hoppe all of us doing very well ,yesterday market playing very tight and choppy
BULLISH TARGETS
1750 PRICE HOLDING ABOVE next target open on 1761
1766 holding above next target open on 1774
BEARISH TARGETS
1746 HOLDING BELOW next target open on 1736
1761 holding below next targets oppen on 1750,1746,1736
thank you guys

GOLD H1HI GUYS
i hope all of us doing very well , quick update on gold h1 ,t
BULLISH TARGETS
1733,1737 HOLDING above this level next targets open on 1745,1748,1752
1748,1752 HOLDING above this level next targets open on 1756,1759
BEARISH TARGETS
1733,1737 HOLDING below this levels next targets open on 1722
1748,1752 HOLDING below this levels next targets open on 1733,1752
MINOR HOLDING AREAS
1740 minor holding area
1745 minor holding area
thank you so much guys

GOLD H1HI GUYS
i hope all of us diong well ,quickupdate on gold chart,1782,1787 price will be break and hold above market move on next targets are 1790,1795,1800. or 1782,1787 holding below market moves on next target 1771,1766 more update coming soon guy stay tuned with forex tamil

XAUUSD Next Move As per market condition according to international news and their impact of forex trading below is the next strategy for buying/selling gold...
Buy @1642
TP1 @ 1644
TP2 @ 1653
TP3 @ 1662 - 1674
SL@1632

NSE Bajaj Finserv - Can buyers face falling knives? Timeframe: 8h
Price started to form impulsive wave C after Bajaj Finserv completed correction wave B. There is also the possibility of altering the count with W-X-Y.
Wave (b) retraced 50% of wave (a), which signals intense supply pressure. If the price breaks wave (a) at 1621, traders can sell for the following targets: 1594 – 1569 – 1549 . Calculations are based on Fibonacci extensions. Price has completed 100% Fibonacci extension in wave A so that wave C could extend by 161.8% .
Currently, the price has broken down to 50 EMA , and a negative closing will result in further price declines. Parallel channel throw-over is one of Elliott wave principle’s best target measurement tools. Targets will be extended in case of an extension of the trend.
I will update further information soon.

IS NIFTY PREPARING FOR 14800?Nifty is forming in a descending parallel channel. Prices are building corrective pullbacks to manage demand pressure and fall from resistance since the start of the correction. Nifty has created a lower low at 15183 and given an upward move of 15927 .
Nifty has faced supply pressure on the upper band three times. It indicates that bulls are not exceeding supply pressure and upper band. As bulls give up, bears enter and drive prices to lower levels.
16200 is strong resistance for bulls and the supply zone of the parallel channel. If the price sustains below 16200 , traders can expect the following targets: 15740 – 15326 – 14870 . We can expect a fake-out of the parallel channel.

AXIS BANK: Peculiar Reversion Or Trend continuation?Axis bank has been in the consolidation phase for more than 15 months. Prices fall rapidly after the crossover of 50 & 200 EMA . We can draw two control lines which can be helpful for target measurement.
If the price enters into the parallel channel, and after retracement sustains above 680 , traders can trade for the following target of 692 - 714 - 752 . Demand pressure can lead to the price at the upper band of the parallel channel.
Failure of sustainability above 680 may lead to a new low.
Let market earmark first before you commit to the market.

Pokarna Stock Is A Money-Making MachinePokarna has completed its impulsive wave c of the corrective wave ((4)). Wave C has traveled 100% Fibonacci extension of wave A at 548 .
Currently, the price has broken down the A wave at 585. If it sustains below 585 , traders can expect the following targets: 558 - 536 - 505 .
505 is strong support because corrective wave 4 accomplish near the corrective wave 4 of a lower degree. If the bull fails to keep the price above this level, we can see a big downfall.
Otherwise, the price will touch the control line and then the upper band of the descending channel .
I will update further information soon.

Adani Transmission in Final 5th WaveAdani Transmission (Closing Price: 1869.9)
According to Elliott Wave projection, Adani Transmission price will hike and touch 2118 - 2304 - 2364 levels. And the day traders can expect 1920 - 1946 levels.
