LTC next move analysis after recent breakout from 116
price has made its first pullback on hourly chart
it look like a channel consolidation
if the price breaks down then it might act as breakout and retest at 116
if it breakout above from the channel then 138 would be next resistance
Search in ideas for "LTC@"


LTC Litecoinexpecting more than that
buy the dip
easy %50 chance.
Just buy and Wait. Charlie will do something.

LTC LongAccording to all the resistance and support of the past, we can conclude if it breaks $230 levels then it may go up in short term. Its just an prediction, invest on your own wisdom.

LTC Breakout Downward. As I give a call of breakout for LTC.
the breakout is downwards.
❤️ If you find this helpful and want more FREE forecasts in TradingView
Please show your support back,
Hit the 👍 LIKE button,
Drop some feedback below in the comment!
❤️ Your Support is very much 🙏 appreciated! ❤️
Now, it's your turn!
Trade well, ❤️

#LTC Falling wedge After re-testing the demand zone, LTC has given a breakout from the falling wedge pattern. Buy after re-test or pullback.
Educational purpose only - trade at your own risk.
Good Luck.

Ltc usdt we got a triangle break outwe got triangle break out on bullish side + macd bullish + rsi bullish + W pattern bullish + fundamentals bullish + sentiments bullish + elliot wave bullish what do you want more target is- mid term

LTC Pulls Back From Support Level Of $128.02Litecoin (LTC) market price is in an uptrend with a pullback from its healthy support level of $128.02. The price is below 50 days, EMA and 200 days, EMA. One can further expect a bullish trend if it sustains above the EMA; the price can move towards the resistance level of $161.16.
Resistance: $161.16
Support: $128.02

LTC About To Breach Support $160Litecoin (LTC) drops trades between 20 and 50 days EMA also, resistance level $174.20. As all technical indicators suggest it will soon downsurge below 50 days EMA, we can further see a bearish trend till the support level of $160.39 for the upcoming trading sessions.
Resistance: $174.20
Support: $160.39

LTC is set for huge break outIt's been long time and consolidating.
LTC has lot of upward movement to reach 2020 ATH


LTC next move willl touched $500here is some way of LTC going to touched $500 in next rally, but yes it change according to price


LTC $3100 in 2021Here is histroy of LTC coin before & after of halving you can clearly see in chart if after halving we can take up to only half 5000% we are on $3100.....


LTC ANALYSIS BULLISH SCENARIOIn my opinion LTC has to hold $42 for a bullish scenario. If this is actually the 4th wave down before the 5th wave up to the 1.618 extension. If does happen, I'm going to consider a bullish outlook as we could possibly make 5 impulse waves up rather than an ABC correction.

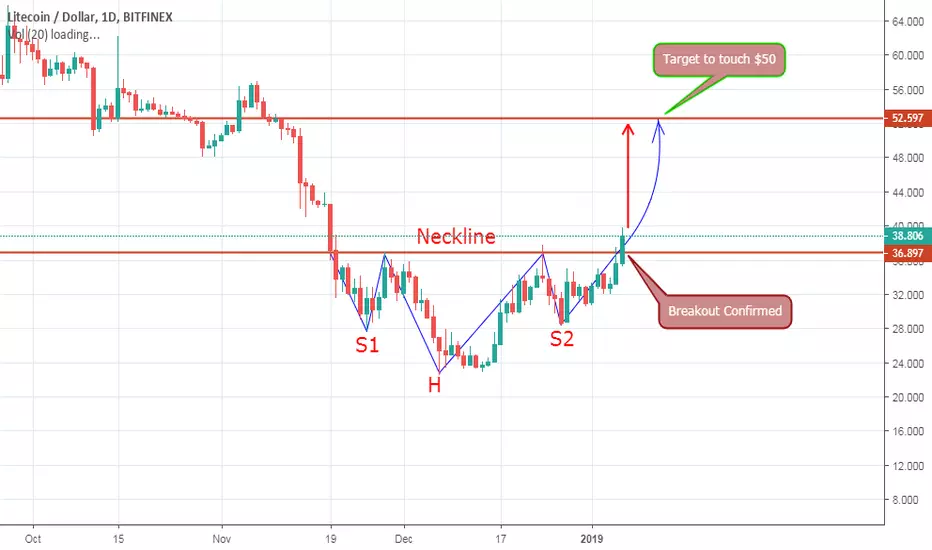
LTC Latest Chart Analysis Hello Everyone Hope you are doing good
In This Chart we can clearly see Breakout of Inverse H&S Pattern which is a Positive sign of Uptrend Current Price of Litecoin is $37.88 and it can move upto $50 as per this Chart Pattern. The area of $27.701–$29.349 is a critical support zone on the downside.
Hope this will help you
Thanks For watching Hit the like button if you like my work.

LTC/USD Critical Point SpottedHey folks!
No time to explain...straight to the chart:
LTCUSD is about to break its local resistance level (see previous structures that confirm this argument). Moreover, according to the Ichimoku (20/60/120/30 - perfect settings for crypto currently) the price is about to complete the breach and hence there is a strong indication for the price to go even higher. MACD - overcross spotted! RSI is steadily climbing higher. In general, if you look at Fibonacci retracement 38.2% - this is the next critical level which if breached opens the road to 61.8%. If you take a sharp look at the Fibonacci Extention line 38.2% you can notice that this line almost perfectly aligns with 38.2% of Fib.Retracement which combined is a strong price level for LTC.
The market is currently in favour of crypto and it looks like we are in a "recovery" stage. Though, not entirely.
Anyways, plz always do your own due diligence. I am waiting for the resistance level breach.

LTC is ready for 3rd wave.According to Elliot Wave 2nd wave is completed and its ready for the 3rd one which is going to be around 250-255.

LTC analysis for Indian Exchange Koinex users.After a few days of bullish trend, LTC/INR going to stable at 14000 to 14800 until it breaks the first resistance which is around 15400.

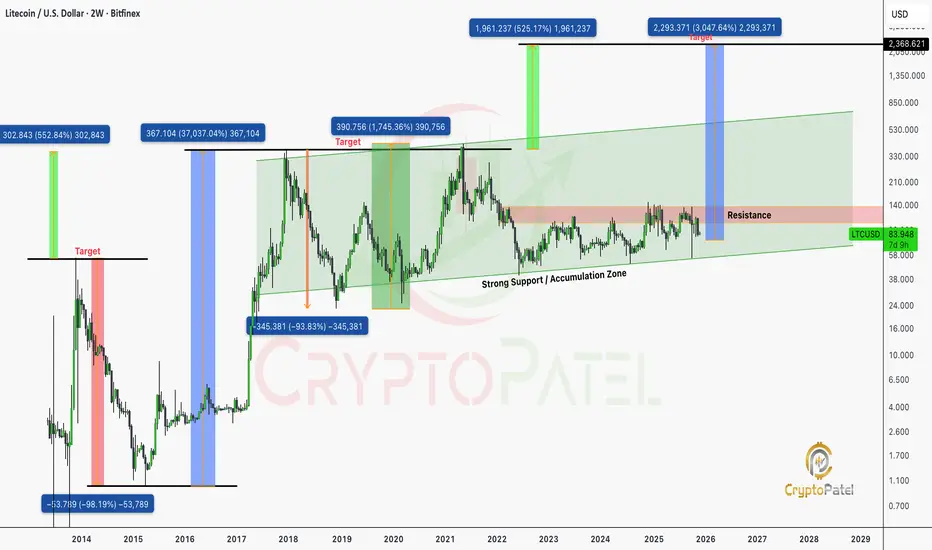
Is $LTC Dead? The Same Question Asked Before Every Major Rally…Is CRYPTOCAP:LTC Dead? The Same Question Asked Before Every Major Rally…
When markets forget history, they repeat it. Litecoin has gone through multiple full-cycle Retracements, Each time followed by explosive multi-X expansions. Let’s walk through the data:
🔰 2013–2015 Cycle: “LTC is Dead” #1
🔹 LTC hit an ATH of $55 from $1.
🔹 Retraced ~98%, bottoming at $0.985 within 16 months.
🔹 Retail sentiment: “LTC is dead.”
🔹 Smart money quietly accumulated.
Result?
$0.985 → $9 in 4 months (≈ +900%)
Eventually: $0.985 → $370 in 3 years (≈ +37,000%)
🔰 2017–2018 Cycle: “LTC is Dead” #2
🔹 New ATH: $370
🔹 Retracement: 92%, down to $23
🔹 Again: retail capitulation.
Result?
$23 → $146 in 6 months
$23 → $413 by May 2021 (≈ +1700%)
🔰 Current Market Structure (2021–2025)
🔹 Previous ATH: $413 (May 2021)
🔹 Current price: ~$84
🔹 Drawdown: 80%
Retail narrative: “LTC is dead.”
TA narrative: This is historically the accumulation zone.
Technical Outlook (Cycle-Based TA Projection)
Every prior deep-cycle retracement (80–98%) has led to:
🔹 Fresh multi-year impulse waves
🔹 New macro highs
🔹 Massive ROI expansion for accumulator wallets
Based strictly on historical cycle symmetry, volatility bands, and LTC’s halving-driven structure:
LTC Bull-Run Projection:
$600 – $1,000 is a reasonable and technically sound target range for the current macro cycle.
This would represent:
🔹 Breaking the 2021 high
🔹 Completing a full 5-wave macro structure
🔹 Returning to historical expansion ratios seen in every prior cycle
So You Already Know What Happens Next.
Litecoin’s entire history is built on max pain → max gain cycles.
Every 80–98% retracement has delivered its largest multi-X rallies after retail gave up.
Smart investors accumulate when the chart says accumulate, not when the crowd screams “dead.”
FINAL MESSAGE
LTC is not dead. It is in the same deep-value zone where every previous mega-cycle began.
If the market delivers another historical impulse, the $600–$1000 range remains a technically justified target.
Accumulate dips.
Ignore noise.
Let the chart speak.
Not Financial Advice so Always Do your Own Research Before Any Investments.