$LTC to $500–$1000? Could Explode in the Next Alt SeasonCRYPTOCAP:LTC to $500–$1000? Could Explode in the Next Alt Season
CRYPTOCAP:LTC has been slow-growing, but I see strong potential here. I’m holding tight.
Imo, CRYPTOCAP:LTC could easily hit $500 during the next alt season. If it drops below or near $90, that’s a solid opportunity to accumulate for long-term gains.
A 10x from here isn’t impossible: $500–$1000 is within reach, but it will require patience.
Worth noting: CRYPTOCAP:LTC didn’t hit a new ATH after the 3rd halving, unlike the first two, which reached new highs within about 1000 days. This suggests there’s still a real chance for CRYPTOCAP:LTC to hit a new ATH within the next one Year.
Stay patient, plan your entries, and don’t get caught up in FOMO.
⚠️ Disclaimer: NFA. Crypto is risky. DYOR and only invest what you can afford to lose.
Search in ideas for "LTC@"

will $LTC/USDT ready for $500 in bull run?CRYPTOCAP:LTC Took Off from $55 — Now Gaining Momentum Again, and $500 Might Be Closer Than You Think
CRYPTOCAP:LTC has delivered strong gains from both our entries:
✅ First entry at $55 — now up 140%
✅ Second entry at $70 — currently up 85%
Currently, CRYPTOCAP:LTC is trading around $117, sitting right at a key resistance level.
If this resistance breaks, we could see a strong rally toward $300–$500 in this bull run.
My Target:
I’m still expecting $500 as a realistic target and anything beyond that is a bonus.
NFA & DYOR

$LTC alert: perfect rebound – $200-$400 next? Don't miss it! NYSE:LTC played out exactly as expected.
It bounced perfectly from our accumulation zone between $60–$70, and is now already up 45% from our entry.
The next big Resistance at $120–$140. If that breaks, we’re eyeing targets of $200 / $300 / $400 / $500.
Yes, $1,000 is still possible, but for now, our focus is on the $500 mark — and I believe this bull run could be the one that finally takes NYSE:LTC there.
I’m confident NYSE:LTC will outperform again, just like in the previous cycles.
And let’s not forget — our very first entry was back at $50.
Are you ready for Litecoin’s next leg up? 👇
Note: NFA & DYOR

Major Breakout Loading? $LTC Holding Strong at Key SupportMajor Breakout Loading? NYSE:LTC Holding Strong at Key Support
NYSE:LTC is currently consolidating around the $98 level, showing a minor pullback after a failed breakout above the key resistance zone ($101–$128). This red zone has historically acted as a major supply area, rejecting price multiple times.
Key Observations:
➡️ Strong ascending trendline support remains intact since 2019.
➡️ Price retraced from resistance and is hovering near the re-entry zone ($79–$94).
➡️ If LTC reclaims $115+ with volume, a breakout towards $150–$230 is likely.
➡️ Rejection from this zone could lead to another retest of the green re-entry area.
Strategy:
➡️ Watch for bullish confirmation above $115 to aim for mid-term targets.
➡️ Aggressive buyers may consider scaling in between $79–$94 with a tight SL.
➡️ Long-term target remains around $229, $389, and beyond if macro trend continues.

Is LTC Price Poised For A Growth To $100 Soon?Litecoin has a market cap of $5.3 Billion and is currently ranked 19th in the CMC. The volume of the asset price has observed a growth of over 108% in the past 24 hours. LTC is currently trading near the value of $72 with a slight drop in the past 24 hours.
LTC is currently trading forming weak bearish candles on the daily chart. It is trading below the 50 and 100 EMA on the daily chart. The upside trend of LTC can see a halt near the value of $85. Meanwhile, the support of the asset price can be observed near $65.
The RSI of LTC is near 34 suggesting its presence in the neutral zone. The overall sentiment of the RSI is neutral.

Last time Litecoin was here, it went up 10x. Can it do it again?🚨 Last time Litecoin was here, it went up 10x. Can it do it again?
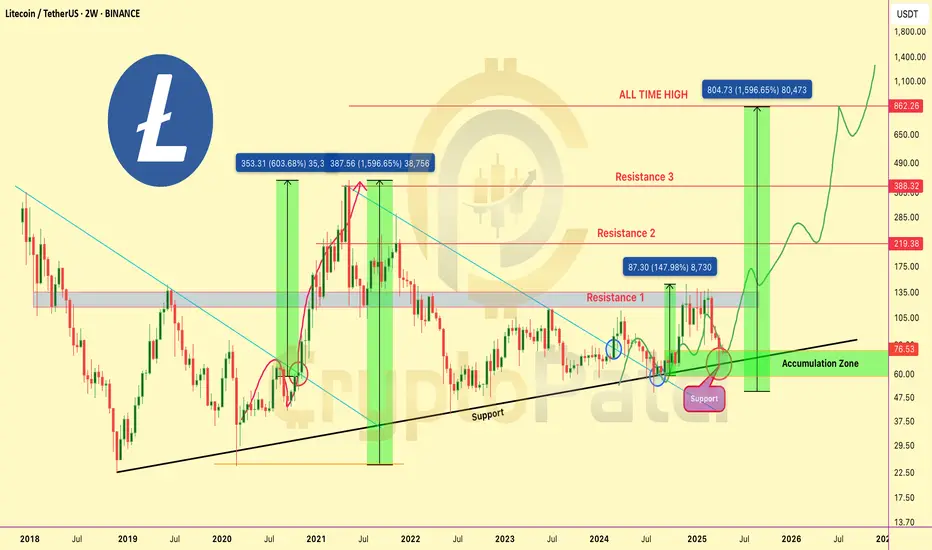
CRYPTOCAP:LTC is back in its accumulation zone ($60–$80) — the same area where it kicked off a 600%+ rally in 2020 and a 1,500%+ move in 2021!
Every time Litecoin touches this zone, it doesn't just bounce… it rockets 🚀
Right now, it's holding the long-term uptrend support line, showing signs of strength. If we break above the $105–$135 resistance, the next targets are:
👉 Mid-term: $219
👉 Long-term: $388 — and possibly even the $862 ATH 👀
With the structure this clean and history on our side, this could be one of the best R/R setups in the market right now.
Accumulation phase doesn't last forever. Eyes on LTC 👇
🟩 Buy Zone: $60–$80
🟥 Stop-loss: Below $58
💎 Targets: $135 → $219 → $388+
Patience might just pay off big this cycle 💎
trading volume rises and the LTC chart risesAccording to the chart’s layout, Litecoin hasn’t been significantly impacted by the recent bull run in the cryptocurrency market. It has exhibited a gradual but consistent growth till now. In February last week, the LTC price achieved slight bullish momentum, but bulls were not too strong to keep the pace up.
In the past few weeks, the sellers have been attempting to push the price below the 200-day exponential moving average. However, buyers have managed to defend the 200-day EMA so far.
Based on the technical indicators, the MACD has continuously developed small histograms over the last few days. Signal line and MACD lines appear to be gaining buying momentum. RSI is 51.01, which has just surpassed the 14-SMA from below and seems headed toward the overbought zone.
Can Litecoin Claim $100 Mark? Let’s Decode On Daily Chart
At the press time, the Litecoin price traded at $83.24, which is up by 1.01% in the past 24 hours. The market capitalization is $6.21 Billion, and the 24-hour trading volume is $271.14 Million.
Litecoin's price has been on an upward trend, increasing while finding support on the trendline and key moving averages. For the last few days, the Litecoin crypto price has been facing hurdles from the dynamic 20-day EMA, but recently it has jumped over it with a weekly performance showing 2.36%.
If the trading volume rises and the LTC chart setup appeals to potential investors, the Litecoin asset price could experience bullish momentum and could aim for the $100 obstacle in the future.
Moreover, buyers may start accumulating if the Litecoin price reaches and holds above the previous swing high of the $88.50 price mark, it could spike above. In a scenario, if the price triggers a breakout from this hurdle at $88.50, then buying momentum for the long term can be expected to test the supply level. Likewise, once the supply happens to be breached, the doors would open for more upward momentum.
However, should the LTC cryptocurrency price fall below the trendline or the previous swing low at $78, there could be a short-term increase in selling pressure. Meanwhile, if buyers fail to defend the $60 resistance, then selling pressure for the long term can be observed.

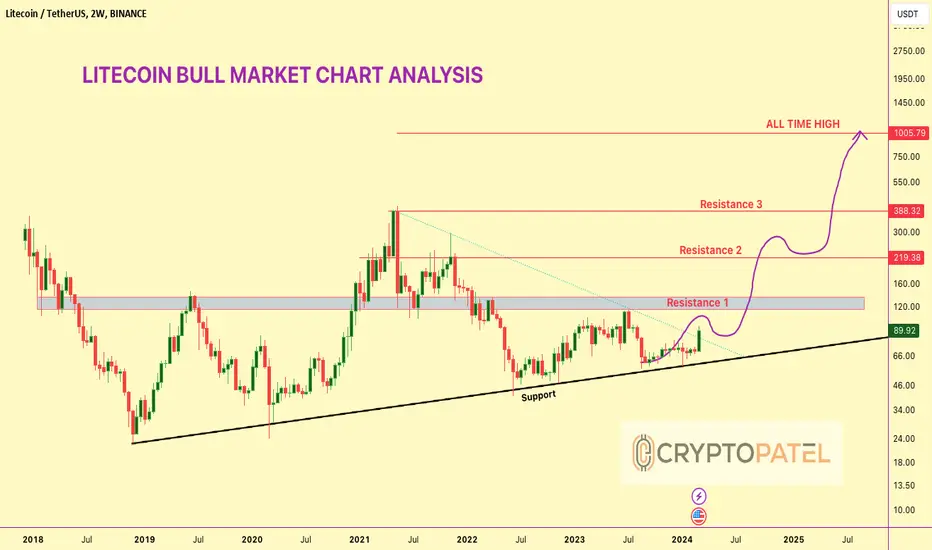
LITECOIN BULL MARKET CHART ANALYSIS#LITECOIN BULL MARKET CHART ANALYSIS
1⃣ CRYPTOCAP:LTC Stong Bounced From Support $60 Level
2⃣ Next Major Resistance is $115-$120 Level
3⃣ Bull Market Targets: $219/$388/$500/$700/$1000
4⃣ Entry: Buying Dip is good Opportunities
5⃣ Profit: Almost 50% Up from Our Last #LTC Setup
6⃣ Long Term: I am Super Bullish in the Long Run
RT/Like if you agree with my setup.
Thank you
#Cryptocurrencies #Altcoins
Litton Ready for $1000 in bull market?#LITECOIN will pump very hard, you bid yet or not?
- CRYPTOCAP:LTC - Litecoin Price Projections:
Bullish short & long-term outlook based on Past market history.
- Price Targets:
Short-term: $500
Long-term: $1,000-$1,400
- Accumulated substantial LTC holdings during the recent dip. Ideal risk/reward entry point secured.
- Next Steps: Will provide updates on exit strategy specifics as bull market momentum accelerates. Locking in gains at optimal intervals is the priority.

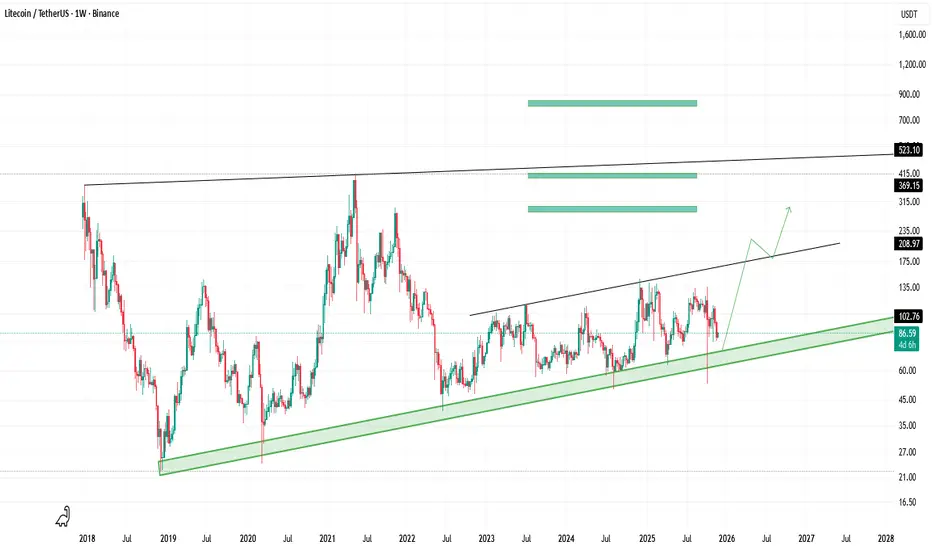
Is LTC Replicating XRP’s Historical Pre-Breakout Formation?📌 LTC/USDT Analysis – Weekly Timeframe
Litecoin has consistently shown positive reactions to this major support zone over the past years. This level has repeatedly prevented deeper declines and remains one of the strongest historical supports for LTC.
🔹 Key Resistance Levels
Heavy resistance: around $180
Historical resistance: around $450
🔹 Green Zones: Targets
Based on the current market structure, the green highlighted areas represent potential upside targets:
Target 1: $280 – $300
Target 2: $400 – $420
Target 3: $800 – $830
🔹 Important Structural Similarity
The current LTC structure shows a strong similarity to XRP’s chart before its major breakout, where price spent a long period consolidating and repeatedly reacting to a critical support zone.
🔹 Suggested Buying Strategy
Considering the consistent reactions to this support, a laddered (DCA) buying approach may be a more suitable strategy to manage risk effectively.
⚠️ Disclaimer:
This is only a personal opinion and not a buy or sell signal
$LTC ACCUMULATION PHASE IS OVER: Ready to $500?🚨 CRYPTOCAP:LTC ACCUMULATION PHASE IS OVER 🚨
✅ Strong bounce from 7-YEAR trend line support
✅ Soon Break out 4-YEAR descending wedge
✅ Re-accumulation zone: COMPLETE
1️⃣ Target 1: $216 (+129%)
2️⃣ Target 2: $388 (+311%)
3️⃣ Target 3: $532 ALL-TIME HIGH (+464%)
👉 Last time this pattern played out = 1,596% PUMP
But yeah, keep buying at ATH 🤡
NFA & DYOR

LITECOIN $500 Potential In Current Bull: Detail AnalysisLITECOIN MACRO BREAKOUT – NEXT LEG INCOMING?
NYSE:LTC confirmed a breakout above its multi-year resistance line after holding the Best Accumulation Zone for months!
🔸 Support Held: ~$65
🔸 Accumulation Zone: ~$85-$65
🔸 Short-Term Target: $255/$500
🔸 Long-Term Target: $1000/$1458+
Same pattern. Same zone. Same breakout.
🔥 I’m super bullish on #Litecoin.
Yes, it has tested our patience… but one strong day in this bull market and it could smash $500.
Let’s not forget — our initial entry was around $50, and it’s still a great range to accumulate.
While $1000–$1500 may not happen this bull run, I personally believe it’s possible in the near future.
⚠️ Of course, this is not financial advice — just my personal view. Always DYOR before investing in any coin.

Can LTC Price Break Free Of Consolidation?Litecoin has a market cap of $5.6 Billion and is ranked 18th in the crypto verse. It has seen a decline of 18% in volume in the last 24 hours. LTC price is currently trading near the value of $75 with a small drop in the intraday session.
Litecoin price is currently forming weak bearish candles on the daily chart. It is trading below the 50 and 100 EMA on the daily chart. The upside trend of the asset price can see a halt near the value of $85. Meanwhile, the asset price support can be near $70.
The RSI of LTC is near 47 with no slope in it. The overall sentiment of the RSI is consolidating in nature.

LONG LTCAfter consolidation, LTC about to give breakout.
Buy LTC 84.4$, t1 88, t2 91, t3 99, t4 110, Strict SL 78.2. Keep booking profits and revising SL's.

LITECOIN - Falling Wedge PatternNYSE:LTC 1-hr. Chart Analysis
Litecoin moving under #FallingWedge Pattern from last 10 days, and it was created new #ATH of 2023 on 1st July 2023 at $115 and after that continously falling from previous All Time High Mark 10 days ago.
Under this Falling Wedge pattern and #FIBretracement markup points, mostly chances to reach out again $88 to $85 within coming 3-5 days, if market is not suddenly Pumping out before that.
Always #DYOR and Trade wisely by using #StopLoss, It's #NFA
Must LIKE & SHARE it..

LTCUSD Coinbase - Looking for EntryI do not think I will be entering COINBASE:LTCUSD any time soon. I am looking for long opportunities in my trades and want to get in on the next long term trend. Here we have the price under the 200 day EMA and Supertrend still shows negative. The candle formations which are Heikin Ashi indicate a continued downward trend but there has been some indication of a possible reversal coming.
The last line of support indicated in green is not that strong as historically their are not many other points where we have seen this support hold, but the red resistance line is very strong with the price fighting this level plenty of times in the past, which tells me even if we see a reversal in the next few days unless volume picks up we wont see a trend change for awhile. The EMA is below this line of resistance so I foresee LTC being down for awhile. No signs of a long term entry in sight.
The last time LTC was in a downtrend it lasted just about two months. Before that it was most of a year in a downtrend. I do not short stocks or coins, I'm just not good at it, but if you are I would love to hear your thoughts.

Litecoin looks ready to make a shift in trendLitecoin is a slow-mover. While most altcoins are surging higher, LTC seems to be taking its time.
I believe the daily supply zone ($210 to $241) is about to be flipped.
A successful flip will allow LTC to rally to the previous week open at $295.
NFA. DYOR.

Short LtcThe strategy utilizes a combination of trend analysis and momentum indicators to identify potential downtrends in LTC's price action. It aims to capture profits from downward price movements by entering short positions when the conditions align.

H&S formation in LTC 1hr chartDespite of the upcoming halving event, LTC 1hr chart shows formation of H&S pattern. A down move till the trendline support is expected. It's only a chart based analysis not a financial advice.

LITECOIN (LTC) This is based on the Elliott Wave Theory. The current structure can be assumed as a triangle due to internal ABC formations. This suggests that the price would remain bullish from the current levels.

Great opportunity to long Ltc🚀Hello guys
Here is the great Buy opportunity in LTCUSDT. Price was moving in Acending Triangle from many days and it confirms the beakout. Athough price already retested but you could buy wait if you want to for retest again and enter.
- Put your Stop Loss below the Breakout candle.
- Take profit should be 286usd and then 360usd or you can trail it too if you want.
Happy Earning

23R setup on #LTC #BTC.Guys, this is such a worthy opportunity. I dont mind if the SL hits. Though I dont think that’ll happen easily. See if u find it tradable. All the best

Long LTC once 7100 support is confirmed, Target 7800Long LTC once 7100 support is confirmed, Target 7800, OBV suggests this will be done...
