#MSFT aka #Microsoft Looks TOOO GOodWith multiple supports and clean PA, i think stops of 300 with targets of 328 in a week is acheiveable! 1:4 Ratioo
Search in ideas for "MICROSOFT"

Stay away from Infosys and IT sector.....Divergences are visible on the yearly chart of Infosys and a Double top is also visible on the chart. Something similar is being seen in all the largecap of IT. this means that even after going down, it will not come up for a long time. There is also a diversion on the yearly chart of Microsoft & Apple. A breakdown has occurred on the weekly chart of Microsoft.

short side microsoftHello guys i had find this setup in 1h timeframe which is made double top and also broken trendline with market structure we have a good selling opportunity from here with above resistance sl and below support target also plzz do your own analysis before taking trade if you like my analysis plz like share and follow thank you

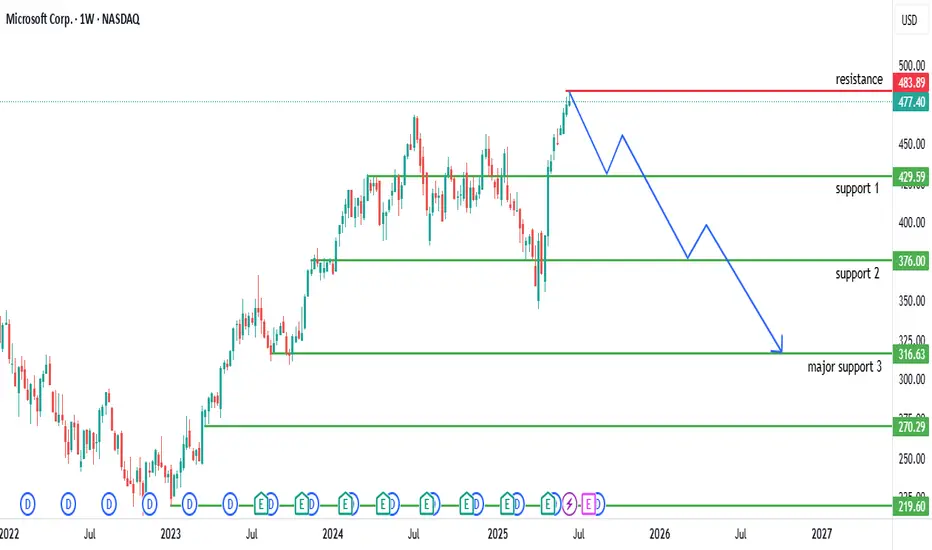
Analysis of Microsoft Corp. (MSFT) Weekly ChartHistorical Trend: The chart illustrates Microsoft Corp.'s stock price on a weekly timeframe from 2022 to mid-2025. The stock showed a steady upward trend from 2022 to early 2025, reflecting strong growth driven by its dominance in software and cloud computing.
Key Levels:
Resistance: The $483.89-$477.40 range (red line) has acted as a significant resistance level. The price recently tested this zone and appears to have faced rejection.
Support Levels:
Support 1: $425.59 (green line) served as a mid-range support during recent corrections.
Support 2: $376.00 (green line) acted as a stronger support level during prior consolidations.
Major Support 3: $316.63 (green line) represents a critical long-term support zone, tested during deeper pullbacks.
Recent Price Action: After approaching the resistance at $483.89, the stock experienced a sharp decline, forming a descending pattern (blue line). This suggests a potential bearish reversal or correction following the rejection at resistance.
Projected Movement: The downward projection indicates the stock could decline toward the $316.63 major support level if the bearish momentum continues. A break below $376.00 would confirm this trend, while a bounce from $425.59 could signal a potential recovery.
Volume and Indicators: The chart includes Bollinger Bands (O475.21 H483.46 L474.08 C477.40) with a -2.44 (-0.51%) change, indicating moderate volatility. The recent drop suggests selling pressure, though specific volume data is not detailed.
Outlook: The stock is currently in a bearish phase after failing to break above $483.89. Watch for a potential test of $425.59 or $376.00 supports. A recovery above $477.40 would indicate a resumption of the bullish trend, while a drop below $316.63 could signal a deeper correction.
Double bottom pattern in Microsoft a double bottom pattern in Microsoft in day candle. if stock sustains over 343 $, we might see a good upward rally.


microsofty buy 315.30 stop 310 target 328....13 pointsstrong upside from here 13 points
315 to 328++
my view only
educational purpose only


Microsoft (MSFT) Trade Setup: Swing TradeCurrent Price: $431.97
Risk-Reward Setup: Risk $10 to potentially gain $40.
Entry Point:
The price is currently hovering at $431.97. This level seems to be consolidating after a recent upward move, likely providing a decent entry point if the market remains bullish.
Stop Loss:
Stop Loss Set at: $422
This is a $10 risk from the current price. Strategically place it below the current support zone (around $422), where a key moving average or recent price low may provide support. If the price breaks below, it signifies a bearish signal and triggers the exit.
Target Profit:
Target: $471
With a $40 upside target, this aligns with the next key resistance level. Given the current bullish momentum and based on the volume, reaching this level is feasible if the uptrend
continues.
Risk-Reward Ratio:
Ratio: 4:1 (For every $1 risked, you're targeting $4 in profit).
This is a solid ratio, especially for swing trades or medium-term holds.
NOTE : The setup looks promising for a swing trade with a high probability of success if the market sentiment remains positive. As always, ensure to monitor for any sudden market shifts or macroeconomic events that could affect the overall trend.

Microsoft CorporationIf the technicals of this stock are really respected by the market, there is easily 10% safe upside for this stock.It came down because of the Japanese Interest rates increase, but that is already factored into the market. Even the first support level is very well respected by the stock
Let's see if we would be able to see 10% upside in this stock in coming few days.

Microsoft🌟 buy above only 317.50 stop 315 tgt👇👇Tgt1 319.50
Tgt2 321.50
Tgt3 324++
My view upside only above 317.50
Educational purpose only

microsoft buy mode 332.50 stop 330 target 336 next 338.50++downside over ...
upside start from here 332.50 to 336 next 338.50++
my view only
educational purpose only

Microsoft sell Below 327.50 stop 331 tgt 325 next 322 next 316Sell mode start only below 327.50
All tgts possible....
Then my 2nd call active ..👇👇

Microsoft 🌟 sell below 319 only Downside👇👇Sell below only 319 stop loss 324.30
Target price 1 ⭐ 314.20
Target price 2 ⭐ 303
Above this levels possible 👍

Microsoft incgood upmove with stability its a good buy around $280-264-240 or so but with caution and keeping in mind market sentiment...
#investors
its at support of 200ema which is the sweet spot to enter but its all on the earnings report


nasdaq projection for next 30 days ### **NASDAQ: The Tech-Heavy Stock Exchange** 📈🚀
The **NASDAQ (National Association of Securities Dealers Automated Quotations)** is one of the largest stock exchanges in the world, known for its technology-focused companies and electronic trading system.
---
## **1️⃣ Key Details About NASDAQ**
- **Founded:** 1971
- **Location:** New York City, USA
- **Market Cap:** Over **$20 trillion**
- **Number of Listed Companies:** 3,000+
- **Index Type:** Market capitalization-weighted
- **Trading Hours:**
- **Pre-market:** 4:00 AM – 9:30 AM ET
- **Regular hours:** 9:30 AM – 4:00 PM ET
- **After-hours:** 4:00 PM – 8:00 PM ET
✅ **Fun Fact:** NASDAQ was the **first-ever electronic stock exchange**!
---
## **2️⃣ NASDAQ Key Indices**
### 🔹 **NASDAQ Composite (COMPX)**
- Tracks **all** NASDAQ-listed stocks (~3,000 companies).
- Heavy focus on **tech, biotech, and growth stocks**.
- **Commonly used as a benchmark** for the tech sector.
### 🔹 **NASDAQ-100 (NDX / QQQ)**
- Tracks the **top 100 non-financial companies** listed on NASDAQ.
- Heavily weighted towards **Big Tech stocks** like Apple, Microsoft, and Amazon.
- **Traded as an ETF (QQQ)**, popular among investors.
### 🔹 **NASDAQ Biotechnology Index**
- Focuses on **biotech and pharmaceutical companies**.
---
## **3️⃣ Top Companies in NASDAQ-100**
As of **2024**, the largest NASDAQ-listed companies by market cap:
| **Company** | **Ticker** | **Sector** |
|------------------|-----------|--------------|
| **Apple** 🍏 | AAPL | Technology |
| **Microsoft** 💻 | MSFT | Technology |
| **Amazon** 🛍️ | AMZN | E-commerce |
| **Nvidia** 🎮🖥️ | NVDA | Semiconductors |
| **Tesla** 🚗⚡ | TSLA | EV & Energy |
| **Alphabet (Google)** 🔍 | GOOG/GOOGL | Tech & AI |
| **Meta (Facebook)** 📱 | META | Social Media |
| **Broadcom** 📡 | AVGO | Semiconductors |
| **Adobe** 🎨 | ADBE | Software |
| **Netflix** 📺 | NFLX | Streaming |
🔹 *Tech companies dominate NASDAQ, making it highly sensitive to tech sector trends!*
---
## **4️⃣ Why is NASDAQ Important?**
✔ **Technology & Innovation Hub** – Home to the world’s biggest tech giants.
✔ **Growth-Oriented Companies** – Many fast-growing startups choose NASDAQ.
✔ **High Volatility & Liquidity** – Popular among traders due to price swings.
✔ **Global Impact** – Performance influences stock markets worldwide.
---
## **5️⃣ NASDAQ Trading & Investing**
💡 **Ways to Invest in NASDAQ:**
- **Buy individual stocks** (e.g., AAPL, TSLA, NVDA).
- **Invest in ETFs like QQQ (tracks NASDAQ-100).**
- **Trade NASDAQ Futures & Options (NQ contracts).**
- **Use Mutual Funds tracking NASDAQ indices.**
📊 **Factors Affecting NASDAQ:**
- **Tech Sector Performance** 📈
- **Federal Reserve Interest Rates** 💰
- **Economic Reports (Jobs, Inflation, GDP)** 📊
- **Earnings Reports (Big Tech Companies)** 🏢
- **Global Market Trends & Geopolitics** 🌍
---
## **6️⃣ Recent NASDAQ Performance (March 2025)**
🔹 The **NASDAQ-100 recently hit new highs**, driven by **AI stocks, semiconductor growth, and strong earnings from Microsoft & Nvidia**. However, rising **interest rate concerns** and **geopolitical tensions** continue to create volatility.
Would you like real-time NASDAQ updates or stock recommendations? 🚀

LatentView Analytics Ltd (LATENTVIEW)
LatentView Analytics Ltd operates a business model focused on delivering data analytics and digital transformation solutions to drive business growth and competitive advantage for its clients. The company generates value through a combination of services, industry-specific solutions, and proprietary tools, primarily targeting Fortune 500 companies across sectors such as Technology, Banking, Financial Services, and Insurance (BFSI), Consumer Packaged Goods (CPG), Retail, Industrials, and Healthcare.
Key Components of LatentView Analytics'
Value Proposition:
Actionable Insights and Digital Transformation: LatentView helps clients leverage data to gain a 360-degree view of their digital consumers, enabling them to predict new revenue streams, anticipate product trends, improve customer retention, and optimize investment decisions.
End-to-End Analytics Solutions: The company provides comprehensive services, from strategy and consulting to implementation and optimization, distinguishing itself from pure-play analytics firms that focus solely on strategy or delivery.
AI and Data-Driven Decision Making: By integrating advanced analytics, artificial intelligence (AI), machine learning, and data engineering, LatentView empowers clients to make data-driven decisions and enhance operational efficiency.
Core Services:
Data and Analytics Consulting: Offers strategic guidance to align data initiatives with business goals, including analytics roadmaps and advisory services.
Business Analytics and Insights: Provides solutions like marketing analytics, customer analytics, supply chain analytics, risk and fraud analytics, and financial analytics to address specific business needs.
Advanced Predictive Analytics: Utilizes predictive modeling and causal analytics to forecast trends and outcomes.
Data Engineering: Includes data migration, data platform modernization, data activation, and data quality solutions to build robust data foundations.
Digital Solutions: Develops proprietary products like Casper (an AI-based conversational analytics platform), MatchView, and SmartInsights to deliver customized insights with minimal coding.
Generative AI (GenAI) Integration: Focuses on scaling GenAI programs for real-world applications, addressing challenges like data quality and integration to maximize AI impact
Customer Segments:
Industry Focus: LatentView serves blue-chip and Fortune 500 clients in Technology, BFSI, CPG, Retail, Industrials, and Healthcare. It has collaborated with over 30 Fortune 500 companies in recent years, with notable clients like Microsoft.
Global Reach: Headquartered in Chennai, India, with operations in the US, Europe, and other regions, LatentView caters to a global client base, leveraging an offshore delivery model to provide cost-effective solutions.
Revenue Streams:
Service-Based Revenue: The primary revenue comes from consulting, analytics, and data engineering services, tailored to client needs across industries.
Proprietary Solutions: Revenue is also generated through licensing or subscription-based models for products like Casper, which provides AI-driven analytics platforms.
Project-Based Engagements: LatentView undertakes projects such as data migration, business intelligence optimization, and AI-driven automation, often for large-scale enterprises.
Financial Performance: For the fiscal year ending March 2025, LatentView reported consolidated net sales of ₹232.18 crore for Q4, up 35.27% year-over-year, with a trailing 12-month revenue of ₹848 crore and a profit of ₹173 crore.
Delivery Model:
Build-Operate-Transfer (BOT) Model: LatentView employs a BOT model to establish and manage analytics capabilities for clients, eventually transferring operations to them, enhancing scalability and long-term value.
Global Delivery Centers: Operates delivery centers in Chennai and Bengaluru, India, and has expanded its presence in the US and Europe to support global clients.
Partnerships: Collaborates with industry leaders in cloud, data visualization, and customer data platforms to enhance its service offerings.
Competitive Advantage:
Expertise and Scale: With over 1,141 employees as of May 2025 and 18 years of experience, LatentView has built a reputation as a trusted analytics partner.
Industry-Specific Solutions: Tailors analytics solutions to specific verticals, such as retail (e.g., marketing mix, demand forecasting), financial services (e.g., fraud detection, portfolio management), and technology (e.g., investigative analytics).
Public Company Status: As the first analytics firm to go public (BSE: 543398, NSE: LATENTVIEW), LatentView has strong financial stability, with a market capitalization of ₹8,452–8,783 crore as of June 2025 and a debt-free balance sheet.
AI and Innovation Focus: Investments in GenAI and acquisitions like Decision Point Analytics (70% stake for $39.1 million in 2024) strengthen its capabilities in AI-led transformation and revenue growth management.
Growth Strategy:
Acquisitions: LatentView is actively pursuing acquisitions, such as Decision Point Analytics, to expand its capabilities in data engineering and revenue growth management. It aims to double its revenue in the next 2–3 years.
Client Relationships: Focuses on deepening client relationships and expanding through partnerships, as highlighted by CEO Rajan Sethuraman.
Innovation and Recognition: Recognized as an “AI Game Changer” by NASSCOM and awarded for initiatives like the Patient 360 dashboard for the International Myeloma Foundation.
Challenges and Risks:
Low Return on Equity: Reported at 12.4% over the last three years, indicating moderate efficiency in generating profits from equity.
Employee Satisfaction: Mixed reviews on work culture, with ratings of 3.6/5 on AmbitionBox and 3.9/5 on Glassdoor, citing issues with promotions, salary, and work satisfaction.
Market Competition: Faces competition from firms like Quantiphi, EXL, Tredence, TCS, Infosys, and others in the analytics and IT services space.
Dow Futures Trading Strategy 05th December 2024Trading Strategy for Dow Futures:
Buy Strategy:
Entry Point: Enter a long position (buy) above the high of the candle that closes above 45230 on a one-hour timeframe. This means if a one-hour candle closes above 45230, you will buy once the price exceeds the high of that candle.
Stop Loss: Set a stop loss slightly below the low of the breakout candle to manage risk. For instance, if the breakout candle has a low of 45100, you might set your stop loss at 45090 to protect your capital.
Target: Determine your target based on historical resistance levels or a risk-reward ratio. For example, if you're risking 140 points (45230 to 45090), aim for a reward of at least 280 points (e.g., a target of 45510).
Sell Strategy:
Entry Point: Enter a short position (sell) below the low of the candle that closes below 44870 on a one-hour timeframe. This means if a one-hour candle closes below 44870, you will sell once the price drops below the low of that candle.
Stop Loss: Set a stop loss slightly above the high of the breakdown candle. For example, if the breakdown candle has a high of 45000, you might set your stop loss at 45010 to mitigate risk.
Target: Determine your target based on historical support levels or a risk-reward ratio. For example, if you're risking 140 points (44870 to 45010), aim for a reward of at least 280 points (e.g., a target of 44600).
Risk Management:
Use Stop Losses: Always use stop losses to protect your capital and limit potential losses.
Position Sizing: Never risk more than a small percentage (e.g., 1-2%) of your trading capital on a single trade.
Regular Review: Continuously monitor the market and adjust your strategy based on evolving conditions and new information.
Market Context:
Economic Indicators: Pay attention to key economic indicators such as employment data, GDP figures, and interest rate announcements that can impact Dow futures.
Geopolitical Events: Be aware of geopolitical events and developments that can cause significant market volatility.
Disclaimer:
Trading in financial markets involves substantial risk of loss and is not suitable for every investor. The strategies and opinions expressed are those of the author and do not necessarily reflect the views of Microsoft. Users should perform their own research and consult with a financial advisor before making trading decisions. Past performance is not indicative of future results.

Institutional trading strategy | Order Block | SIEMENS💡Insider Insights:
👉Siemens eyes $9.1B Altair Engineering acquisition for digital growth.
👉Expands AI partnership with Microsoft.
👉Launches Solid Edge 2025 for better design tools.
1️⃣An Order Block Area is a price zone with heavy buying or selling by institutions, Traders use these areas to identify potential price reversals or trend continuations.
✅Identifying an Order Block:
⭕️Consolidation Areas: Look for tight price ranges.
⭕️Sharp Breaks: Identify strong price moves following consolidation.
⭕️Tested Zones: Recognize areas acting as support or resistance.
2️⃣The accumulation phase with a small range is when a stock trades within a narrow price band while large investors buy shares. This indicates strong demand and often leads to a potential upward breakout.
💡Technical Analysis:
✅Inverted Head & Shoulder Chart Pattern
✅ Cup & Handle with order block confirmation
✅Prior accumulation phase
✅Rise in Volume
✅Trap Trading with Bo and fake out confirmation
💡Fundamental Analysis:
👉Revenue Growth: Steady growth, especially in Digital Industries and healthcare.
👉Earnings & Margins: High operating margins due to efficient digital solutions.
👉Dividend: Yield around 3-4%, attractive to investors.
👉Debt & Liquidity: Manageable debt levels with strong cash reserves.
✅Check out my TradingView profile to see how we analyze charts and execute trades.
🙋♀️🙋♂️If you have any questions about this stock, feel free to reach out to me.
📍📌Thank you for exploring our idea! We hope you found it valuable.
🙏FLLOW for more !
👍LIKE if useful !
✍️COMMENT Below your view !

MSFT 1W Bearish RSI divergenceTechnicals showing bearish divergence on the weekly time frame with double top formation. Also getting weekly below 20MA will be bearish. I expect if market continues to dip, it might test the 0.618 fibonacci level at 271.46. Currently I'm bearish on Microsoft.

Sonata Software Ltd- Trend and chart pattern analysisSonata Software Ltd-
technical + fundamental analysis based on chart and industry outlook 👇
Technical Chart Analysis (Weekly Chart)
Current Price: 356.40
Trend: The stock had a steep rally till 1,200 and then corrected sharply into a downtrend channel. Now it is stabilizing and attempting a base formation.
- Support Levels
334 - immediate support
286 - strong support zone
243 - medium-term support
228 - long-term crucial base
148 - major bottom support
- Resistance Levels
400 - near-term hurdle
503 - key weekly resistance (breakout confirmation if crossed)
600 - medium-term target if trend sustains
700+ - only after strong momentum breakout
- Chart Pattern
Stock is currently consolidating between 330-400.
Possible formation of a W-bottom / double bottom, if 330-334 holds.
A sustained move above 503 could trigger a trend reversal rally toward 600-700.
If it breaks below 286, weakness may extend to 243/228 zone.
🏢 Business & Competition
Sonata Software operates in IT services, cloud, and digital transformation. It earns revenues from export-oriented IT services, particularly in Microsoft ecosystem solutions.
- Key Competitors
Mid-cap IT peers: Mphasis, L&T Technology, Persistent Systems, Coforge, Birlasoft, Mindtree (merged into LTIMindtree).
Sonata is relatively smaller in scale compared to peers but has a niche in Microsoft Dynamics 365 solutions.
📈 Fundamental Ratios (Latest available FY24 data)
Market Cap: 9,500 Cr
P/E Ratio: 27 (mid-cap IT avg. 30-35) - slightly undervalued compared to peers
ROE (Return on Equity): 25% - very strong
ROCE (Return on Capital Employed): 30% - efficient capital use
Debt-to-Equity: 0.05 - virtually debt-free
Dividend Yield: 1.5% - decent payout for investors
Revenue Growth (3Y CAGR): 15-18%
EPS Growth (3Y CAGR): 20%
👍 Investment View
Technicals: Base building in progress. Sustaining above the 400-503 zone is crucial for the next uptrend.
Fundamentals: Strong ROE/ROCE, debt-free, consistent dividend payer. Attractive in mid-cap IT basket.
Risks: Global IT slowdown, client concentration risk, strong USD-INR dependency.
👉Disclaimer
This analysis is for educational & informational purposes only.
It is not financial advice or a buy/sell recommendation.
Stock markets are subject to risks - please consult your financial advisor before making any investment decisions.
#sonatasoftware #trendanalysis #chartpattern
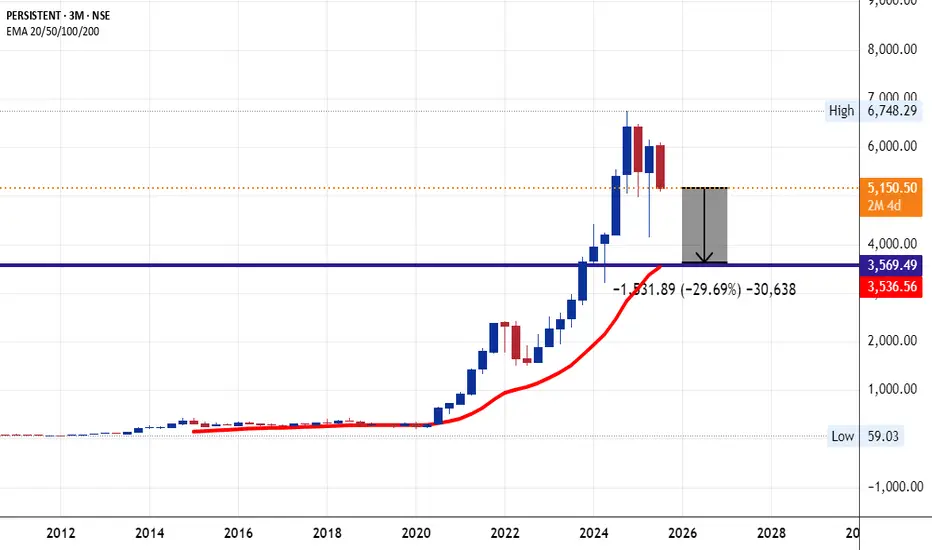
Persisitant Tech Bearish View Downside of More Then 25% Is DueHere is a detailed overview of the **Persistent Systems Ltd (Persistent Technologies) Business Model**:
---
## 🔷 **Persistent Systems Ltd – Business Model Overview**
### 🏢 **Company Overview**
* **Name:** Persistent Systems Ltd
* **Founded:** 1990
* **Headquarters:** Pune, Maharashtra, India
* **CEO & MD:** Dr. Anand Deshpande (Founder), current CEO: Sandeep Kalra
* **Industry:** IT Services & Software Engineering
* **Stock Listing:** NSE: PERSISTENT | BSE: 533179
---
## 🔑 **Core Business Segments**
### 1. **Digital Engineering (Product Engineering Services)**
* Builds software products and platforms for clients
* End-to-end product lifecycle services (design to support)
* Focused on ISVs (Independent Software Vendors) and tech-driven enterprises
* Strong reputation in **outsourced product development (OPD)**
### 2. **Digital Transformation & Enterprise Services**
* Modernizing enterprise applications and infrastructure
* Cloud migration, DevOps, agile development, and modernization
* Implements CRM, ERP, and data platforms
* Strong partnerships with **Salesforce, Microsoft Azure, AWS, IBM, Snowflake**
### 3. **Data & AI**
* AI/ML integration into business processes
* Big data analytics, data lakes, predictive analytics
* Decision intelligence platforms for financial, healthcare, and industrial clients
### 4. **Cloud & Infrastructure Services**
* Cloud engineering and managed cloud services
* Kubernetes, containers, hybrid and multi-cloud solutions
* Cloud security, migration, and optimization
---
## 💰 **Revenue Model**
* **Time & Material (T\&M)** based billing – per hour billing for resources
* **Fixed-Price Contracts** – milestone-based project delivery
* **Subscription-Based Models** – recurring revenue for managed services or platforms
* **Consulting & Licensing Fees** – for implementation and integration of third-party solutions (e.g., Salesforce)
---
## 🌍 **Geographic Revenue Mix**
* **North America:** \~80%
* **Europe:** \~10%
* **India & RoW:** \~10%
> North America is the largest market, especially the US tech sector.
---
## 👥 **Client Focus**
* Technology Companies (ISVs)
* Banking, Financial Services & Insurance (BFSI)
* Healthcare & Life Sciences
* Industrial & Manufacturing
* Hi-Tech and Telecom
---
## 🤝 **Strategic Partnerships**
* **Salesforce:** Leading partner for CRM solutions
* **Microsoft Azure & AWS:** For cloud infrastructure & DevOps
* **IBM:** AI, Watson, and hybrid cloud solutions
* **Snowflake, Google Cloud, Oracle, and ServiceNow**
---
## 📈 **Recent Financial Snapshot (FY24)**
*(Approximate values)*
* **Revenue:** ₹9,000+ Cr (\~\$1.1 Billion USD)
* **Net Profit:** ₹1,100+ Cr
* **EBITDA Margin:** \~17-19%
* **Employee Count:** 24,000+ globally
---
## 🚀 **Growth Strategy**
### 1. **Client Mining + New Logo Acquisition**
* Expand wallet share from existing enterprise clients
* Add new Fortune 1000 clients with digital needs
### 2. **Acquisitions**
* Acquired companies like CAPIOT, Data Glove, SCI (Software Corporation International), and MediaAgility to expand capabilities in cloud, AI, and BFSI domains
### 3. **Specialization in Vertical Solutions**
* Custom solutions for healthcare (patient engagement platforms)
* BFSI platforms (risk, payments, compliance systems)
* Smart industry tools for manufacturing & IoT
---
## 📊 SWOT Analysis
| Strengths | Weaknesses |
| --------------------------------------- | ----------------------------------------- |
| Strong niche in digital engineering | High client concentration in the US |
| Deep Salesforce, cloud, AI capabilities | Relatively smaller scale than TCS/Infosys |
| Good operating margins and ROE | Low brand visibility globally |
| Opportunities | Threats |
| ------------------------------------- | ----------------------------------- |
| Growing digital transformation demand | Talent attrition & wage inflation |
| AI-driven enterprise transformation | Rising global competition |
| Expansion in Europe & BFSI domain | Client budget cuts during slowdowns |
---
## 🧩 Summary Points:
* **Specialist in digital product engineering & transformation services**
* Focus on **niche verticals (BFSI, healthcare, ISVs)**
* **Fast-growing mid-cap IT player** with strong partnerships and M\&A activity
* Agile, innovation-led approach and focus on **cloud + AI + data** technologies
---
Thanks