Search in ideas for "ada"


Cardano going to the moonBy considering recent ADA chart I think it is going to the moon. It is the good time to invest in ADA

ELSAHari ini ELSA berhasil mantul dari area support fibonacci 0.65 264. Untuk Target resisten 1 ada di 278 dan target resisten 2 ada di 324. Stop loss jika break support < 264.
Disclaimet On!!!
Bukan ajakan membeli saham!!!

Top 10 Altcoins To Invest In 2021The term Altcoin stands for “alternative to Bitcoin'' or “alternative coins”, basically these are digital currencies similar to Bitcoin. Altcoins are profitable and have their own goal but these are not as costly as Bitcoin.
Due to the lower value and higher ROI, altcoins have become the favourite of investors. One thing that needs to be mentioned here is that not all altcoins are successful and have the same future scope. Thus before choosing a cryptocurrency to invest in, make sure to check all the details, reports and what people say about it.
If you are looking for a cryptocurrency to invest in, you are at the right place because we are here enlisting some of the most unique and profitable altcoins which hold a wide range of opportunities but not as costly as Bitcoin.
Ether (ETH)
Ether is a cryptocurrency built on top of the open-source Ethereum blockchain, which is known for running smart contracts. Ether is the second-biggest cryptocurrency in terms of market share. Currently, 1ETH is priced at 1,781. 22 United States Dollar and it is steadily growing.
With a market capitalization of $230.7 billion, ETH had hit a new record in Feb 2021. Cryptocurrency acts as a fuel that allows smart contracts to run, as opposed to bitcoins, which means a unit of currency on a peer-to-peer payment network.
Binance Coin (BNB)
It is the third biggest cryptocurrency on the basis of market share. BNB Coin is used to trade and pay fees on the Binance crypto exchange. Binance crypto exchange is the largest cryptocurrency world in the world.
The popularity of Binance is growing among developers, as of January 2018, it is facilitating more than 1.4 million transactions per second.
The overall Binance ecosystem makes it much easier to make transactions on their network. The current price of 1 BNB coin is 248.524621 US Dollar (USD) and it will be beneficial for the investors and BNB Coin Holders.
Cardano (ADA)
With a market cap of $46 billion, Cardano is in the third position after Bitcoin and Ethereum, it is one of the most improved altcoins and it is currently priced at $1.45.
Trading Beasts already predicted that the ADA price will reach $1.80 in the fourth quarter of 2011. One of the key factors behind Cardano's growth is the release of Hydra, a layer two scalability solution that promises to give the Cardano network the power to process more than 1 million transactions every second.
Ripple (XRP)
Ripple is not a cryptocurrency but a payment solution, It is not made of a blockchain, but a hash tree and its coins cannot be mined as there is a finite number of coins i.e. 100 billion. Its Coin XRP is mostly used by big companies to make huge transactions.
There are hundreds of financial institutions that choose Ripple to provide a better international payments experience to their customers in real-time. The current price of 1XPR is $0.454459 and it has a market cap of $45.44B.
PowerCoin (PKOIN)
Currently priced at 0.00405976ETH, Power Coin is probably the newest altcoin in the market but as an asset-backed hybrid stable coin it is trust-worthy and not only protects investors against volatility in the crypto marketplace but it also helps in mining and generating passive income.
It is backed by Power Corp and the company is developing a mining pool, Innovation Center, High-Performance Computing Data Center while acquiring assets such as renewable energy systems, financial instruments, real estate, intellectual property, digital and fiat currencies to back its hybrid stable coin PKoin.
PKoin is already listed on a few reputed crypto exchanges and soon the list will be longer. It is affordable and has a great scope. Thus don’t miss the opportunity and invest in it now.
LiteCoin (LTC)
Lite coin is really the lite and speedy version of Bitcoin. It was created by Charlie Lee and it holds many of the best features of Bitcoin and adds some of its own twists. LTC takes just 3 minutes to confirm a transaction for the same bitcoin takes around 10minutes.
Lower system requirement is also one factor that helps it to gain people interest as ordinary PCs are capable of mining it. LTC is powerful, easier, faster and currently, it is priced at 194.85 United States Dollar.
Tether (USDT)
With a market cap of $39 billion, Tether is in the 5th position of top cryptocurrencies. USDT is currently priced at $1 and It is a blockchain-based cryptocurrency, in which crypto coins are backed by the equivalent of traditional Fiat currencies including the dollar, euro or Japanese yen, which are held in a designated bank account. It is being traded under the USDT symbol.
Bitcoin Cash (BCH)
A major update regarding its processing speed is expected this year. Bitcoin Cash is one of the best alternatives of Bitcoin. It becomes popular because of its better transaction speed. It has larger blocks compared to Bitcoin which makes it able to handle more transactions at once, which means faster transactions.
It is the world's 11th biggest cryptocurrency by market cap at above $10 Billion. 1BCH is currently priced at 535.91 United States Dollar it is one of the most profitable cryptocurrency with lots of cool features.
Tron (TRX)
Founded in 2017 and based on Ethereum, Tron is here to decentralise the web by providing more power to content creators and publishers by monetising the way their content is shared and used.
Since its launch on Ethereum, it has moved to a self-governing blockchain platform and uses a proof of stake algorithm to process all the transactions. It is one of the best altcoins with a market cap of $3.8 billion and a price of around $0.05.
Chain Link (Link)
The Project is a decentralized network consisting of nodes that provide data to blockchain smart contracts through oracles from off-blockchain sources.
The process begins on a smart-contract-enabled blockchain whenever a smart contract needs data. With a market cap of $12 Billion, it is ranked at 10th position and it is priced at $30.14 currently
The above ten altcoins are unique, trustable and have great benefits. Other than these 10, there are thousands of altcoins available in the market but if you are looking for a beneficial and affordable cryptocurrency having good future scope then PowerCoin (PKoin) will be a great choice, as it has a lower price but its plan and assets-backed nature will help it to grow quickly.
Thus choose an altcoin from the above list and invest in it wisely. That’s it for today and have a great day.

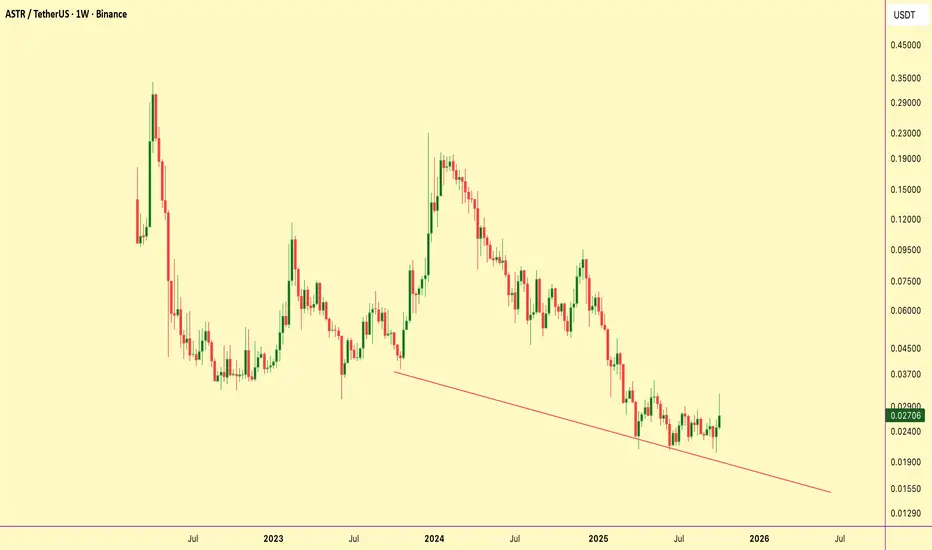
$ASTR gearing up for a breakout from key Order Block!RUS:ASTR showing strong bullish continuation signs on the 4H chart.
Entry Zone: 0.02567 (Bullish Order Block)
Stop Loss: 0.02406
Target: 0.03177 (Liquidity Pool Above)
Technical Breakdown:
🔹 Price broke out with clear bullish displacement after a period of consolidation.
🔹 Now retracing back into a key order block, offering a potential re-entry zone for continuation.
🔹 Liquidity resting above 0.03177 acts as a magnet for price — expect draw-on-liquidity play.
🔹 Market structure is still printing higher highs and higher lows, confirming bullish bias.
Bias: Bullish
Strategy: Order Block Re-entry (4H)
Plan: Wait for confirmation at OB zone before executing longs for continuation toward liquidity target.
Smart Money traders, keep this setup on radar. DYOR, NFA.
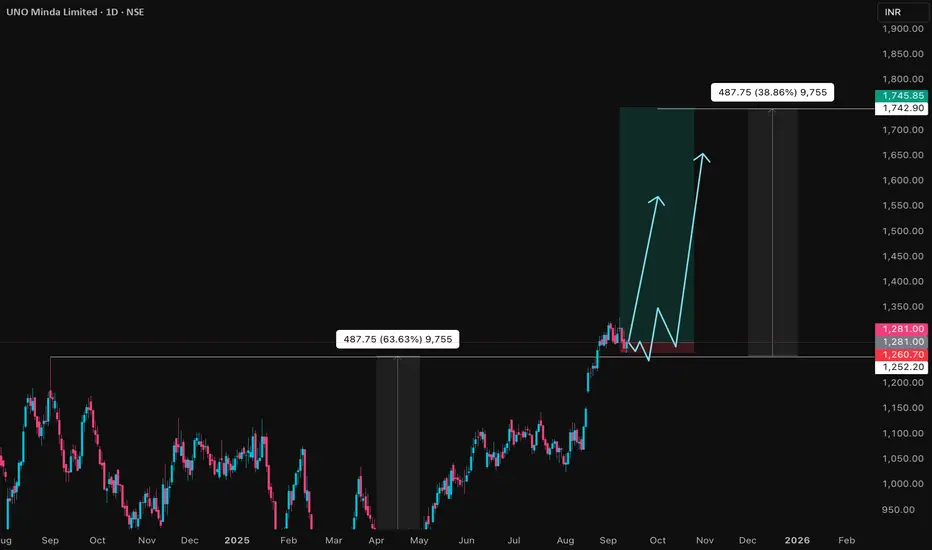
UNOMINDA Price ActionUNO Minda Ltd is trading at ₹1,282 as of September 12, 2025, delivering consistent financial and operational outperformance. For FY25, the company posted consolidated revenue of ₹16,775 crore, up 20% year-on-year, with net profit rising 9% to ₹936 crore. EBITDA grew 18% to ₹1,800 crore, and operating margins remain stable at 10.7%. Recent quarterly profit after tax is ₹289 crore, and EPS for the last twelve months stands at ₹13.97.
Expansion in premium switches, alloy wheels, lighting, sensors, sunroof products, and emerging EV technologies has bolstered top-line growth. Strategic projects—including new capacities for four-wheeler EV components and ADAS products—support a robust future pipeline, while strong cash flows enable ongoing fundraising and project commissioning.
Valuation remains at a premium to the sector, with trailing P/E around 79, price-to-book of 13, and price-to-sales ratio of 4.2, reflecting leadership in innovation and rapid growth. Return on capital employed is healthy at 15.7%, and debt remains modest, sustaining investor and institutional confidence. Technically, the stock is just below its 52-week high and continues to outperform broad market indices, maintaining an upward momentum trend.
Promoter and institutional holding are stable, affirming long-term commitment, and a final dividend of ₹1.50 per share was declared for FY25, rewarding shareholders alongside growth investments. UNO Minda’s medium- and long-term outlook remains highly constructive, anchored by strong financials, prudent capital allocation, innovative leadership, and a resilient growth trajectory.
renderwithme | ADA Technical Analysis Monthly Chart"Riding the Cardano wave! #ADAUSDT poised for a breakout—targeting $0.81 and beyond! #CryptoTrading"
~ Disclaimer ~~
This analysis is based on recent technical data and market sentiment from web sources. It is for informational \ educational purposes only and not financial advice. Trading involves high risks, and past performance does not guarantee future results. Always conduct your own research or consult a SEBI-registered advisor before trading.
# Boost and comment will be highly appreciated.
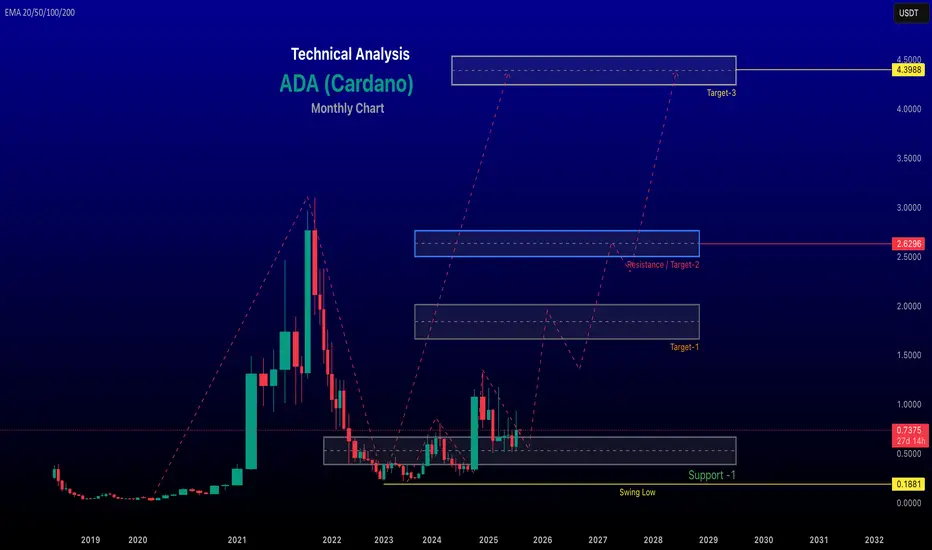
$ADA Bullish Pennant Formation
#ADA is consolidating inside a bullish pennant on the 1-hour chart after a strong rally from $0.56 → $0.77.
🔹The pole is formed by a steep breakout
🔸Price is now tightening within converging trendlines
🔹Classic sign of continuation if breakout occurs to the upside
Breakout Zone:
Watch for a breakout above $0.76–$0.77
If confirmed, next targets = $0.80, $0.83 and $0.88
Invalidation Level:
Breakdown below $0.70 negates the pennant structure
⏳ Tight structure — breakout likely soon

Maruti Suzuki India Ltd.Maruti Suzuki India Ltd. (MSIL) operates a robust business model centered on manufacturing, selling, and servicing passenger vehicles in India, with a focus on affordability, fuel efficiency, and a strong distribution network.
1. Core Business: Vehicle Manufacturing and Sales
Product Portfolio: MSIL produces 22 models across segments, including hatchbacks (e.g., Swift, Alto K10), sedans (e.g., Dzire), SUVs (e.g., Grand Vitara, Brezza), and MPVs (e.g., Ertiga). It offers petrol, CNG, hybrid, and electric (e.g., e-Vitara) powertrains to cater to diverse customer preferences.
Market Positioning: Focuses on affordable, fuel-efficient vehicles for the mass market, though it is expanding into premium SUVs and EVs to compete with rivals like Hyundai and Tata Motors.
Revenue Stream: Primary revenue comes from vehicle sales, contributing the bulk of its ₹152,913 crore revenue in FY25. Domestic sales dominate, with exports to over 100 countries (e.g., Latin America, Africa).
2. Production and Supply Chain
Manufacturing: Operates plants in Gurugram, Manesar, and Gujarat (via the merged Suzuki Motor Gujarat Pvt. Ltd.). These facilities produce over 2 million vehicles annually, with a focus on localization to reduce costs (up to 90% local components).
Economies of Scale: High production volumes and a lean supply chain enable competitive pricing. MSIL collaborates with Suzuki Motor Corporation (Japan) for technology and R&D, including hybrid and EV development.
Rare Earth Strategy: Despite global rare earth shortages impacting EV production (e.g., e-Vitara targets cut from 26,500 to 8,200 units for April–September 2025), MSIL claims no immediate operational disruptions.
3. Distribution and Sales Network
Extensive Reach: Operates over 3,000 sales outlets (e.g., Arena, Nexa) across 2,000+ cities, ensuring accessibility in urban and rural markets.
Nexa Premium Channel: Targets premium customers with models like Grand Vitara and Fronx, contributing to 20% of sales.
True Value: A pre-owned car business with over 600 outlets, enhancing brand loyalty and generating additional revenue through used-car sales.
4. After-Sales and Service
Service Network: Over 4,500 service touchpoints, servicing 24.5 lakh vehicles in May 2025 alone. Plans to expand to 8,000 touchpoints by FY31, including 1,500 EV-enabled workshops.
Revenue Stream: Spare parts, accessories, and service contracts provide recurring income, bolstered by high customer retention due to low maintenance costs and widespread availability.
5. Ancillary Services
Financing: Partnerships with banks like ESAF and Equitas Small Finance Bank offer retail financing for new, used, and commercial vehicles, targeting Tier II and III cities.
Insurance and Accessories: Maruti Suzuki Insurance and genuine accessories (e.g., alloy wheels, infotainment systems) add revenue streams.
Driving Schools: Maruti Driving Schools train customers, reinforcing brand engagement.
6. Innovation and Sustainability
R&D Focus: Invests in hybrid, CNG, and EV technologies to align with India’s sustainability goals and compete in the growing SUV and EV markets (e.g., e-Vitara, series hybrid for Fronx/Baleno).
Digital Integration: Suzuki Connect offers connected car features like remote diagnostics and geofencing, enhancing customer experience.
CNG Leadership: Commands a 73% share in India’s CNG vehicle market, capitalizing on demand for fuel-efficient alternatives.
7. Revenue Model Breakdown
Primary Revenue: Vehicle sales (domestic ~80%, exports ~10%).
Secondary Revenue: After-sales services, spare parts, accessories, insurance, and financing.
Profitability: FY25 net profit of ₹14,256.3 crore on ₹152,913 crore revenue, with a 9.3% profit margin, driven by cost efficiency and high sales volume despite a 4.3% profit dip in Q4 FY25.
8. Challenges and Adaptations
Market Share Decline: Dropped from 51% in 2020 to under 41% in 2025 due to competition in SUVs and EVs. MSIL counters with new launches (e.g., Escudo, e-Vitara) and hybrid technology.
Small Car Segment: Declining demand for entry-level cars (e.g., Alto) prompted MSIL to seek government support for revival.
Global Supply Risks: Rare earth shortages pose challenges for EV scaling, though MSIL mitigates through diversified sourcing and localized production.
Strategic Edge
MSIL’s business model leverages its dominant market presence, cost leadership, and extensive network to maintain profitability. By diversifying into SUVs, EVs, and hybrids while strengthening financing and service offerings, it aims to counter competitive pressures and sustain growth in a shifting automotive landscape.
Recent News and Developments (as of June 27, 2025):
New Vehicle Launches:
Maruti Suzuki Escudo: A new mid-size SUV, codenamed Y17, is set to launch around Diwali 2025. It will compete with the Hyundai Creta and Kia Seltos, offering petrol, hybrid, and CNG powertrains. The Escudo is expected to feature a larger touchscreen than the 9-inch unit in the Grand Vitara, along with safety features like six airbags, ABS with EBD, and potentially Advanced Driver Assistance Systems (ADAS).
e-Vitara Electric SUV: Maruti’s first electric vehicle, the e-Vitara, is slated for a September 2025 launch. It debuted at the 2025 Bharat Mobility Global Expo and is expected to offer a range of up to 500 km, competing with the Hyundai Creta Electric. However, production targets for April–September 2025 were cut by two-thirds (from 26,500 to 8,200 units) due to a global rare earth supply crisis, though MSIL claims no immediate impact on operations.
Grand Vitara S-CNG: Launched in June 2025, this model includes premium features like a 9-inch SmartPlay Pro+ infotainment system, wireless charging, ventilated seats, and Suzuki Connect.
New Compact MPV (YDB): Based on the Suzuki Spacia, this sub-4-meter MPV with a hybrid engine is expected to launch in 2026–27.
Series Hybrid Engine: MSIL is developing a new hybrid engine for mass-market models like the Fronx, Baleno, and Brezza, with the Fronx facelift expected in 2025.

Midhani: Breaks Out of Consolidation: Ready for Lift-Off ?NSE:MIDHANI Breaks Out of Consolidation: A Technical Powerhouse Ready for Lift-Off ?
Price Action Analysis:
- Current Price: ₹463.60 (as of June 23, 2025)
- Price Movement: +20.30 points (+4.58%) on the day
- The stock has demonstrated a spectacular breakout from a lengthy consolidation phase
- Sharp vertical surge from ₹340 levels to current highs of ₹463.60
- Strong momentum evident with substantial volume expansion
Volume Spread Analysis:
- Current Volume: 6.03M shares (significantly elevated)
- Average Volume: 2.36M shares
- Volume surge of approximately 155% above average indicates strong institutional participation
- Volume spike during breakout confirms genuine buying interest
- The previous consolidation period showed declining volume, typical of accumulation phases
Key Technical Levels:
Base Formation:
- Primary Base: ₹220-₹340 range (March 2025 to May 2025)
- Base Duration: Approximately 3 months
- Base Type: Cup and Handle pattern with rectangular consolidation
- Base Depth: From ₹463 high to ₹220 low (52.5% correction)
- Quality: High-quality base with proper volume characteristics
Support Levels:
- Immediate Support: ₹420-₹440 (previous resistance turned support)
- Secondary Support: ₹380-₹400 (50% retracement of recent move)
- Major Support: ₹340-₹360 (breakout point and upper base boundary)
- Ultimate Support: ₹280-₹300 (middle of base formation)
Resistance Levels:
- Immediate Resistance: ₹480-₹500 (psychological round numbers)
- Next Resistance: ₹520-₹540 (measured move from base)
- Major Resistance: ₹580-₹600 (long-term projection target)
Technical Patterns Identified:
Primary Pattern:
- Cup and Handle Formation: Completed with successful breakout
- Handle Formation: Tight consolidation between ₹320-₹340 levels
- Breakout Volume: Exceptional with 155% above average volume
Secondary Patterns:
- Ascending Triangle: Formed during the handle phase
- Flag Pattern: Brief consolidation after initial breakout surge
- Higher Lows: Consistent pattern throughout base formation
Trend Analysis:
- Primary Trend: Strongly Bullish (breakout confirmed)
- Intermediate Trend: Bullish momentum accelerating
- Short-term Trend: Overbought but maintaining strength
Trade Setup and Strategy:
Entry Levels:
- Aggressive Entry: ₹445-₹460 (current levels on minor pullbacks)
- Conservative Entry: ₹420-₹440 (on deeper retracement to support)
- Breakout Entry: ₹350-₹360 (for those who missed the initial move)
Exit Levels:
- Target 1: ₹500 (near-term psychological resistance)
- Target 2: ₹540 (measured move from base)
- Target 3: ₹600 (extended target based on base width)
Stop-Loss Strategy:
- Tight Stop: ₹420 (for aggressive entries)
- Standard Stop: ₹380 (below key support zone)
- Conservative Stop: ₹340 (below breakout point)
Position Sizing and Risk Management:
Position Sizing Guidelines:
- Conservative Allocation: 2-3% of portfolio
- Moderate Allocation: 3-5% of portfolio
- Aggressive Allocation: 5-7% of portfolio (for high-risk tolerance)
Risk Management Framework:
- Maximum Risk per Trade: 2% of total capital
- Risk-Reward Ratio: Minimum 1:3 for all entries
- Scaling Strategy: Add positions on pullbacks to support levels
- Profit Booking: Book 30% at Target 1, 40% at Target 2, 30% at Target 3
Portfolio Considerations:
- Sector Allocation: Limit defence/aerospace exposure to 10-15% of portfolio
- Correlation Risk: Monitor other defence stocks for overexposure
- Market Timing: Consider broader market conditions before position sizing
Sectoral and Fundamental Backdrop:
Defence and Aerospace Sector Overview:
- India's defence budget targeting ₹1.75 lakh crore turnover by 2025
- The government focus on Atmanirbharta (self-reliance) in defence manufacturing
- The global aerospace and defence market is showing a strong growth trajectory
- Space economy growing at 7.4% year-over-year globally
Company Fundamentals:
- Market Cap: ₹8,693 crore
- Revenue: ₹1,074 crore (FY2025)
- Net Profit: ₹110 crore with 21.28% growth in Q4 FY2025
- Promoter Holding: 74% (strong management confidence)
- Specialisation: High-grade alloys, aerospace materials, defence components
Recent Developments:
- Strong presence at Aero India 2025 with indigenous aerospace materials
- Launch of High-Temperature Nickel Alloy Billets and Superni 41 Plates
- Strategic partnerships with HAL, GTRE, ADA, and the Indian Air Force
- Focus on critical materials for defence and aerospace applications
Industry Catalysts:
- Increasing defence procurement by the Indian government
- Export opportunities in aerospace components
- Technological advancement in the space and defence sectors
- The government push for indigenous manufacturing capabilities
Risk Factors and Considerations:
Technical Risks:
- Overbought conditions in the near term may lead to consolidation
- High volatility expected due to recent breakout
- Potential for profit booking at psychological resistance levels
Fundamental Risks:
- Dependence on government orders and policy changes
- Competition from private sector players
- Raw material cost fluctuations
- Execution risks in scaling up production
Market Risks:
- Broader market correction could impact momentum
- Sector rotation away from defence stocks
- Geopolitical factors affecting defence spending
- Interest rate environment impacting valuations
My Take:
NSE:MIDHANI presents a compelling technical setup with a successful breakout from a well-formed base pattern. The combination of strong volume confirmation, favourable sector dynamics, and improving fundamentals creates an attractive investment opportunity. However, investors should be mindful of the recent sharp move and consider appropriate position sizing and risk management strategies.
The stock appears well-positioned to benefit from India's growing defence and aerospace sector, supported by government initiatives and increasing focus on indigenous manufacturing capabilities. Technical indicators suggest further upside potential, making it suitable for both momentum and growth-oriented investment strategies.
Keep in the Watchlist.
NO RECO. For Buy/Sell.
📌Thank you for exploring my idea! I hope you found it valuable.
🙏FOLLOW for more
👍BOOST if you found it useful.
✍️COMMENT below with your views.
Meanwhile, check out my other stock ideas on the right side until this trade is activated. I would love your feedback.
Disclaimer: "I am not a SEBI REGISTERED RESEARCH ANALYST AND INVESTMENT ADVISER."
This analysis is intended solely for informational and educational purposes and should not be interpreted as financial advice. It is advisable to consult a qualified financial advisor or conduct thorough research before making investment decisions.

KPIT TECH Date 30.01.2025
KPIT TECH
Timeframe : Day Chart
FY25 MARGIN GUIDANCE INCREASED TO 21%
Key Consolidated Financial Metrics
🔹 Revenue from Operations: ₹1,478 crore
➤ (YoY: ₹1,257 crore, +17.6%)
🔹 Net Profit (PAT): ₹187 crore
➤ (YoY: ₹155.3 crore, +20.4%)
🔹 EBIT: ₹254 crore
➤ (YoY: ₹209 crore, +22%)
🔹 EBIT Margin: 17.2%
➤ (YoY: 16.6%, improvement of +60 bps)
Analysis Notes
🔹 Revenue Growth:
➤ Strong 17.6% YoY growth driven by demand in automotive software solutions, particularly in electric & autonomous mobility.
🔹 Profitability Expansion:
➤ PAT growth of 20.4% YoY highlights improved operational efficiencies and increasing order execution.
🔹 EBITDA & Margins:
➤ EBIT grew 22% YoY, with EBIT margin improving to 17.2% (+60 bps YoY), reflecting better cost control and higher-value projects.
🔹 Beats Estimates:
➤ The company outperformed market expectations, delivering higher-than-estimated revenue and profitability.
Operational Highlights
1.Growth in Automotive Engineering:
➤ Increasing engagements with OEMs & Tier-1 suppliers in EV, ADAS, and Software-Defined Vehicles (SDVs).
2.Strong Order Pipeline:
➤ Healthy deal wins in the mobility ecosystem and sustained growth momentum across geographies.
3.Efficiency Gains:
➤ Higher-margin projects and cost optimization led to improved EBIT margins.
Challenges
•Macroeconomic Uncertainty: Potential slowdowns in automotive spending could impact future growth.
•Talent & R&D Costs: Continued investments in talent and innovation may exert pressure on margins.
Investor Takeaways
•Solid Revenue & Profit Growth: KPIT is capitalizing on the rapid shift toward automotive digitalization.
•Margin Expansion: Cost efficiencies and premium projects contributed to EBIT margin growth.
•Outlook Positive: Strong pipeline of next-gen mobility solutions positions KPIT for continued growth.
KPIT Technologies delivered a stellar Q3 FY2025 performance, exceeding expectations with robust revenue growth, higher profitability, and margin expansion, reinforcing its leadership in automotive engineering solutions.
Regards,
Ankur

ChainGPT Holding Strong at $0.140: Can ChainGPT Go Up 1300%?ChainGPT Holding Strong at $0.140: Can ChainGPT Go Up 1300%?
🔹 Current Price: $0.140, sitting at a strong support zone.
🔹 Accumulation Zone: $0.140 - $0.115 (Green box).
🔹 Expectations: Big potential gains for $CGPT!
🔹 Long-Term Target: $1.40 (HTF Parallel Channel Resistance), which is ~1300% from the accumulation zone.
Targets:
1️⃣ $0.180
2️⃣ $0.270
3️⃣ $0.47
4️⃣ $0.80
5️⃣ $1
6️⃣ $1.50 🚀
Stop Loss: If the price drops below the green box, it may turn bearish.

FIL/USDT 5000% Potential ?FIL/USDT Analysis Update
LSE:FIL currently around $4.27, and it’s holding steady at strong support – could see a big move in the days ahead!
Entry Zone: $4 - $3
Targets: $10 / $25 / $48 / $70
Exciting times for #FIL
Let’s watch how this unfolds.

XPR View!! 9Hr!!XRP lost 5.7% of its valuation this week, but at least in this case, the price has been making higher lows, which makes sentiment slightly more optimistic than Ethereum.
The problem with this cryptocurrency is that it has been in a flat trend for years now. Somehow, sellers always stopped buyers’ attempts to take the price towards $1. Faced with this, XRP bounced between the key levels and never left them.
Looking ahead, XRP has good support at around 50 cents, but the resistance at 68 cents has stopped any ambitious buyers since late 2023. Hopefully, 2024 will offer a clear breakout before the end of the year.Cardano (ADA)

Binance Coin (BNB) Binance Coin (BNB) is less of a loser than ADA, falling by 2.57%.Image by TradingView
From the technical point of view, the price of BNB is in the middle of the narrow channel, gaining energy for a further move.
As none of the sides is dominating at the moment, ongoing sideways trading in the area of $510-$530 is the more likely scenario.
BNB is trading at $517 at press time.

Breakout in ADATarget : 0.5216
Breaking up of sloping trendline.
Volume is still average. But should achieve the target.

Take a chance in correction phase | Long BiasOn week chart
After ADA has broken out the resistance zone at $0.46 and now it's pulling back to support zone around 0.45 - 0.43
Wait for confirmation around this level to join

History repeat #ADAyeh we got same pattern in same day let see hopefully we can achive our TP in this trade
liq sweep done
MSS done
OTE waiting for entry TF=15MIN
then #LFG #ict

VARROC ENGINEERING - TREND IS CHANGINGFUNDAMENTALS
Varroc belongs to auto ancilliary sector.
One of the strongest OEM player to ride this bull run on auto sectors.
Ready for EV and had rolled out a lot of stuff for 2 wheelers already. Engine Valves, Lighting, Forging, ADAS ; you just name it and they make that.
The company is not only catering to Indian markets but have manufacturing setup outside india as well for global business..
One of the key points to note is that Varroc has very low public float around 8%.
75% with promoters, 5% with FIIs, and 12% with DIIs (MFs mainly)
While things went bit haywire post 2019 and company's growth went sideways to negative, it looks like they are back on track.
The current market cap is just under 8500 Crores (At cmp 555) while the Enterprise Value is value is already above 9600 Crores.
PE ratio is on a higher side amongst the peers but that would get adjusted with the expected rise in sales and underlying profits.
Cash flows of the company has also significantly improved.
Company has been taking initiative to lower down it's debt and its net debt to EBITDA had improved significantly (WALK the TALK).
While some business has seen some dip in European markets, the overall order book is very healthy and the results of all the initiatives shall reflect in the financials in next couple of years.
TECHNICAL
On technical charts it has broken out of 2019-2020 levels which it attempted to touch base in 2022 and recently in Sep/Oct 2023 as well. This attempt on 17 Nov 2023 has successfully cleared the resistance on weekly charts with rising volumes. Another interesting thing is that there was high volume rejection in May 2022 when it peaked around 493 in the month of April 2022; the current price and volume trend has even taken off those rejection levels with ease.
740 is a very very initial trading target (weak below 430) while I look this scrip as a portfolio buy for minimum 2-3 years time frame with targets of 1100 ++ (Weak below 400)
PS: From cmp of 555 this could be a doubler or multibagger in making. CLose watch on QoQ performance for next 6 quarters shall reveal a lot about the company.

Trading Signal For CardanoTrading Setup:
There is a Trading Signal to Sell in ADAUSDT Cardano
Traders can open their Sell Trades NOW
⬇️ Sell now or sell on 0.3536
⭕️SL @ 0.3592
🔵TP1 @ 0.3367
🔵TP2 @ 0.3238
🔵TP3 @ 0.3066
What are these signals based on?
Classical Technical Analysis
Price Action Candlesticks Fibonacci
RSI, Moving Average , Ichimoku , Bollinger Bands
Risk Warning
Trading Forex, CFDs, Crypto, Futures, and Stocks involve a risk of loss. Please consider carefully if such trading is appropriate for you. Past performance is not indicative of future results.
If you liked our ideas, please support us with your likes 👍 and comments .

CARDONA(Ada) bullish view when breckoutCardona Fibonacci level shows it's important levels...If crack resistance, i would like to be long(buy).
(Education purpose only)

ADAUSDT Trade IdeaADAUSDT Short Trade
Entry : $0.3875-$0.3820
ADAUSDT Heavy Resistance AT $0.3912. And 2nd Local Resistance At $0.3877.,
So You Can Short ADA And Make 30%-60% Profit With 10X.
Thanks, Follow For More Valuable Content.
