Search in ideas for "ada"


ADA Dominance Test All-time Low With Double Bottom Pattern
Cardano ( ADA ) Hits All-time low With Double bottom formation. Interestingly, with this plummet in ADA dominance, the volume shows massive strength for the increase in dominance in the future. Also, RSI represents strong growth for ADA and all these indicators it can be forecasted that the price of ADA will move upside strongly in all the pairs either its USD or BTC .

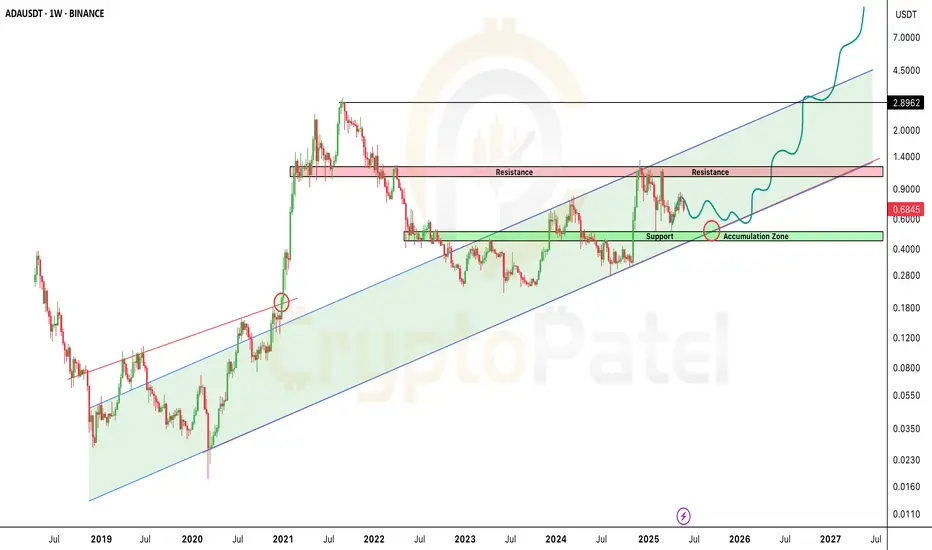
ADA Sitting on Strong Support — Next Big Move Loading?🚨 ADA Sitting on Strong Support — Next Big Move Loading?
Cardano has dropped to around $0.68, but guess what? It's sitting on a major support zone in a long-term bullish channel!
🟩 Accumulation Zone: $0.60–$0.40
This is where smart money enters… historically a STRONG buy zone!
🟥 Next Resistance: $1–$1.20
Break that — and ADA could fly toward $5–$10+ in the coming bull run!
The chart is screaming MEGA RUN ahead — if you're bullish on ADA long-term, this might be your signal.
Not financial advice, but the setup looks Strong.
ADA/USDT 1500% Potental as per Fractal AnalysisCRYPTOCAP:ADA Super bullish 1500% Potential Analysis
1⃣ Congrats #ADA up 70% from our Initial Entry
2⃣ Long Term I am Expecting $5-$10
3⃣ Best Entry: $0.4-$0.5 (Less chances but Placed bid)
4⃣ As per Fractal #Cardano is $15 Potential
5⃣ Big Red Box = Accumulation Zone
6⃣ Strong Support = $0.40 Level
NFA & DYOR

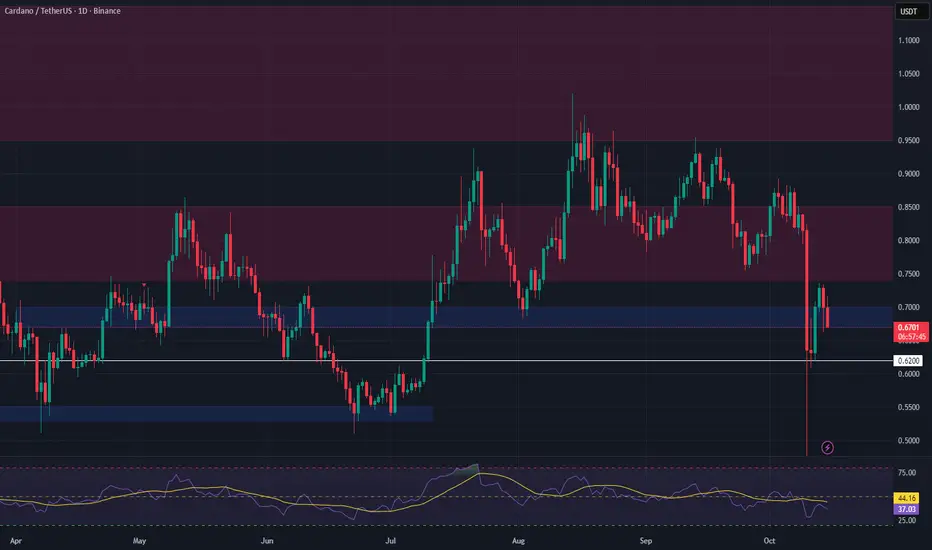
ADA Approaching Major Support – Spot Long Setup in ProgressCardano (ADA) is trending down toward a critical support zone at $0.67–$0.70, which could offer a low-risk entry for a laddered spot long position. The broader crypto market remains cautious, and near-term direction is still unclear—so position sizing and disciplined execution are essential.
🎯 Plan of Action:
Entry Zone: $0.67–$0.70 support, with staggered buys to improve cost basis.
Confirmation Required: Wait for signs of stabilization (e.g., bounce, volume support) before adding further.
Avoid chasing rallies if they lack volume follow-through.
📊 Targets & Risk Management:
Take Profits in Tiers:
First zone: $0.74–$0.85
Second zone: $0.95–$1.15
Stop Loss: Just below $0.62, invalidation of the support structure.
Keep allocation modest—ADA is still in a volatile downtrend.
💡 Reminder: This is a technical setup, not a prediction. Let the chart lead the decision, and stay adaptive to market conditions.
ADA/USDT 1500% Potential in Next bull MArketCRYPTOCAP:ADA Super Bullish 1500% Potential Analysis:
#CARDANO Entered in Bull Zone as per Fractals.
I'm Expecting $4-$5 Potential in Next Bull Run.
Best Accumulation zone: $0.30-$0.40
Targets: $1.2/$2.95/$5.8
Please Like/Comments if you agree

Cardano (ADA) Price Prediction - ADA Ready To Push $1.6ADA is following the uptrend and soon it will reach 1.6$

ADA exit plan for long holdersIn this there is some idea for exit of ADA for long holders as it is at its all time high. I have also given the points for short in ADA but you can buy any point bellow 1.5$ and will have minimum of 8% profit in Short term (Period of 2-4 days.). $ADA

Ada back on trackAfter a 2 month's hold ada is back on track to make a higher high
Ada looks very bullish after breaking of it's all time high next targets are 1.93 and 2.1$

ADA is preparing for Long term rally, ready to grab it?Hello Friends,
Lot of low volume alts are popping up, kind of selective bull run. We yet to major movements are big volume coins. Few signs are seen, sharing with you.
ADABTC after 01-Jan-2018 high, 15 months price was in downtrend. May,2018 was the period the price was above 200MA.
(200MA is seen as major indicator for bull and bear). After May, 2018, now we are trading above 200MA.
If you notice the chart, the price movement is between 800 SATs to 1100 SATs for last 6 months which is very good consolidation. Can this hold? As long as Sellers are not interested to sell it below the 800 SATs, seems they are not interested.
Last bull run for ADA BTC started at 650 SATs, check my previous call (1 year old one)
So if you compare 650 SATS, price touched 830 SATS from the high of 9000 SATs which is down by close to 90%. Wow !!! Yes, you are right. Price has bounced back 1100+ SATs levels after the 829 SATs low and trading above all moving major moving averages.
Now moving averages will act as support. The support is between 1100-1150 SATs (circled one).
One can buy there with sl (your sl based on risk appetite, 820 SATs can be good one)
Entry :1125 SATs, SL : 820 SATs, Target open. Book profits when you are comfortable
resistance zone at 1300 SATs, break and close above can attract more buyers to the coin.
----------------------------------------------------------------------------------------------------------------------------------------------------------------------------------
#ADABTC #BTC #adabtc #btc

ADA-the retest has completed.As you can see from the chart, ADA bounced back right at 200MA creating W parten. I can tell that this is the bottom range ⇗±10% .Go long now with 3x leverage is a wise action.
SL: no need
TP1: $1.2
TP2: $2.5
TP3: $3.8

ADA is about to take us on a wild ride! 🎢 💎 Paradisers, #ADA has formed a 'W' pattern at the demand level, and we're currently watching for a breakout from the descending channel.
💎If #ADAUSDT shows a Break of Structure (BOS) from this juncture, We can anticipate a bullish movement. It's advisable to use smaller position sizes here and to seek strong indicators supporting a bullish trend.
💎Should there be a breakdown of this zone, Then we can expect a bounce from the strong support zone, which could offer high-probability setups—exercise caution here.
💎However, if the price doesn't display any bullish signs for confirmation and breaks down below both levels, it would be prudent to wait for more favorable price action to develop and consider the overall crypto market before making any decisions.

ADA : Bullish Breakout Signals Strength and Potential Upside💎 ADA has broken out of the descending channel and has displayed signs of strength, including CHoCH (Change of Character), BOS (Break Of Structure), and the formation of a W pattern around the 200 EMA. These factors collectively increase the likelihood of a bullish movement.
💎The current zone, previously a resistance area, is now acting as support, as evidenced by historical price action on a larger timeframe.
💎A pullback to the bullish OB levels, coinciding with the Fibonacci golden 0.618 level, is anticipated. This level presents an attractive opportunity for a bounce.
💎However, in the event of ADAUSDT breaking below the demand levels, it would be wise to refrain from seeking bearish opportunities, considering the overall bullish sentiment in the market. Capturing small bearish targets may not be worthwhile in such a scenario.

ADA/USDT: Pattern Convergence Sparks Bearish Warning!💎 Hey ParadiseSquad, let's zoom into ADA/USDT on the weekly chart. We're seeing a unique blend of an inverse cup and handle pattern coupled with an M pattern. This combination is hinting at a bearish outlook.
💎 For this bearish scenario to unfold, we need a confirmed breakdown below the critical demand level of 0.2337. If that happens, we could aim for the next demand zones at 0.1783, 0.1451, and 0.1115. Remember, we're looking for a solid close and retest of this level before considering any bearish moves.
💎 On the flip side, if the price ascends past 0.3770, this pattern would be nullified, signaling a potential bullish reversal.
💎 Keep your eyes peeled and trade smart, ParadiseSquad!


Bullish on #ADA as per technical and its one of Undervalued too ADA as per charts its has strong support around $1.1 and $1, but as whales are bullish and collecting the crypto plus its is consider to be most undervalued too.

Buy #ADA for TG1 $1.3 ADA charts seems bullish, as investor are accumulating at lowest price, aslo strong support is seen around $1 and Resistance $1.3


ADA Long IDEA: Bidding around $1.5Bidding for ada long around $1.52-$1.4. (Daily demand ZONE)
Aiming for a good 20% move.

LONG ADAADA will give a breakout as soon as possible.
Keep accumulating below 2.05 best entry level for a swing target of 3$
levels mentioned in chart !!

