$SEI ACCUMULATION PATTERN FORMING🚨 NYSE:SEI ACCUMULATION PATTERN FORMING 🚨
If you missed the first run (+140%), here's your second chance.
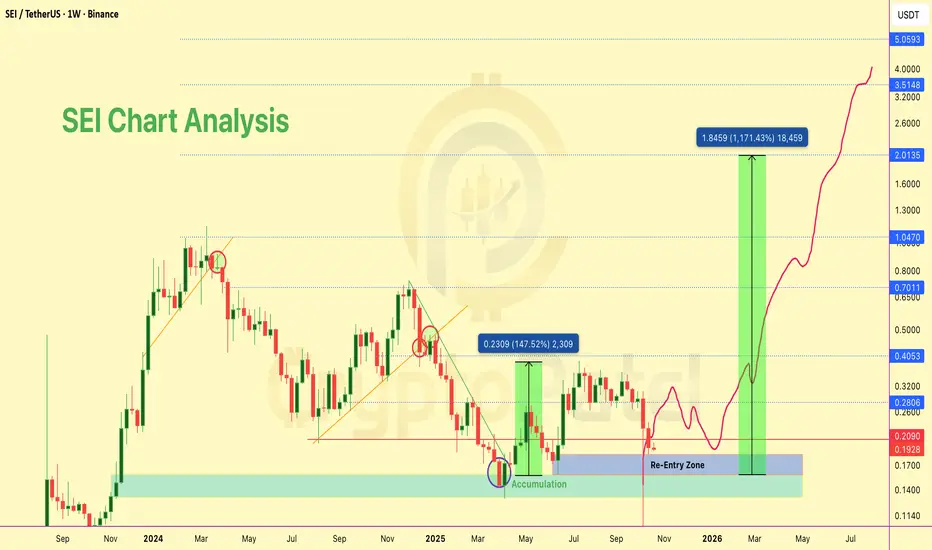
We're back at re-entry levels after accumulation cycle.
RE-ACCUMULATION ZONE: $0.20 - $0.16
TARGETS: 5x-20x (realistic on strong fundamentals)
This isn't hype. Strong backing + proven accumulation pattern + solid technicals = institutional confidence.
History repeats. Are you taking it?
NFA & DYOR
SEIUSDT
Will $SEI hit $2 in current bull market?NYSE:SEI up 140% from my initial entry, but I'm targeting an 800% gain from current levels 🚀
Looking at $2 as a key target in this bull run — strong support, bullish structure, and key levels lined up.
Let’s see if NYSE:SEI can make this move 💎
NFa & DYOR

$SEI to $2? Trump-backed + Institutional Buys = Next Altcoin NYSE:SEI to $2? Trump-backed + Institutional Buys = Next Altcoin Rocket!
#SEI already pumped +100% from our entry! Hope you enjoyed the ride.
But I’m still massively bullish on this setup.
▶️ Price is consolidating near strong support at $0.20–$0.14
▶️ This is a golden accumulation zone for the next leg up!
▶️ Backed by Trump’s Liberty Financial & multiple institutional buys
▶️ My targets for this bull run: $1 → $2 → $3 → $4
Still early. Still bullish. Still time.
Note: Not Financial Advice so Do your Own Research before investing.
#Altcoins

SEI TO MAKE 2X IN COMING DAYSThe CRYPTOCAP:ETH chart shows prices hovering around a key support zone of 1,750 - 1,830 within a descending channel. The red Ichimoku Cloud above acts as a strong resistance barrier, indicating potential challenges in breaking upwards.
If support holds, aim for a bounce towards the cloud resistance near 2,400. A successful breakout from the cloud could target 2,800 and beyond. However, if support fails, watch for a dip to 1,600 levels.

Is SEIUSDT Poised for a Breakout or a Trap?Yello Paradisers! Is SEIUSDT about to make a major move, or are we looking at a potential trap? 📉
💎We’ve spotted a descending channel on SEIUSDT, typically a bullish pattern—but let’s not get ahead of ourselves. To confirm this setup and stack the odds in our favor, we need to see a breakout and a candle close above the resistance zone. Without this, it's all just speculation.
💎If the price pulls back, we might witness a potential bounce and the formation of a double bottom pattern—another bullish indicator. However, be cautious. This scenario is risky, especially for beginners, and it’s best to stay on the sidelines unless you’re an experienced trader.
💎On the flip side, if SEIUSDT breaks down and closes below the demand zone, it will invalidate this entire idea.
Remember, discipline and patience are your best allies in trading. Don’t jump the gun—wait for confirmation before making your move. Stay sharp and focused, Paradisers!
MyCryptoParadise
iFeel the success🌴

SEI/USDT Bullish Long Term Target $10 ?SET:SEI Chart Analysis ( Long Term $10 Potential )
#SEI has broken out of a Bull Flag in HTF and is looking bullish!
🔹 Daily Demand Zone: $0.250
🔹 Short-term Target: $1
🔹 Long-term Targets: $5-$10
Watch for the next big move!

SEI/USDT Ready to $2 in Near Term Target ?NYSE:SEI looking bullish based on HTF chart analysis
Perfect retest zone at $0.40, which makes for a good entry. I’m expecting $2 in the near future. If it drops, $0.30 will be a great accumulation zone.
Near-term targets: $0.57 / $0.96 / $1.50 / $2 / $5

SEI SHORT SET-UP SEI has been getting rejection again and again from upper trendline, market being bearish makes it again for short setup. Entry price, Stoploss & Target are given in chart.

SEI/USDT: Bullish Shark Pattern Signals Potential RallySEI/USDT has formed a bullish shark pattern and is showing a bullish divergence bounce, indicating strength.
There is now a chance to retest the $0.30 level, after which a rally is expected.
The targets are $0.58 and $1.16.
#SEI #USDT #CryptoTrading #BullishSharkPattern #BullishDivergence #CryptoAnalysis #TradingTargets #CryptoRally #TechnicalAnalysis

SEI is setting the stage for a potential bear trap! 🐻🚫💎 Paradisers, #SEI might trap bears who entered during the recent breakdown.
💎If #SEIUSDT breaks out from the recent cup and handle pattern, we can anticipate a bullish move. This scenario would likely trigger bear stop losses, potentially driving a bullish trend.
💎However, if the price breaks down below the minor support level, it would be considered a continuation of the short-term bearish trend, and we might expect further bearish movements. For now, though, I am not interested in focusing on bearish moves, so it would be prudent to stay alert but not actively engage in bearish trades.

ANALYSIS VIEW ON SEI / USDT PAIR Pair: SEI/USDT
Exchange: Binance
Trade Type: Buy Long (FUTURE)
Trade Parameters:
Entry Level: 0.2095
Target 1: 0.2160
Target 2: 0.2222
Stop Loss: 0.1970
Analysis:
The SEI/USDT pair, listed on the Binance exchange, presents a promising trading opportunity. The Relative Strength Index (RSI) indicates a bullish movement in the market, suggesting potential upward price momentum. Additionally, a bullish sentiment is observed in the short-term moving average, reinforcing the positive outlook.
Trade Rationale:
The decision to enter a long (future) position at the specified entry level of 0.2095 is supported by the bullish signals from both RSI and the short-term moving average. Target levels at 0.2160 and 0.2222. To manage potential risks, a stop-loss order is set at 0.1970.
DISCLAIMER : EDUCATIONAL PURPOSE ONLY
