NIFTY Rejection Zone at 25515–25535 – Sell on Rise SetupNifty is showing clear bearish intent, and price action suggests that 25515–25535 is emerging as a strong supply zone. This area has previously attracted selling pressure, and we expect sellers to defend it aggressively again.
As long as NIFTY trades below this resistance band, momentum favors the downside.
📌 Trade Plan:
Strategy: Sell on Rise
Resistance Zone: 25515 – 25535
Targets:
🎯 25450
🎯 25410
🎯 Extended target below 25400
Bias: Bearish below 25535
If price fails to sustain above the resistance zone, sellers could push the index back toward 25400 levels and potentially lower.
⚠️ Watch for rejection candles / lower high formation near resistance for better confirmation.
📌 Disclaimer
This analysis is strictly for educational purposes and not financial advice. Please consult your financial advisor and follow your own trading plan before taking any trades.
If you find this idea useful, hit the like button and share your views—your feedback helps us create better trading insights for the community.
🚀 Trade smart. Trade disciplined.
Happy Trading,
– The InvestPro Team
Sellonrise

NIFTY Sell on Rise | Options Trade with Defined RiskNIFTY continues to respect the upper trendline resistance, indicating a bearish bias in the near term. Price action suggests a sell-on-rise opportunity as long as the index trades below this resistance zone.
📉 Index View (Spot):
Resistance Zone: 25,750
Downside Targets: 25,650 – 25,600
Rejection from this zone could trigger another leg lower toward the mentioned targets.
📌 Trade Setup (Options Strategy)
Instrument: NIFTY 25,800 CE (20th Jan Expiry)
Buy Zone: ₹125 – ₹115
Target: ₹190
Invalidation / Risk: ₹95 (closing basis)
💡 Trade Logic:
As long as ₹125 holds, momentum remains favorable for an upside move in the option premium. A pullback into the buy zone may offer a low-risk, high-reward setup, aligned with volatility expansion near resistance.
⚠️ Risk Management is Key
Use strict stop-loss discipline
Adjust position size according to your risk appetite
Avoid overtrading in volatile conditions
📌 Disclaimer
This analysis is strictly for educational purposes and not financial advice. Please consult your financial advisor and follow your own trading plan before taking any trades.
If you find this idea useful, hit the like button and share your views—your feedback helps us create better trading insights for the community.
🚀 Trade smart. Trade disciplined.
Happy Trading,
– The InvestPro Team

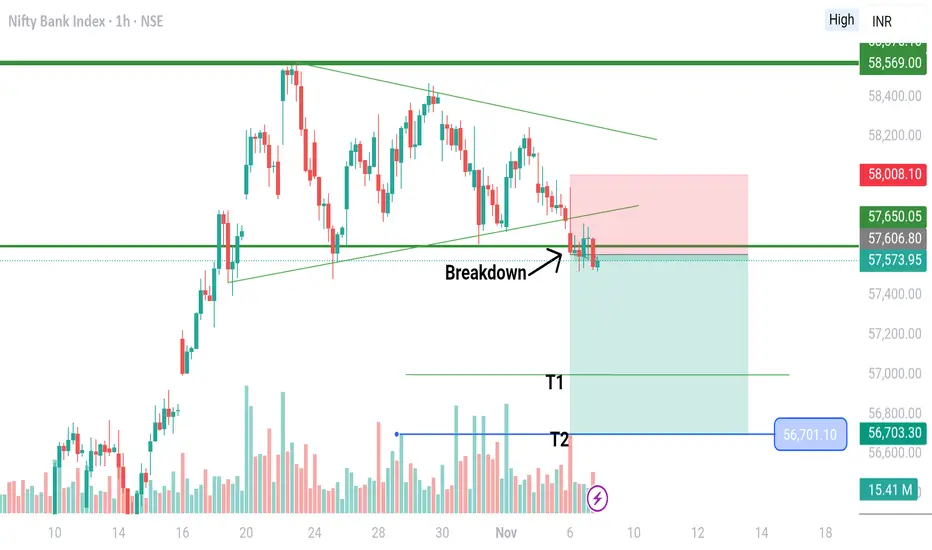
Breakdown of Triangle Pattern in BankniftyBanknifty has given breakdown out of the Triangle Pattern in 1 HR time frame.
Also, the Market seems to continue the sell on rise strategy.
Any retracement towards upside should be utilised in more selling.
SL should be put on sustaining basis rather than price just touch SL and come down rapidly (If happens).
Entry and Target are mentioned in the chart.
Also, Nifty and Sensex have already made classic M pattern supporting banknifty to go down. Same has already been discussed in my YouTube Video published on my channel "SMARTSTOCKINSIGHT" on 4th November.
Feel free to discuss any doubt in comment section.
Note: This analysis is for Educational Purpose Only. Please invest after consulting a professional financial advisor.
Nifty 50 -Feb 2025 ViewI had posted my last analysis of Nifty at end of Dec 2024 and here we are in Feb 2025 with Nifty being almost at the same price.
So, basically everyone should be happy, right? :P
Why are most of our portfolios in deep red? Let;'s understand the scenario.
Nifty has been highly volatile since the past few months with FII selling continuously and DIIs buying it.
It has been a tug of war between bulls & bears near 23000 which was broken few days back but 22800 managed to act as a support. Level to watch remain same as last idea
View is bearish to sideways with sell on rise.
Expecting a highly volatile 2025 with stock specific movements especially in large cap sector.
Overvalued mid & Smallcap stocks might continue to see correction in upcoming months.
I feel a bullish view can be made only when Nifty sustains above 24800. An accumulation in this zone between 23000 and 24800 will be good for Nifty in upcoming years.
The recent budget will be very beneficial for consumption & hospitality sector. Keep this sector in watchlist.

FINNIFTY FALL is on the way. chart has given clear breakdown of the bearish flag pattern in fin nifty.
Quarter numbers of major comps are weak, Inflation is rerouting and now CASA will again go down, sips at peak and retailers will buy this dip.
NBFC and BANKS will suffer more now.
TREND CHANGED IN NMDC - FROM BUYING ON DIPS TO SELL ON RISE ?NMDC is engaged in exploration and production of Iron Ore along with Diamond, production and sale of Sponge Iron and generation and sale of Wind Power.
This PSU stock has given great returns to investors as well as traders in last one year.
Although there exists so many positive talks about NMDC's volume growth, sales growth & capacity enhancement etc. which are fundamentally good but I think trend is changed in NMDC.
This stock was buy on dips since May-June 2023 but right now as per technical chart & price action, I think trend is changed from buy on dips to sell on rise.
I will find opportunity to sell it on each rise until it breaks 235-240 level.
So, Is it still buy on dips or has become sell on rise?
Only time will tell!
P.S. : This stock is on my main watchlist for a short trade.

BANKNIFTY AnalysisBANKNIFTY is ready to face major resistance near 41000-41300 zones , a possible downmove can be expected

BANKNIFTY possible Elliott wave counts (now up then down)Hello Friends,
Hope you are doing well,
Today we are sharing banknifty possible Elliott wave counts along with invalidation levels and along with alternate wave counts, which can be overall road map for next moves expected further, in both current and alternate counts banknifty is looking good short candidate but only after some rally it means it looks like sell on rise along with strict stoploss of invalidation levels only, so it may go up side first then good move towards south is expected.
Our studies are only for educational purposes and not for trading purposes so we are not responsible for any kind of profits or losses in trading or in investing in market, so always please consult your financial advisor before trading or investing, do read disclaimer.
Thanks
Most investors treat trading as a hobby because they have a full-time job doing something else.
However, If you treat trading like a business, it will pay you like a business. If you treat like a hobby, hobbies don't pay, they cost you...!
Disclaimer.
I am not sebi registered analyst.
My studies are for educational purpose only.
Please Consult your financial advisor before trading or investing.
I am not responsible for any kinds of your profits and your losses.

Nifty Spot Weekly Outlook for Jun20 -Jun 24thFalcon Analytics Outlook Nifty 50 for the Expiry week ( Jun 20 – June 24 )
Last Weekly Nifty witness selling pressure below 16057 , while the pivot for the week @ 16327 was not breached on upside.
Technically for this week on the daily charts we see minor support on the downside for Nifty50 index lies at 15185 levels,
whereas minor resistance on the upside is capped around 15722 levels.
If Nifty50 index breaches minor support on the downside and closes below it, we may see fresh break down and index can drag towards major supports on lower side around 15019/14751 and and if breaches minor resistance on the upside and closes above it, we may see fresh breakout and index can head towards higher levels around 15888/16157 .
Currently Nifty50 index is trading Below Red Line 200 day EMA @ 16673 suggests long term trend is Bearish .
Range for the week is seen from 14751 on downside and 15888 on upside.
Weekly Chart Suggest closing below 15100 Downward Momentum can be fast.
Below Mentioned Spot Levels can be used to trade Long Or Short during the week ahead.
( All Spot Levels)
RESISTANCE 4: 16425
RESISTANCE 3: 16157
RESISTANCE 2: 15888
RESISTANCE 1: 15722
WEEKLY PIVOT LEVELS: 15454
SUPPORT 1: 15185
SUPPORT 2: 15019
SUPPORT 3: 14751
SUPPORT 4: 14482
All above views for education purpose only.
Regards,
MD .

Sell on rise stock
T- 102/96/87
SL : 121
Timeframe : 30-45 days
Reason : Global oil is trading above 110 while domestic price has been kept relatively low. Retailer is on negative side while producer RIL is on positive side of the story.

Bank Nifty - Harmonic PatternBank nifty had broken all the previous supports today and is expected to continue its down trend. As bank nifty is overly sold, a pull back rally can be expected before it continues its down trend. Currently, Bank Nifty is sell on rise mode and one can expect a reversal from the marked harmonic level.


#Nifty Trade Setup For Monday (7th June)So for tomorrow there is a simple Strategy.
.
If Nifty cross 15680, we will buy 15700 CE for 40 points.
.
If Nifty goes below 15620, then you should go for PE.
.
If Nifty give gap down below 15620, then you should go for call option once it goes above 15620.
.
If Nifty give Gapup Opening then buy on dip strategy will apply.
.
Keep learning keep earning

#Nifty Trade Setup For Tuesday (27th April)If Nifty Cross 14560 Buy CE of 14700.
.
If Nifty goes down below 14360, go For PE.
.
If Nifty gives Gap up opening then you can buy on dip till till the 14360.
.
If Nifty gives gap down Opening then you can sell on rise till 14560.
.
You can give your feedback in comment box.
.
Learn More Earn More ✌️

Nifty Trade for 19th April (Monday)As you see in the chart, Market is recovering on daily basis and give closing above the previous low.
.
So for Monday simple Strategy. If Market goes down below 14450, we will buy PE.
.
If Market goes up above 14700, we will buy CE.
.
If Market give gap up opening, we sell after correction.
.
If Market give gap down, we buy after correction.
.
You can give your suggestions in comment box.
.
Learn More Earn More ✌️

Nifty Downtrend Starts. More Downside Coming!!Nifty Crashed more than 600 points today before settling at 13328. More Downside will come till 12600-12800 if it breaks the upper trendline. Be cautious! Book your Profits. Any Upside will be Sell on Rise on Nifty as well as Bank Nifty.


HDFC Bank : Shorting On RallyHDFC Bank posted good results. The Primary trend being down, I'm looking at the shorting opportunity when price rally upon a good result.
Entry: 950-960 ( Resistance - Wait for price to take a resistance - use 30 minutes or hourly to for conformation)
Stop-loss: 990 ( Previous Swing High)
Target: 1:5 ( 800 )
Don't Jump The Gun at 9:15. Our patience will achieve more than our force.
Hdfcbank daily trend will turn up when closed above 990.
(Bear Market Low 738 - Swing High 988 - HL 810 - HH ?? )
(738 - 988 - 810 - 988++ ??)
-------------------------------------------------------------------------------------------------------------------------------------------------------
Entry: 950-960 ( Resistance - Wait for price to take a resistance - use 30 minutes or hourly to for conformation)
How to confirm whether it's respecting resistance or not?
There no magic formula. Just wait for a red candle, bar around 950-960 on 30 minutes or hourly.
One red candle doesn't confirm resistance. But it's a technique to enter a trade at our predefined resistance level.
Keep things simple enough while trading.

BankNifty 25Jul2019 Expiry ViewBankNifty seen major sell off in last day of the previous week wiping out 660 points in intraday. On daily scale it has formed double top kind of pattern and has given breakout below its neckline of 30223. Theoretically it can test 28525 which is height of "M" and 100% retracement of the pre-election rally. Due to the heavy correction it might see a pullback relief rally. But that should be used as an opportunity to create fresh shorts for an eventual target of 29250/28500j #SellOnRise
