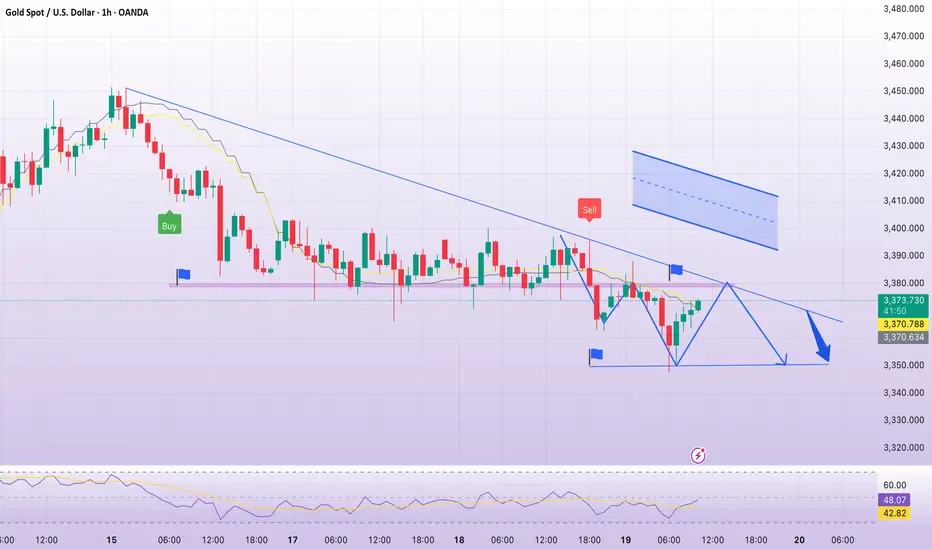
XAUUSD | 15-Minute Intraday Analysis | Sell on Rise(Intraday)XAUUSD | 15-Minute Intraday Analysis | Sell on Rise(Intraday)
Symbol: XAUUSD
Timeframe: 15 Minutes
Bias: Bearish (Intraday)
🧠 Trade Logic
In a bearish trend, pullbacks are for selling, not buying.
Wait for rejection confirmation near resistance.
🔍 Technical Breakdown
The market is respecting a strong descending trendline
EMA cluster acting as a dynamic resistance
Price is currently testing EMA + trendline + volume resistance
VoLume Profile shows heavy supply around 4830–4860
RSI recovered from oversold but stuck near 50–55, no trend reversal confirmation
🔴 Sell Scenario (High Probability)
📍 Sell Zone: 4830 – 4860
📉 Targets:
TP1: 4800
TP2: 4765
TP3: 4720
🛑 Invalidation:
Strong 15M candle close above 4880
🟢 Buy Scenario (Only if Condition Met)
⚠️ Counter-trend setup
Buy only if 15M closes above 4880
EMA Structure must flip bullish
Targets: 4910 → 4950
📌📌📌 Notes📌📌📌
Best suited for intraday traders
Avoid emotional entries inside the range
Trade with confirmation, not prediction
📊 Indicators Used
EMA (Multi)
RSI
Volume Profile
Trendline Structure
Sellsignal

XAUUSD – Historic Volatility Doji at 1.618 | Exhaustion SignalXAUUSD – HTF Exhaustion at 1.618 | Major Volatility Signal Formed
GOLD HAS PRINTED ITS BIGGEST DOJI IN ENTIRE HISTORY OF DAY CANDLE NEARLY 490$ FROM LOW TO HIGH AND ENDED WITH INDECISION. LETS SEE WHAT HAPPENS NEXT . WAIT FOR LOW AND HIGH OF DOJI.......?
Gold has reacted precisely from the 1.618 Fibonacci extension zone (~5600), where price printed a high at 5597.04 and faced strong rejection.
The current Daily candle is forming an exceptionally large indecision candle (Doji-like structure) after a strong impulsive move.
With an intraday range of nearly 490$, this candle highlights clear exhaustion and aggressive profit-taking at premium prices.
Technical Perspective
Clear rejection from the 1.618 extension resistance
Strong volatility spike following a vertical price expansion
Daily candle structure suggests weakening bullish momentum
Key HTF Levels to Watch
Resistance / Supply: 5580 – 5615
Immediate Reaction Zone: 5350 – 5400
Major Support / Rebalancing Area: 5000 – 4900
HTF Value Area Low: Below 4900 (only if bearish momentum accelerates)
Expectation (Next Sessions / 1–2 Weeks)
As long as price remains below the 1.618 rejection zone, probability favors:
Consolidation or corrective price action
Gradual rotation toward 5000–4900 HTF demand
No immediate V-shaped recovery unless strong acceptance above 5600 is seen

GBPJPY sell active setup GBPJPY as expected running check my previous idea 💡 I link to this, TP 🎯 missed still struggling possible TP let's see 📈📉

USDCHF sellCHF futures hit supply zones dollar 💵 is also seems weak so highly posible setup let's see how it goes like 📉📈

SELL SILVER - everyone says this, but i say only when i'm sureMarkets that run too far from their statistical/structural mean tend to revert back — especially after parabolic rallies. Classic studies show prices can overshoot by large factors before pulling back toward long-term averages.
arXiv
Silver in 2025 experienced extraordinary gains (~150–170%+), which is well beyond typical historical norms relative to commodities or industrial metals.
Trading Economics
When a rally of that magnitude climaxes, mean-reversion theory suggests:
Prices overshoot the “fair value band”
Sellers (especially momentum traders) begin taking profits
Volatility spikes increase backwardation/short squeezes
This is exactly what has been happening recently — sharp pullbacks, volatility, and aggressive liquidation.


Consolidation breakdown in eicher motors1. Consolidation range breakdown at top
below 6720 stock will test its Fibonacci support levels
2. stock has given big rally upwards
3. stock may test its fib support levels and the continue upward movement
4. one can watch for swing downside movement with strict targets and sl

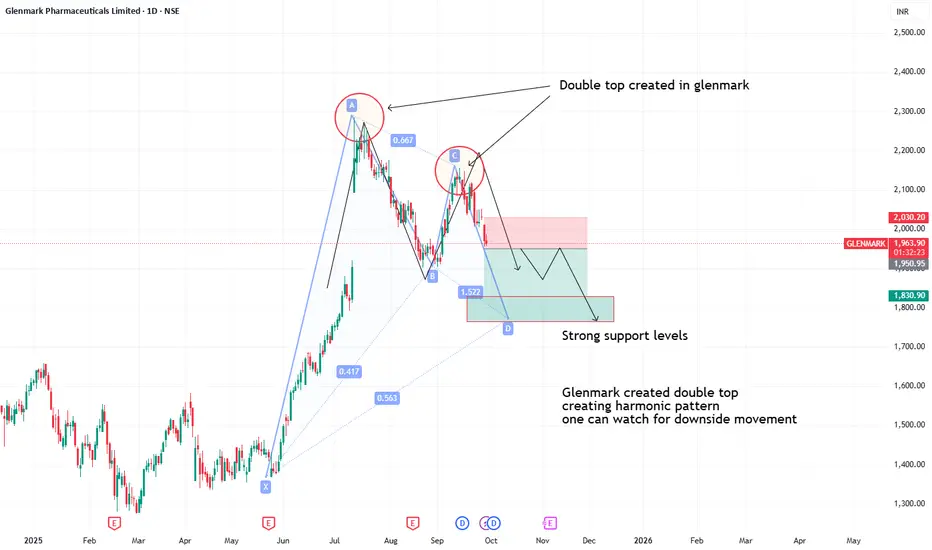
Double top formation seen in glenmark- Glenmark created double top
- creating harmonic pattern
- one can watch for downside movement
- stock may give big move downside if nifty continues to fall
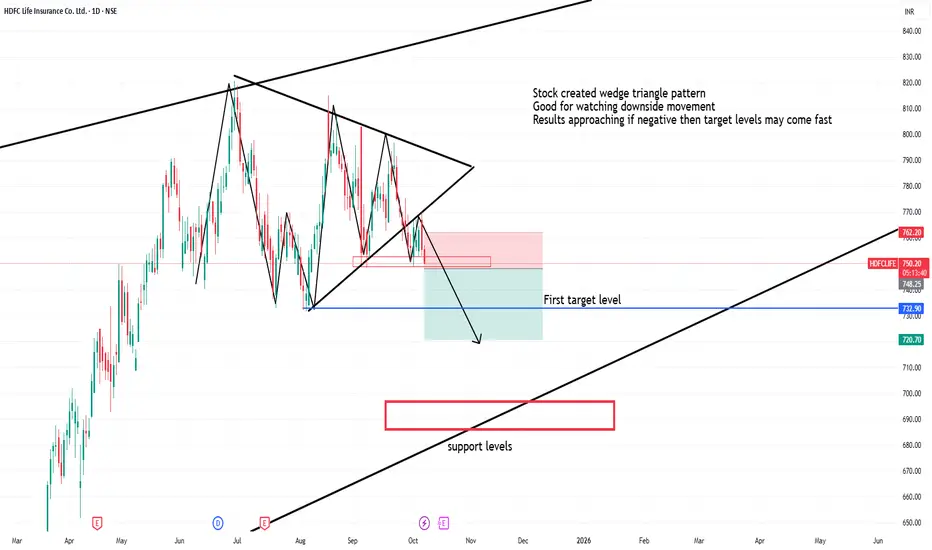
Hdfclife created bearish wedge triangle patternStock created wedge triangle pattern
Good for watching downside movement
Results approaching if negative then target levels may come fast
Bajaj finserv respecting resistance levelsbajfinserv has been returning from its resistance levels showing selling pressure
While nifty shows strentgh
bajfinserv show selling pressure
one can watch for downside movement

LiamTrading – Gold Plan: Wide Range + US Politics Exert PressureLiamTrading – Gold Plan: Wide Range + US Politics Exert Pressure
Gold continues to fluctuate within a wide range as market sentiment is heavily influenced by news from the United States. On 3rd October, the US Senate is expected to re-vote on the temporary budget bill. If it fails, the federal government could shut down, extending into the next week. This will undoubtedly have a significant impact on safe-haven flows, making gold more sensitive to key technical resistance zones.
📊 Technical Analysis – Chart H1
Gold is moving within a wide sideways structure, oscillating around strong resistance – support zones.
Fibonacci Resistance + Psychological level around 3878–3881 → suitable for short-term Sell scalping.
Confluence support (Retest + Volume) around 3828–3830 → ideal zone to watch for Buy, expecting a recovery wave.
The larger trend still leans towards an increase, however, in the short term, the market will experience several liquidity sweeps.
🎯 Trading Scenario
Sell (short-term – prioritise on M15):
Entry: 3878–3881
SL: 3886
TP: 3860 – 3855 – 3840 – 3822 – 3810
Buy (retest support + volume):
Entry: 3828–3830
SL: 3822
TP: 3845 – 3860 – 3877 – 3890
📌 Conclusion
Today's range is quite wide, suitable for scalping according to psychological resistance zones.
Short-term Sell at Fibonacci resistance points.
Buy when price retests confluence support with volume.
Political news from the US will be a catalyst causing significant gold volatility, so it's crucial to maintain disciplined capital management.
👉 Keep a close watch on the scenarios, I will update regularly as the market experiences new movements.

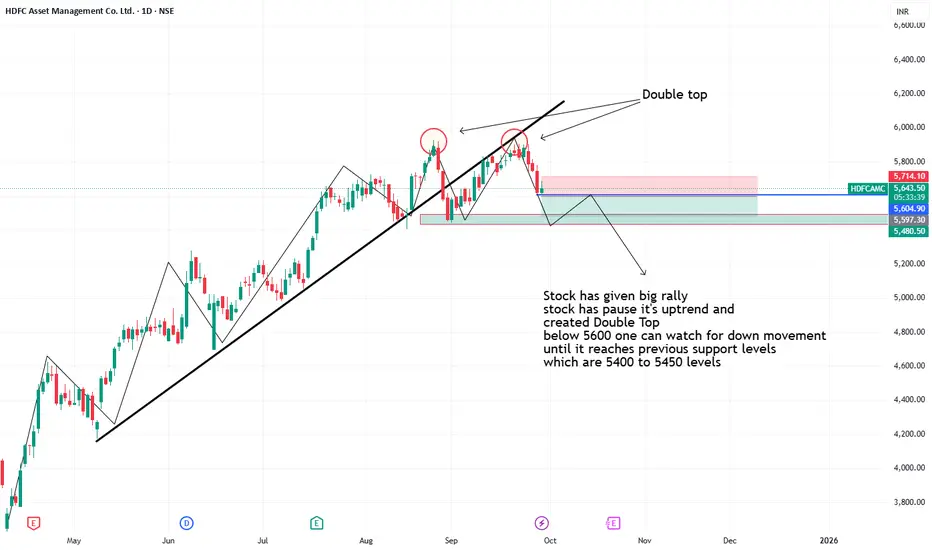
Hdfc created Double Top Formation- Stock has given big rally
- stock has pause it's uptrend and
created Double Top
- below 5600 one can watch for down movement
until it reaches previous support levels
which are 5400 to 5450 levels
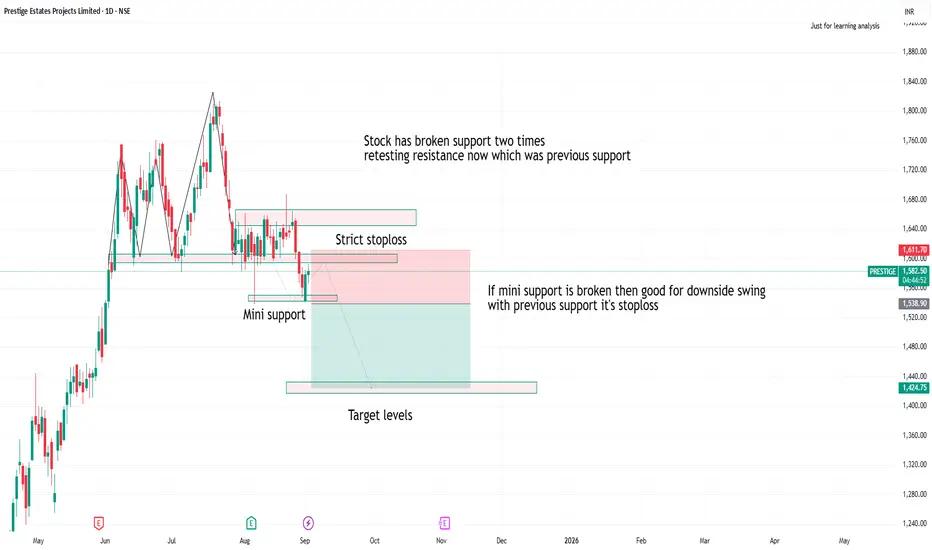
Prestige testing resitanceprestige has broken support second time
if breaks mini support levels good for downside with strict stoploss and targets
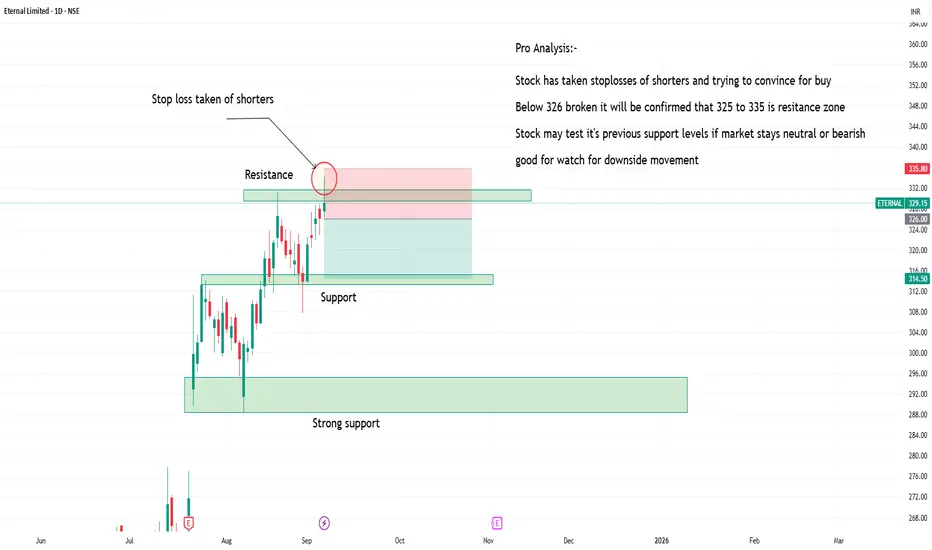
Zomato creating it's resistance zoneZomato is testing it's resistance zone.
one can watch for downside movement with stop losses above recent swing with targets of 215 levels.
it's pure price action.
stock may go in consolidate in zone for long time.
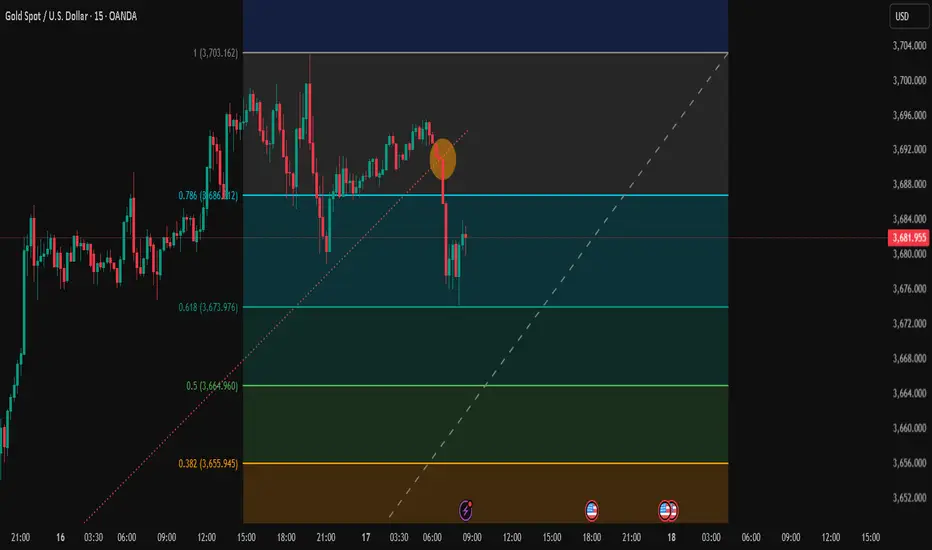
Trading Analysis for Gold Spot / U.S. Dollar (15-Minute Chart)Sell XAU/USD now at 3688.00 level and take a stop loss of 3703.00 and the targets will be as follows.
Entry range 3691.00 to 3687.00
Take Profit 1 = 3673.00
Take Profit 2 = 3665.00
Take Profit 3 = 3655.00
Take Profit 4 = 3645.00
Stock Loss 3703.00
Based on the provided 15-minute chart for Gold Spot / U.S. Dollar (XAU/USD), published by NaviPips on TradingView.com on June 30, 2025, at 17:53 UTC, here’s a suggested trading setup for a buy position:
Current Price and Trend: The current price is 3,241.875, with a slight increase of +0.250 (+0.01%). The chart shows a recent downtrend that appears to be stabilizing near the current level, suggesting a potential reversal point.
Buy Entry: Enter a buy position at 3,312.875 (current price), as it aligns with a support zone where the price has found a base, indicated by the horizontal dashed line and recent consolidation.
Stop Loss: Place a stop loss at 3,295.250, below the recent low, to protect against further downside. This level is approximately 10.625 points below the entry, defining the risk.
Take Profit Levels:
Take Profit 1: 3,317.875, a conservative target about 20.000 points above the entry, aligning with a minor resistance zone.
Take Profit 2: 3,324.750, a mid-range target approximately 31.875 points above the entry.
Take Profit 3: 3,332.500, a deeper target about 45.625 points above the entry, indicating a potential trend reversal.
Price Action: The chart indicates a downtrend with a possible bottoming pattern near the current level. The support zone and upward candlestick suggest a buy opportunity if the price holds.
Risk-Reward Ratio: The distance to the stop loss (10.625 points) compared to the take profit levels (20.000 to 45.625 points) offers a favorable risk-reward ratio, ranging from approximately 1:1.9 to 1:4.3.
Conclusion
Enter a buy at 3,241.875, with a stop loss at 3,295.250 and take profit levels at 3,317.875, 3,324.750, and 3,332.500. Monitor the price action for confirmation of an upward move, and be cautious of a potential continued downtrend if the price breaks below the stop loss level. (Note: I assume "take profot" was a typo for "take profit" and have corrected it accordingly.)
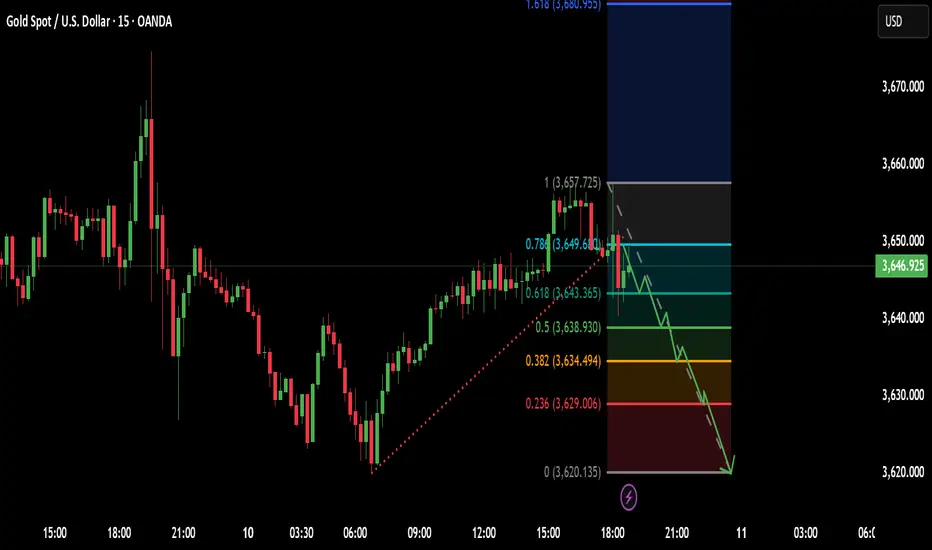
Trading Analysis for Gold Spot / U.S. Dollar (15-Minute Chart)Entery = 3649.00
Stock Loss = 3657.00
Take profit 1 = 3643.00
Take profit 2 = 3639.00
Take profit 3 = 3634.00
Take profit 4 = 3628.00
Based on the provided 15-minute chart for Gold Spot / U.S. Dollar (XAU/USD), published by NaviPips on TradingView.com on June 30, 2025, at 17:53 UTC, here’s a suggested trading setup for a buy position:
Current Price and Trend: The current price is 3,241.875, with a slight increase of +0.250 (+0.01%). The chart shows a recent downtrend that appears to be stabilizing near the current level, suggesting a potential reversal point.
Buy Entry: Enter a buy position at 3,312.875 (current price), as it aligns with a support zone where the price has found a base, indicated by the horizontal dashed line and recent consolidation.
Stop Loss: Place a stop loss at 3,295.250, below the recent low, to protect against further downside. This level is approximately 10.625 points below the entry, defining the risk.
Take Profit Levels:
Take Profit 1: 3,317.875, a conservative target about 20.000 points above the entry, aligning with a minor resistance zone.
Take Profit 2: 3,324.750, a mid-range target approximately 31.875 points above the entry.
Take Profit 3: 3,332.500, a deeper target about 45.625 points above the entry, indicating a potential trend reversal.
Price Action: The chart indicates a downtrend with a possible bottoming pattern near the current level. The support zone and upward candlestick suggest a buy opportunity if the price holds.
Risk-Reward Ratio: The distance to the stop loss (10.625 points) compared to the take profit levels (20.000 to 45.625 points) offers a favorable risk-reward ratio, ranging from approximately 1:1.9 to 1:4.3.
Conclusion
Enter a buy at 3,241.875, with a stop loss at 3,295.250 and take profit levels at 3,317.875, 3,324.750, and 3,332.500. Monitor the price action for confirmation of an upward move, and be cautious of a potential continued downtrend if the price breaks below the stop loss level. (Note: I assume "take profot" was a typo for "take profit" and have corrected it accordingly.)
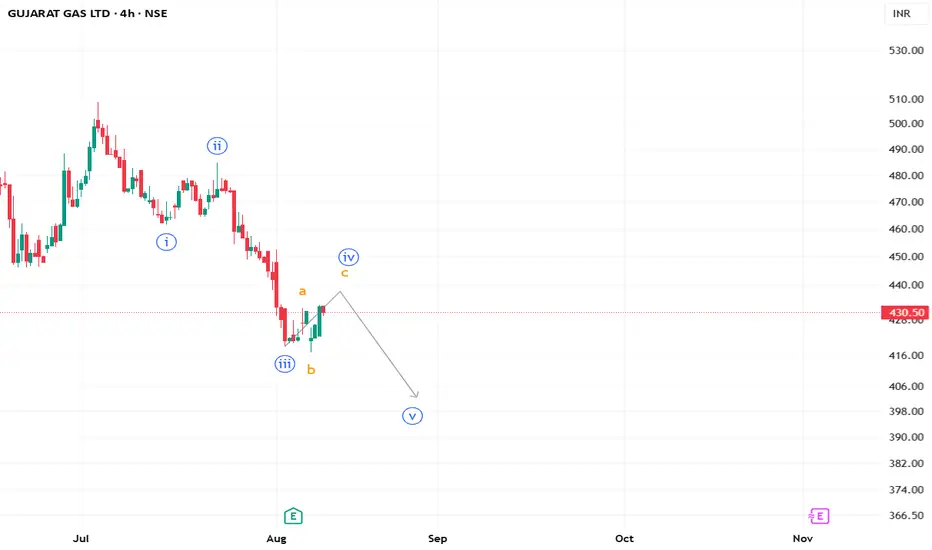
#Gujgasltd Elliott Wave Count Signals Potential Final Leg LowerBased on the 4-hour Elliott Wave analysis, Gujarat Gas appears to be in the final stages of a corrective Wave iv within a larger downtrend. The current price action suggests completion of an A-B-C structure for Wave iv, with the “c” wave nearing its top. If the count holds, the stock may soon resume its decline into Wave v, targeting lower lows before a potential trend reversal. Traders should watch for signs of weakness near current resistance to confirm the bearish continuation.
Gold price drops with FOMC today: 3342Plan XAU day: 30 July 2025
Related Information:!!!
Gold prices (XAU/USD) remain confined within a narrow range around the $3,325 level during the Asian session on Wednesday, struggling to extend the previous day's modest gains. Persistent market caution ahead of a pivotal central bank event lends some support to the safe-haven precious metal. In addition, a slight retreat in the US Dollar (USD) from a more than one-month high reached on Tuesday could provide an added boost to gold prices.
That said, upside potential appears limited, as investors exhibit restraint and await further clarity on the Federal Reserve's (Fed) monetary policy trajectory before making directional commitments. Meanwhile, the prevailing consensus that the Fed will maintain higher interest rates for an extended period is likely to prevent a significant USD pullback. Coupled with renewed trade optimism, these factors may continue to cap any meaningful gains in the XAU/USD pair
personal opinion:!!!
Gold price accumulated and compressed since the beginning of the week. Waiting for today's interest rate announcement. Decreased back to 3300.
Important price zone to consider : !!!
resistance zone point: 3342 zone
Sustainable trading to beat the market
MRF - BEARISH SETUP (DAILY TIMEFRAME) DOUBLE TOPA double top pattern is a bearish reversal pattern that can be observed on a stock's price chart after an uptrend. It signals that the upward trend may be losing momentum and that a downtrend could be imminent.
Please sell if your setup agrees too - I will sell if 1,45,000 Levels is broken Your Boost and like will remind me to sell so please keep supporting so that this post reminds me to sell MRF at 1.45K levels

bears active, gold price below 3300Plan XAU day: 27 June 2025
Related Information:!!!
In fact, Powell reiterated this week that the Fed is well-positioned to wait before cutting interest rates until it has a clearer understanding of the impact of steep tariffs on consumer prices. His comments sparked fresh criticism from US President Donald Trump, who has been calling for lower interest rates. Furthermore, reports indicate that Trump is considering naming Powell's successor by September or October.
This development raises concerns about a potential erosion of the Fed’s independence, which should limit any immediate positive reaction in the USD to the upcoming inflation data. In turn, this suggests that the path of least resistance for the XAU/USD pair remains to the upside, and any further decline may still be viewed as a buying opportunity.
personal opinion:!!!
Gold prices are consolidating around 3280 - 3290 in the European trading session, accumulating for selling pressure to prevail.
Important price zone to consider : !!!
BUY point: 3272; 3248 zone
Sustainable trading to beat the market

Selling pressure, gold price falls below 3300Plan XAU day: 24 June 2025
Related Information:!!!
Gold price (XAU/USD) maintains a heavily bearish tone during the first half of the European session and is currently trading just above the nearly two-week low reached earlier this Tuesday. News of a ceasefire between Iran and Israel has boosted investor confidence and triggered a fresh wave of global risk-on sentiment, which is seen as a key factor driving funds away from the safe-haven precious metal.
Meanwhile, the intraday decline appears largely unaffected by continued US Dollar (USD) selling, which would typically support gold prices. Mixed US PMI data and dovish comments from Federal Reserve officials have fueled speculation about a possible rate cut in July. As a result, the USD has fallen to a more than one-week low, which could offer some support to gold ahead of Fed Chair Jerome Powell’s upcoming testimony.
personal opinion:!!!
Strong selling pressure, gold price continues to be under downward pressure. War negotiation information is becoming an obstacle causing gold price to drop sharply.
Important price zone to consider : !!!
BUY point: 3304; 3293 zone
Sustainable trading to beat the market

Gold price returns to 3363 price zone, gold selling pointPlan XAU day: 20 June 2025
Related Information:!!!
Gold price (XAU/USD) is seen consolidating its intraday losses to over a one-week low and is trading just below the $3,350 level during the first half of the European session. Earlier this week, the US Federal Reserve (Fed) trimmed its outlook for rate cuts in 2026 and 2027, which is seen as a tailwind for the US Dollar (USD) and is weighing on demand for the non-yielding yellow metal.
In addition, a generally positive tone in European equity markets is another factor putting pressure on Gold prices. However, rising geopolitical tensions in the Middle East may cap market optimism amid ongoing trade-related uncertainties and help limit losses for the safe-haven XAU/USD, which remains on track for weekly losses
personal opinion:!!!
Gold price in sell zone, trend line 3362
Important price zone to consider : !!!
SELL point: 3362 zone
Sustainable trading to beat the market

short term downtrend! sell gold 3379Plan XAU day: 19 June 2025
Related Information:!!!
Gold prices show minimal gains as the Asian session begins, following the Fed’s decision to maintain rates while indicating they are still considering two rate cuts. Meanwhile, US President Donald Trump’s comments on Iran triggered a pullback toward a weekly low of $3,362 before settling at around current levels. XAU/USD is trading at $3,375, up 0.19%.
On Wednesday, the Fed kept rates unchanged as expected and updated its economic projections for the United States (US). The median forecasts suggest that Gross Domestic Product (GDP) will be lower than in March’s projections, while the unemployment rate is expected to rise slightly. Inflation is likely to end around the 3% level, and the Federal Funds Rate forecast indicates policymakers are anticipating 50 basis points of easing
personal opinion:!!!
Gold price confirms downtrend in Asian session, price zone 3379 following downtrend line
Important price zone to consider : !!!
SELL point: 3379 zone
Sustainable trading to beat the market