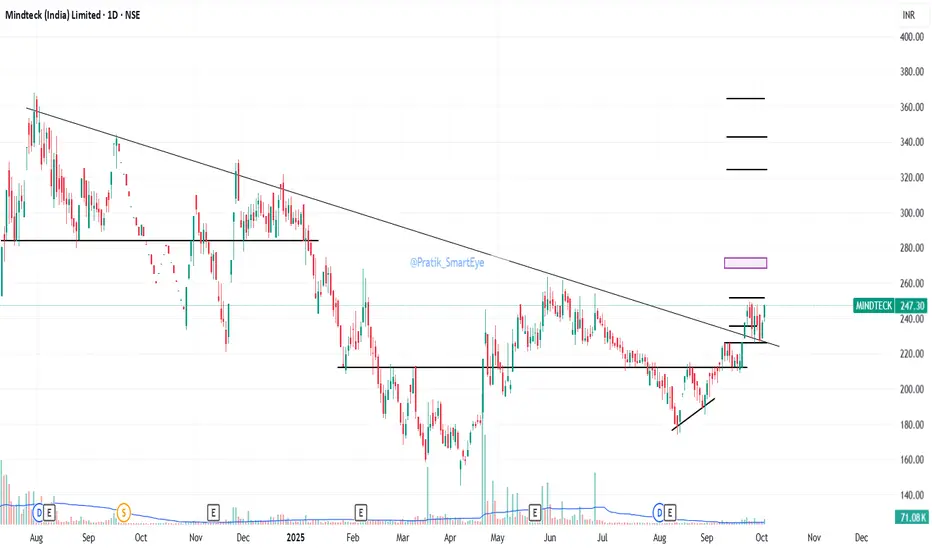
Mindtech India: Breakout at 255.Mindtech India: Breakout at 255. CMP 247.
Resistance 275/324/364
Support 235/226
Semiconductor Sector Tailwinds
Semiconductors
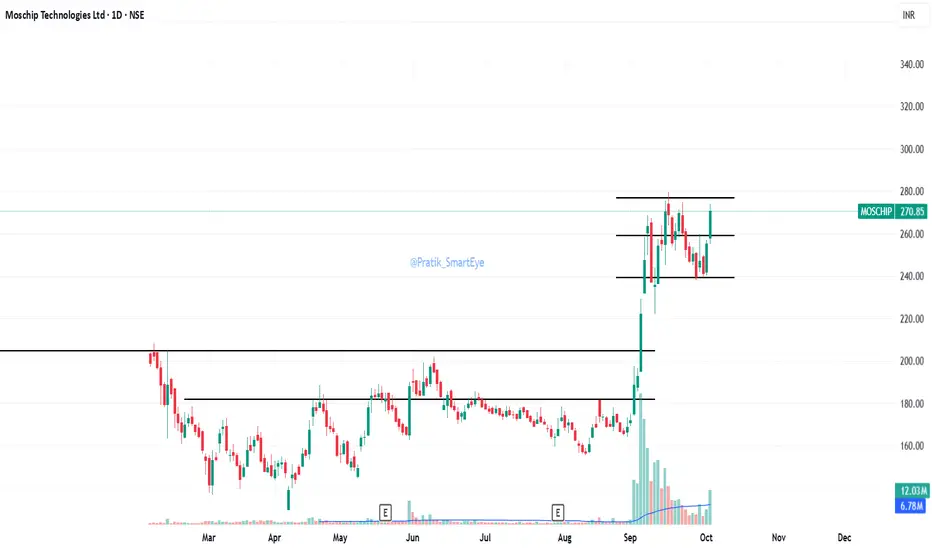
Moschip Technologies: Breakout at 277.Moschip Technologies: Breakout at 277. CMP 270.
Resistance 320
Support 241
Semiconductor Sector Tailwinds
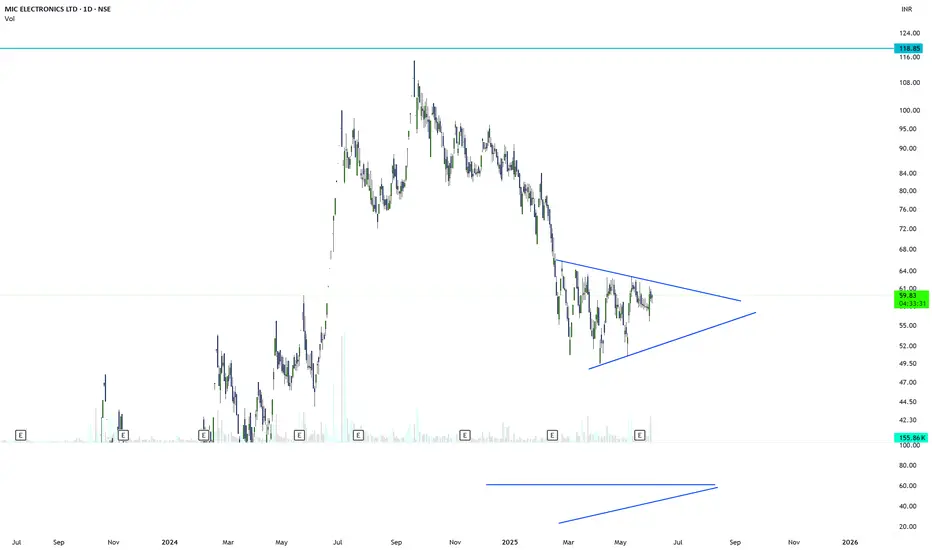
MICEL : another move in makingMICEL looks good on chart and RSI on Daily time frame is convincing a breakout candidate. Keep an eye on it and enter with a nominal Stoploss. Expecting 20% move soon.
NOTE : I'm not a SEBI REG. Study charts before investing.
SMHSMH VanEck SemiConductor ETF
CMP: $293.64
In July 2024, SMH posted a high of $281.82, followed by a consolidation phase with a bottom at $170.11.
The recent rally to $302.98 marks a strong recovery from those lows, confirming a breakout above the key resistance zone of $234–262. A retest of this breakout zone is still pending, with the weekly support cluster
$224–235 being an area of concern as gap formed on 12th May 2025.
Until a decisive move emerges, the price action may remain sideways in the weeks/months ahead.

Nvidia (NVDA) – Building the AI Wave, Not Just Riding ItCompany Overview:
Nvidia NASDAQ:NVDA remains the undisputed leader in AI, high-performance computing, and now increasingly software infrastructure. With growing exposure to agentic AI, healthcare AI, and autonomous systems, Nvidia is redefining its growth story beyond semiconductors.
Key Catalysts:
🧠 Software Ecosystem Expansion
AI Blueprints, Llama Nemotron, and NIM microservices fuel adoption of agentic AI
High-margin, recurring revenue from software complements GPU hardware growth
Moves Nvidia closer to a platform-as-a-service model
🏥 Healthcare AI Momentum
Siemens Healthineers adoption of MONAI Deploy accelerates Nvidia’s footprint in diagnostics & imaging
Opens the door to pharma, life sciences, and clinical AI markets—a multi-billion-dollar TAM
🔧 Physical & Agentic AI Enablement
Positioned at the frontier of robotics, autonomous machines, and next-gen interfaces
Nvidia's tech stack is becoming foundational to the next wave of machine intelligence
Investment Outlook:
✅ Bullish Above: $120.00–$125.00
🎯 Target Price: $220.00–$230.00
📈 Thesis Drivers: AI platform leadership, expanding software revenue mix, and key vertical growth in healthcare & robotics
🧩 Nvidia isn’t just enabling AI—it’s defining its future. NASDAQ:NVDA #AIStocks #AgenticAI #Semiconductors
DIXON- Backed by Semi Conductor PlayHighly resilient stock Dixon has fallen the least in weak markets.
This stock has followed the channels well until now.
Brokerages have gradually increased BUY ratings on this one as well.
Targets: 18000+
Stop Loss: 12000
You are responsible for your own loss/profit.

Bullish Outlook: MOSCHIP Above 120 Signals Potential Bull RunDetails:Asset: MOSCHIP Technology (MOSCHIP)Breakout Level: Above 120Potential Targets: Projection based on technical analysis and market sentimentStop Loss: Below breakout level or as per risk toleranceTimeframe: Medium to long-termRationale: MOSCHIP, a semiconductor stock, is poised for a potential bull run with a breakout anticipated above the 120 level. The company stands to benefit from growing domestic demands for semiconductors, which are essential components in various electronic devices. With increasing competition among semiconductor manufacturers, MOSCHIP's focus on domestic needs presents an opportunity for significant growth and market penetration.Market Analysis:Growing Domestic Needs: MOSCHIP's alignment with the growing domestic demand for semiconductors positions it favorably in the market.Competitive Advantage: The company's focus on competing with larger players in the semiconductor industry, especially in sectors beyond household electronics, enhances its potential for growth and profitability.Potential Bull Run:Market Sentiment: Positive market sentiment towards semiconductor stocks and MOSCHIP's strategic positioning could catalyze a bull run.Sector Growth: Favorable industry trends and increasing demand for semiconductors may contribute to MOSCHIP's upward trajectory.Risk-Reward Ratio: Consider individual risk tolerance and implement appropriate risk management strategies.As with any investment opportunity, it's essential to conduct thorough research and monitor market developments closely.

Moschip ready for the uptrend!🤩💸🔥Buy Moschip Technologies for Positional Trading as well as Investment.💸🔥💸
Comment your views‼️😄
.
💡About Company:
Moschip Technologies Ltd is a semiconductor and system design company with a focus on Turnkey ASICs, Mixed Signal IP, semiconductor & product engineering, and IoT solutions catering to aerospace & defence, consumer electronics, automotive, medical and networking & telecommunications.
.
💡Segment-wise Revenue Breakup:
In FY21, semiconductor services & products accounted for ~86% of revenues and embedded services & products accounted for the rest ~14% of revenues.
.
💡International Presence:
The company has significant business from export countries. In FY21, exports accounted for ~58% of revenues compared to 56% in FY20.
.
The stock will most likely get benefitted from PLI scheme launched by the government for Semi-Conductor designers and fabricators
.
✅Although the stock is risky, Technically it is strong with Fundamentals just starting to get better.💪💪
The company recently posted the best Q3 Result.
.
❇️The stock had given 18 Year long Volume Breakout last month and then it was in a retracement phase. Now with volume continuation, we can expect a strong uptrend from here.
.
💎@technofunda_trader
Few Important rules from my Trading Philosophy:
Don't compromise on the quality of stock.
2. Buy right, Sit tight- Only sell in loss if the fundamentals deteriorate, problems arise in management or any other similar issues.
3. Don't invest more than 5-10% in any stock & more than 25% in any particular or related sector. If stock is risky don't invest more than 2-3%.
4. Build position gradually as the stock rises.
5. Trade in the direction of the bigger trend.
6. Ride the trend, don't sell your winners early.
.
Like, Comment & Share 😄😄😄

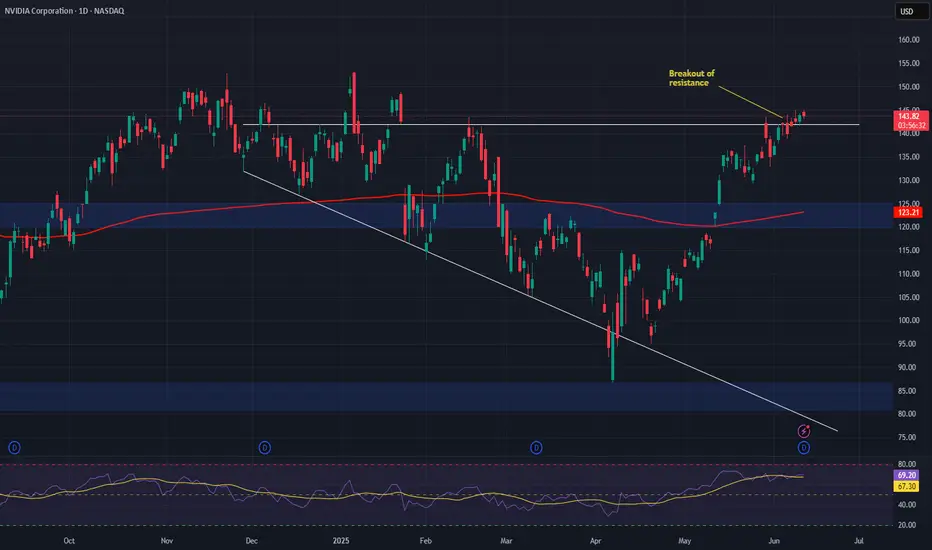
Nvidia at triple support levelNvidia has taken support from
1) 61.8% Fibonacci retracement level from the lows of gap up point of October 25 to high of Nov 22
2) 38.2% Fibonacci retracement level from the 16 Feb 2021 breakout level to the highs of Nov 22.
3) Trend line formed by connecting highs of Feb 16, July 6, and Aug 30
NASDAQ:NVDA

Motherson Sumi Monthly Chart AnalysisMotherson Sumi as per monthly, weekly and daily chart analaysis its in consolidation phase and once it breaks above 260 level then its a multi year break out and target 270 level.

MARUTI SUZUKI INDIA LIMITED-THE POTENTIAL BEAST TO RISE?India's largest automobile manufacturer is seen to have factored in all sorts of negative news inflows relating to low production volumes ,semi conductor shortage, global rise in raw material prices, sky rocketing fuel prices and lots more.The beast had given a breakout from a triangle pattern with a successful retest and looks as it would continue the upside rally. Maruti is seen approaching its multi time tested strong hurdle zone of 7700-7900, a closing above 8000 on a weekly timeframe will make the people square off their short positions in the markets and will bring in fresh buyers in the system. Aggressive traders can enter after the weekly closing of 8000 with strict suitable stop losses and the set of defensive traders can enter after 8250 is taken off and after an analysis of the option chain, not exactly but it is forming a structure similar to an inverted head and shoulders, targets to be expected in the medium to long run are 8675-9300-9900. the reason i always say to maintain a strict stop loss is that ;to stay in the game you need your capital and your first aim must be to protect your capital, NEVER RUSH INTO ANY TRADE,WAIT FOR THE ENTRY TO TRIGGER AND THEN RIDE THE TRADE WITH PATIENCE AND CONVICTION

LRCX Lam Research and the Semiconductor Chip ShortagesLet`s put this into the context of the Semiconductor Chip Shortages:
LRCX Lam Research makes the equipment needed to manufacture new chips.
TSM Taiwan Semiconductor is raising its capital equipment budget.
Earnings in 4 days! i expect to have solid gains.
On 4/16/2021 Credit Suisse Group Boosted Price Target to Outperform ➝ $750.00
91.991B MARKET CAP
0.81% DIVIDEND YIELD
32.23 P/E Ratio
This should be a safe bet for the next week.
If you are interested to test some amazing BUY and SELL INDICATORS that i use, which give the signal at the opening of a candle, not at the the candle close, like others do, just leave me a message.
