Institutional Intraday option Trading🏦 Institutional Intraday Option Trading
Institutional Intraday Option Trading is the practice of trading options contracts within the same trading day by large financial institutions such as hedge funds 📊, proprietary trading firms 💼, banks 🏛️, and asset managers 💰.
These trades are high-speed, high-volume, and data-driven, designed to capitalize on short-term price movements in the market.
🔧 How It Works:
Institutions use:
⚙️ Advanced algorithms & HFT (High-Frequency Trading)
📉 Options Greeks (Delta, Theta, Vega) to manage risk precisely
🔍 Market depth, volume flow, and order book analysis
🧠 Technical patterns + real-time news feeds
🛡️ Hedging strategies to protect larger positions
🧩 Key Objectives:
💰 Generate quick profits from intraday volatility
📈 Use options premium decay (Theta) to their advantage
📊 Adjust positions rapidly as market conditions change
🧾 Create delta-neutral or gamma-scalping strategies
🧠 What Makes It Different From Retail Intraday Trading?
🚫 No guesswork – it's all data-backed decisions
💼 Huge capital allows for tight spreads and custom contracts
📍 Institutional traders don’t chase trades – they create liquidity
📌 In simple words:
Institutional Intraday Option Trading is how the smart money uses options to profit from minute-to-minute market moves, while controlling risk and maintaining strategic precision.
Sensex

Small Account Scalping / Challenge Trading🔍 What is Small Account Scalping?
Scalping means taking very short, quick trades — entering and exiting the market in a matter of seconds to a few minutes — to capture small price moves.
Now combine this with a small account — typically ₹1,000 to ₹10,000 (or $100 to $500). You're looking at a trading style where:
Tiny profits are taken quickly
High discipline and speed are critical
Risk-to-reward ratios are tight
Compounding is the core idea (small wins stack up)
Scalping with a small account is not just about earning big money quickly — it's often done as a "challenge" to prove skill, build discipline, or simply to show that trading isn’t about how much money you have, but how well you manage it.
🎯 What is Challenge Trading?
Challenge Trading is when a trader publicly sets a goal, like:
Turning ₹5,000 into ₹50,000
Growing $100 to $1,000 in 30 days
Doubling capital in 10 trades
These challenges are usually:
Documented daily (on YouTube, Telegram, or Instagram)
Done with full transparency
Focused on scalping or intraday setups
Built around strict rules and money management
Why do people do it?
For credibility
To learn discipline
To inspire beginners
To prove skill without needing big capital
📉 Why Most Traders Fail with Small Accounts
Let’s be honest — 90% of small account traders blow their capital within days or weeks.
Here’s why:
1. Overleveraging
Trying to turn ₹1,000 into ₹5,000 in one day? Most traders overtrade, use max quantity, and take unnecessary risks.
2. No Risk Management
They don’t respect stop-losses. One bad trade wipes 50% or more of their account.
3. Emotional Trading
Small capital = High emotions. Losing ₹300 from ₹1,000 hurts more than ₹3,000 from ₹1,00,000.
4. No Consistency
They jump from strategy to strategy. From breakout trading to option buying to indicator-based setups — nothing sticks.
5. Trying to Get Rich in One Day
Small accounts are not magic lamps. Trying to “flip money” quickly always backfires without a strong base strategy.
✅ How to Actually Win at Small Account Scalping
Let’s now focus on how to do it right — step by step.
✳️ Step 1: Choose the Right Market Instrument
For scalping with small capital, you want:
High liquidity (easy entries & exits)
Fast movement
Low capital requirement
Some good choices:
Index options like Nifty/BankNifty Weekly
FinNifty (Tuesday expiry)
Micro lots in Futures (if margin allows)
USDT/INR scalping on crypto exchanges (Binance, CoinDCX)
Stocks like Reliance, Tata Motors, SBIN – but be cautious
Avoid:
Illiquid stocks
High lot-size contracts
Multi-leg option strategies with high cost
✳️ Step 2: Pick a Scalping Setup That Works
You don’t need 10 strategies. Just 1-2 that work well on a small timeframe.
Examples:
Breakout on 1-min chart
Mark consolidation
Wait for breakout candle with volume
Enter with tight SL, book in 1:1.5 or trail
VWAP Rejection Entry
Wait for price to test VWAP
If rejected, enter in the opposite direction
Small risk, quick reward
Fakeout Trap
Market fakes breakout → reverses
Enter with confirmation of reversal
Common in BankNifty scalping
News-Based Scalping
RBI decisions, GDP data, Budget day
Extreme volatility → use strict stop-loss
✳️ Step 3: Master Position Sizing
Golden rule: Never lose more than 2-3% in one trade.
With ₹2,000 capital:
Risk max ₹40–₹60 per trade
Use option buying, not futures
Focus on quantity control
If you're using 50% of capital in one trade, you’re doing it wrong. That’s not scalping — that’s gambling.
✳️ Step 4: Use a Simple Tool Setup
Keep your charts clean.
Timeframe: 1-min or 3-min
Indicators: VWAP, EMA (9 or 20), Volume
Levels: Draw basic support/resistance
Avoid: Overloaded charts with 6 indicators
✳️ Step 5: Take Only 1–3 Trades a Day
In small account scalping, overtrading kills faster than losing.
Max 3 trades per day
Win 2 out of 3 = Green Day
Lose 2 = Stop trading
Stick to the plan. Live to trade another day.
✳️ Step 6: Focus on % Growth, Not ₹ Profit
Don’t compare yourself to traders making ₹20K/day
If you make ₹150 on ₹2,000 → that’s 7.5% gain
Make 5% a day for 20 days = 100% monthly compounding!
Small wins matter. They build discipline, confidence, and capital.
🧠 Psychology Behind Challenge Trading
To win the small account game, your mindset matters more than your strategy.
Mental Rules:
Treat every rupee as if it’s ₹1,000
Never chase revenge trades
Accept red days calmly — they’re part of the game
Celebrate consistency more than profit
📌 Tracking Your Progress
Make a Trading Journal:
Entry/Exit time
Setup used
Why you entered
How you felt
Profit/Loss
Over 30 days, this builds emotional and strategic control.
🚫 Mistakes to Avoid in Small Account Scalping
❌ Averaging in loss
❌ Trading without stop-loss
❌ Copying random Telegram tips
❌ Overtrading after losses
❌ Ignoring brokerage and slippage
❌ Expecting daily profits
🏁 Final Words: Is Small Account Scalping Worth It?
✅ YES — if:
You want to build confidence and discipline
You want to master trading with risk management
You like fast-paced, quick decision-making
❌ NO — if:
You’re in a hurry to make big profits
You trade emotionally
You don’t journal your trades or follow structure
It’s a journey — not a race.
With patience and process, your ₹2,000 account can one day fund your ₹2 Lakh trading journey.
Learn Institutional Trading🔷 What is Institutional Trading?
Institutional Trading refers to how big players (institutions) like mutual funds, hedge funds, pension funds, insurance companies, and proprietary trading firms operate in financial markets—especially in stocks, futures, and options. These institutions trade with huge capital—often in crores or billions of rupees/dollars—and have access to advanced tools, data, and insider-level insights that retail traders (individual traders like us) do not.
They don’t trade based on tips, YouTube calls, or simple indicators like RSI or MACD. They trade based on order flow, liquidity zones, volume data, and macroeconomic models. Their strategies are often data-driven, algorithmic, and backed by deep research.
🔷 Why is it Important to Learn Institutional Trading?
Because retail traders often lose money by following surface-level analysis. If you want to play against or with the big boys, you need to understand how institutions think, trade, and manipulate the market to create liquidity and trap uninformed traders.
Once you start thinking like an institution, you’ll stop falling for fake breakouts, news-based traps, or retail patterns that no longer work.
🔷 How Do Institutions Trade?
Institutions don’t just click "buy" or "sell" like retail traders. They use strategic and layered approaches to build or unload positions without disrupting the market.
Let’s break down some techniques:
1. Accumulation and Distribution
Accumulation Phase: This is where institutions silently buy large quantities of a stock at lower prices without moving the market too much.
Distribution Phase: After pushing the price up (with smart buying), they start selling slowly to retail traders who are buying out of FOMO.
👉 Retail gets trapped at the top, institutions exit with profit.
2. Order Flow & Liquidity Grabs
Institutions need liquidity to enter or exit. That’s why they often:
Create fake breakouts or false signals to trap retailers.
Induce stop-loss hunting moves to trigger retail orders (that’s their liquidity).
Then, they reverse the market direction, moving it in their favor.
This is often called Smart Money Concepts.
3. Volume Weighted Trading
Institutions monitor VWAP (Volume Weighted Average Price) to decide their entries/exits. They break up large orders into small pieces and execute them using algorithms to stay unnoticed.
4. Use of Derivatives (Options & Futures)
They hedge their large cash market positions using options and futures, which allow them to manage risk efficiently while maximizing profit.
🔷 Institutional Trading Strategies
Here are some strategies that institutions commonly use (simplified for learning):
📌 1. Long/Short Equity
Long on undervalued stock
Short on overvalued stock in the same sector
Reduces risk, aims to profit from relative performance.
📌 2. Arbitrage Trading
Taking advantage of price differences in different markets (e.g., cash-futures arbitrage).
📌 3. Sector Rotation Strategy
Moving capital from underperforming sectors to upcoming ones based on macroeconomic analysis (e.g., rotating from IT to Pharma).
📌 4. Options Hedging
Buying call/put options to protect existing large positions.
Selling premium to generate income (covered calls, iron condors).
📌 5. Event-Driven Trades
Based on earnings, mergers, policy changes (institutions often trade heavily on such events, with better insight and preparation).
🔷 Signs of Institutional Activity
Watch for these clues:
Unusual volume with no news
Sudden reversals after stop-loss hits (classic liquidity grab)
Consolidation near support/resistance with rising volume (accumulation)
Breakouts with heavy volume follow-up (institutional buying confirmation)
Options OI buildup in a particular strike
🔷 How to Learn Institutional Trading (Step by Step)
Understand Market Microstructure
Learn how orders, bid-ask spreads, and liquidity actually work.
Master Price Action and Volume Analysis
Indicators lag. Institutions trade with price and volume.
Learn about Order Blocks, Fair Value Gaps
These are institutional concepts showing where smart money entered.
Study Smart Money Concepts (SMC)
Focus on concepts like:
Liquidity Sweep
Inducement
Mitigation
Imbalance zones
Market Structure Shift
Use TradingView Smart Tools
Explore order block indicators, volume profile, VWAP, etc.
Observe Options Open Interest (OI)
Track institutional options positions using OI analysis.
Backtest and Practice
Use market replay tools to simulate institutional strategies.
🔷 Myths About Institutional Trading
❌ "Institutions only invest, they don’t trade intraday."
→ Truth: They have high-frequency trading (HFT) algorithms that execute millions of trades daily.
❌ "You need crores to trade like an institution."
→ Truth: You can mirror their logic even with small capital—if you understand market structure, liquidity, and volume.
❌ "Retail traders can’t win."
→ Truth: You can’t win if you play their game with your rules. But if you learn how they play, you can follow their footprints.
🔷 Final Thoughts
Institutional Trading is not a “strategy,” it’s a mindset.
It's about understanding:
Where is smart money entering or exiting?
Where is retail being trapped?
Where is liquidity sitting?
Once you start focusing on market structure, volume behavior, price action, and liquidity zones, your trades will become more accurate, logical, and profitable.
Retail indicators lag. Institutions don’t follow them.
They create the moves, while indicators show what already happened.

Advance Option Trading🔶 What Is Advanced Options Trading?
Advanced Options Trading goes beyond buying and selling simple Calls and Puts. It’s about using multi-leg strategies, managing risk with precision, applying greeks and volatility, and aligning your trades with market conditions.
Advanced traders treat options like a math-based chess game. They don’t gamble—they strategize, hedge, spread, and use data-driven decisions to extract profits in all kinds of markets (bullish, bearish, sideways, volatile, calm).
🔍 Why Learn Advanced Options Trading?
While beginners just "buy options" hoping for a quick profit, advanced traders use options to:
Control risk
Earn consistent income
Capitalize on volatility
Trade sideways or range-bound markets
Create hedges for portfolios
Use smart capital deployment with defined risk
2️⃣ Implied Volatility (IV)
IV tells you how expensive or cheap options are.
📈 High IV = Options are expensive → Ideal for selling
📉 Low IV = Options are cheap → Ideal for buying
Advanced traders use:
IV Rank / IV Percentile
Volatility skew analysis
Volatility crush trades around earnings or events
3️⃣ Option Strategies
Here’s where real skills come in. Advanced trading uses multi-leg strategies to limit loss, increase odds, or make money in non-directional moves.
🔍 Strategy Example: Iron Condor
Sell 22000 CE
Sell 21800 PE
Buy 22100 CE (hedge)
Buy 21700 PE (hedge)
You’ll profit if the index stays between 21800 and 22000, and time decay works in your favor.
✅ Defined risk
✅ Limited profit
✅ Great for expiry week if market is range-bound
💹 Advanced Techniques for Smart Trading
Let’s now explore how pros operate:
🔸 A. Delta-Neutral Trading
Institutional or advanced traders often create delta-neutral positions—no directional bias.
Example:
Buy Call option (Delta +50)
Sell Put option (Delta -50)
Net Delta = 0 → Neutral. The position doesn’t care which way market moves—only volatility or time decay matters.
🔸 B. Hedging with Options
Advanced traders hedge their stock or futures positions using options.
Example:
You hold ₹5 lakh worth of Reliance shares
You buy Reliance PUT options to protect downside risk
Result? You keep profits if stock goes up and protect capital if it drops. It's like insurance.
🔸 C. Trading Earnings or Events
Options let you trade volatility, not just direction. Ahead of events like:
Earnings reports
RBI or Fed meetings
Budget announcements
You can use:
Straddles / Strangles (if expecting big move)
Iron Condors (if expecting no major move)
Calendar spreads (to exploit IV difference)
🔸 D. IV Crush Strategy
Before major events, IV rises. After the event, IV drops (called IV crush).
Advanced traders:
Sell options before events (high premium)
Buy options after IV crash (cheap premium)
They know when NOT to buy options just before news—because premium is inflated!
🔸 E. Adjusting Trades
Advanced traders don’t just “hope” for success. If a trade goes wrong, they adjust it:
Roll to a new strike
Convert from debit to credit spreads
Hedge with opposite positions
Manage Delta/Theta/Vega exposure
This proactive style protects capital and increases recovery chances.
🛠️ Tools Used by Advanced Option Traders
Opstra / Sensibull – Strategy builder, Greek analyzer
TradingView – Charting & technical levels
OI Analysis Platforms – For understanding institutional footprints
Python / Excel – Custom backtesting tools
Algo Platforms – For speed and logic-based execution
📌 Important Rules for Advanced Option Traders
Don't chase trades. Let trades come to you.
Always define risk before entering.
Use multi-leg setups, not naked options unless there's an edge.
Stay Theta positive in low volatility markets.
Only buy options when IV is low and breakout is expected.
✅ Final Thoughts
Advanced options trading is a skillset—not a shortcut.
If you:
Want consistent profits
Wish to trade like institutions
Hate gambling and want a plan
Love logic, numbers, and control
…then advanced option trading is your next big step.
It gives you the tools to win in all market types, not just trending ones.

Master Institutional Trading🎯 Introduction
Master Institutional Trading is the advanced art and science of trading the financial markets the way big institutions do — with deep capital, strategic precision, and unmatched risk management.
Unlike retail trading, which often relies on basic indicators and emotions, institutional trading follows a rule-based, data-driven, and psychology-controlled framework. Mastering this approach means stepping into the mindset and strategy of hedge funds, mutual funds, proprietary desks, and investment banks.
If you want to trade with consistency, clarity, and capital preservation, mastering institutional trading is the next step.
💡 What is Institutional Trading?
Institutional trading refers to the activities of large financial entities that control significant capital and influence market movement through their trades.
Examples include:
Hedge Funds
Mutual Funds
FIIs (Foreign Institutional Investors)
DIIs (Domestic Institutional Investors)
Pension Funds
Proprietary (Prop) Trading Desks
These institutions operate based on in-depth research, order flow analysis, macroeconomic models, and advanced risk frameworks.
🧠 What Does “Master Institutional Trading” Mean?
It means gaining the skills, tools, mindset, and techniques to:
Analyze market movements through institutional logic
Identify smart money footprints
Build trades based on volume, order flow, and positioning
Manage risk with capital preservation like pros
Avoid retail traps and fakeouts set by institutions
You’re not just reacting to the market—you’re reading what the big players are doing and aligning with them.
🧩 Core Concepts in Master Institutional Trading
1. Market Structure Analysis
Understand liquidity zones, order blocks, and institutional S/R
Learn why institutions build positions over time, not all at once
2. Volume & Open Interest Analytics
Spot unusual volume spikes
Understand Open Interest traps in options
Decode what institutions are betting on
3. Smart Money Concepts
Accumulation and Distribution phases
Wyckoff Theory in modern application
Spotting manipulation and liquidity grabs
4. Advanced Risk Management
Never risk more than 1–2% per trade
Use position sizing based on volatility
Focus on capital efficiency, not revenge trading
5. Price Action + Institutional Candle Patterns
Recognize imbalance zones, breaker blocks, and engulfing traps
Use tools like VWAP, Delta Volume, and Footprint Charts
6. Trade Execution Techniques
Partial entries
Scaling in/out like funds
Managing trade lifecycle like a desk trader
🛠 Key Strategies in Master Institutional Trading
A. Liquidity Hunting
Institutions place orders where most retail SLs are placed
Then reverse price after triggering retail orders
B. Options Positioning & IV Play
Use of Straddles/Strangles for theta decay
Selling volatility pre-event, buying it post-event
C. Delta Neutral & Gamma Scalping
Market-neutral strategies hedged with futures or stocks
Designed to profit from volatility swings
D. Accumulation/Distribution Mapping
Long consolidation = institutional entry/exit
Price reacts to volume shifts more than indicator signals
🔥 Institutional Footprint Examples (Nifty/Bank Nifty)
ATM Straddle OI surge with no move in price
→ Market makers hedging aggressively = big move coming
Sudden OTM Put buying with high IV on a flat day
→ Institutions betting on downside volatility = potential crash setup
VWAP deviation rejection
→ Institutions use VWAP as a fair value; moves away from it often reverse
👨🏫 How to Master Institutional Trading?
✅ Step-by-step Learning Path:
Study Market Microstructure
Understand how orders get matched, what limit/market orders do.
Learn Option Greeks & Institutional Strategies
Especially delta, gamma, and IV crush.
Use Volume Profile, VWAP, OI data together
Build your view based on multi-layered confirmation.
Follow FIIs/DII Data Daily
Learn how they position in equities, derivatives, and sectors.
Backtest Institutional Setups
Focus on risk-reward, not just accuracy.
Use Trading Journals
Analyze what works, improve continuously.
⚠️ Common Mistakes Traders Make (That Institutions Don’t)
Chasing trades emotionally
Overtrading low-conviction setups
No journaling or review process
Relying on random indicators instead of structure
Ignoring risk-to-reward or capital management
🧘♂️ Mindset of Institutional Traders
"Protect capital first, profits will follow."
Trade like a sniper, not a machine gun.
Think in terms of probabilities, not guarantees.
Never marry your analysis; adapt to new information.
💼 Who Should Learn Master Institutional Trading?
Intermediate to advanced traders
Full-time traders or those planning to go full-time
Derivatives traders (Nifty, Bank Nifty, Options)
Students of technical analysis who want a deeper, real-world edge
🔚 Final Words
Master Institutional Trading is the next-level evolution of your trading journey. It’s about stepping away from noise and hype, and embracing how real money trades.
You don’t need a hedge fund job to trade like one—you just need the knowledge, tools, and discipline. When you think and act like an institution, you stop being prey and start playing the game with the big players.

institutional Nifty-50 option tradingInstitutional Nifty-50 option trading refers to the strategic use of Nifty-50 options (CE & PE) by FIIs, DIIs, Hedge Funds, and Banks to hedge, speculate, or manage risk on large capital positions. Unlike retail, their trades are data-driven and volume-heavy.
Key Institutional Strategies:
Delta-Neutral Strategies – Like Long Straddles or Strangles, where institutions profit from volatility.
Covered Call / Protective Puts – To hedge large Nifty portfolios.
Bull/Bear Spreads – Deployed when directional conviction is strong but limited in risk appetite.
Option Writing – Writing options at OI resistance/support to generate premiums.
Calendar Spreads – Leveraging time decay while anticipating movement.
📈 How to Track Institutional Activity:
Option Chain Analysis: Spot high OI shifts with unusual volumes.
OI + Volume + IV: Use combined data to infer institutional positioning.
Change in PCR (Put Call Ratio): Signals sentiment shift at index levels.
FII-DII Daily Derivative Data: Published by NSE after market hours.
Strike-wise Open Interest Heatmaps: Help identify resistance/support zones built by institutions.

Institutional Intraday option Trading High Volume Trades: Institutions trade in huge lots, often influencing Open Interest.
Data-Driven Strategy: Backed by proprietary models, AI, and sentiment analysis.
Smart Order Flow: Institutions use algorithms to hide their positions using Iceberg Orders, Delta Neutral Strategies, and Volatility Skew.
⚙️ Tools & Indicators Used:
Option Chain Analysis
Open Interest (OI) & OI%
Put Call Ratio (PCR)
Implied Volatility (IV)
Max Pain Theory
Gamma Exposure (GEX)
🧠 Common Institutional Strategies:
Covered Calls – Generate income on large stock holdings.
Protective Puts – Hedge downside risk.
Iron Condor / Butterfly Spread – Capture premium with neutral view.
Long Straddle/Strangle – Expecting big move post-news.
Synthetic Longs/Shorts – Replicating stock exposure using options.

Intraday Breakout + Fakeout TradingPart 1: What Is a Breakout?
A breakout happens when the price moves decisively beyond a key level — like a recent high/low, trendline, or chart pattern.
Example: If the stock "ABC" has traded between ₹100–₹105 all morning and then suddenly moves above ₹105 with momentum, that’s a breakout.
Breakouts often occur with increased volume, indicating real interest and strong buyer or seller participation.
Why Breakouts Matter:
They signal a new trend beginning — price can continue the breakout move.
Give good entry points for intraday traders, with momentum and direction aligned.
Part 2: The Hidden Danger — Fakeouts (False Breakouts)
A fakeout looks like a breakout initially but fails.
Price might pop past ₹105 momentarily, lure traders into buying, then reverse back inside the range.
This traps breakout buyers and gives fast momentum to the opposite side.
Fakeouts are common because:
Institutional traders (banks, funds) trigger stops to create liquidity
They force retail traders to enter at highs or lows, then reverse.
Why Fakeouts Happen
Liquidity needs: Big orders need counterparties. Institutions use stop hunting to liberate liquidity from retail participants.
Retail psychology: People see a breakout and jump in, hoping for a move, not realizing large players might be on the other side.
Pattern triggers: A small breakout can trigger algos or smart traders, but institutions may let it fail and reverse.
Part 3: Trading the Breakout — The Bullish Method
1. Identify a Breakout Level
Use recent swing high, consolidation zone, trendlines, or chart patterns (triangles, flags).
Example: ABC stock ranges between ₹100–₹105. Highlight ₹105 as key.
2. Watch Volume
Look for increased volume as price breaks out.
A genuine breakout usually has higher-than-average volume.
3. Enter the Trade
Go long when price is clearly above ₹105 by a few ticks.
Make sure price doesn’t immediately reverse after breakout.
4. Set Stop Loss (SL)
Place SL just below breakout point — e.g., ₹104.50.
Keep risk small (1–2% daily capital per trade).
5. Plan Target
Simple method: Target range size — if range is ₹5, target ₹110.
You can also trail stop as price moves in your favor.
6. Ride or Fade
If breakout momentum is strong, stay in.
If breakout fades early (price returns to range quickly), exit fast with small profit/loss.
Part 4: Trading the Fakeout — The Reversal Strategy
Fakeouts are dangerous but also profitable when traded smartly.
1. Spot the Fakeout
Price breaks above ₹105, but returns inside range within minutes without volume or momentum.
Watch candlestick behavior: long wick, small body, low volume.
2. Manage Delay
Don’t react instantly. Wait for confirmation — price must clearly move back below breakout level.
3. Enter Short (or Long on Breakdown false in opposite direction)
Example: If price drops back below ₹105 by ₹1–₹2, you can short with tight risk.
Stop loss goes just above failed breakout high — e.g., SL at ₹106.
4. Aim for Targets
Range low or midpoint makes sense — e.g. ₹100–₹102.
Use ATR (Average True Range) to estimate a reasonable target distance.
Part 5: Examples in Real Language
Example 1: Breakout in a 5-Min Chart
ABC stock consolidates 10–15 mins between ₹100–₹105.
At 10:30, price surges to ₹106 with strong green candle and large volume.
Entry: ₹106. SL: ₹105.50. Target: ₹110. You ride a strong up move.
Example 2: Fakeout in a 15-Min Chart
DEF stock ranges ₹200–₹205 all morning.
At 11:00, price spikes to ₹207 but turns into a long upper wick and low volume.
Price pulls back below ₹205 at ₹204 quickly.
You short at ₹203. SL at ₹207. Target around ₹200–₹202.
Part 6: Tools & Indicators for Intraday Trading
Volume Bars: Watch for spikes during breakout.
VWAP (Volume Weighted Average Price): Key mid-price support/resistance.
ATR: Measure average daily range to avoid unrealistic targets.
Price Action: Candlestick patterns like doji, pin bars show indecision or false moves.
Market Structure: Chart patterns like triangles, rectangles, head & shoulders for scan points.
Part 7: Risk Management — The Secret to Longevity
Trade size: Only risk 1–2% of capital per trade.
Stop loss discipline: Always have one — don’t skip it.
Multiple trades: Treat each trade as an independent probability event.
Journaling: Note entry, exit, what worked, what didn’t — helps improve your edge.
Part 8: Psychology — Stay Sharp
Avoid FOMO: Missing a breakout isn’t the end of the world.
Don’t revenge-trade: A loss? Take a breather — no emotional trades.
Be calm: Fast-moving markets need clear, calm decisions.
Faith in your edge: Breakout/fakeout method gives you a statistical edge. Trust your rules.
Part 9: When It Works Best
High liquidity stocks: Participate in assets with clear range and volume (e.g., Nifty, BankNifty, Infosys).
News quiet sessions: Breakouts are cleaner without macro news noise.
Market in range or coiling: Avoid breakouts in parabolic trending environments — risk of strong false moves.
Part 10: Sample One-Month Plan
Week 1: Learn pattern spotting, practice range identification.
Week 2: Track 5–10 breakout setups, journal volume & outcome.
Week 3: Introduce fakeout reading — analyze failed breakouts.
Week 4: Combine breakout/fakeout strategy with VWAP and ATR for entry confirmation.
Regularly review: entry quality, risk management, and behavioral mistakes.
Risk setup: Pre-calculate target and stop-loss before market open.
🔑 Final Summary
Breakouts are powerful moves above key levels — but confirm with volume and momentum.
Fakeouts trap breakout buyers — these often reverse quickly and offer profitable setups.
Combine both: enter breakouts smartly; trade fakeouts when momentum fails.
Always manage risk — stop-loss, position size, and psychology matter most.
Stick to high-liquidity names and keep perfect trade records.

Cryptocurrency Day Trading🧠 What is Cryptocurrency Day Trading?
Day trading means buying and selling crypto coins within the same day — sometimes within minutes or hours — to profit from small price movements.
You don’t hold positions overnight. The goal is to enter and exit quickly, catch a few percent in price movement, and repeat.
Examples of popular cryptos for day trading:
Bitcoin (BTC)
Ethereum (ETH)
Solana (SOL)
Ripple (XRP)
Pepe, Shiba Inu (Meme Coins)
New trending tokens (like AI or gaming-based tokens)
These coins can move 5% to 50% or more in a single day — that’s what makes day trading so attractive!
📊 Why People Love Crypto Day Trading
24/7 Market Access
Unlike stock markets, crypto never sleeps.
You can trade anytime, even late at night.
Volatility = Profit Potential
Crypto prices move wildly.
More movement = more chances to make money.
Low Barrier to Entry
You can start with $10 or $100.
No big capital or licenses required.
Leverage Options
Platforms like Binance, Bybit, and KuCoin offer leverage (e.g., 5x, 10x, 50x).
This can amplify profits (but also increase risk!).
Fast Results
Unlike long-term investing, day trading gives instant feedback.
You know within hours if you’re winning or losing.
⚙️ How Crypto Day Trading Works (Simple Explanation)
Let’s say you’re watching SOLANA (SOL) today.
Price is moving between $75 and $80.
You notice a pattern: Every time it touches $75, it bounces back up.
So you buy at $75, wait for a small move to $77, and sell.
You just made a 2.6% gain.
Now imagine doing that multiple times in a day, or with larger capital. That’s the basic idea.
🎯 Key Strategies Used in Day Trading
Let’s explore the most common (and effective) strategies in simple language:
1. Scalping
Fastest form of trading.
Holding a coin for seconds to a few minutes.
Goal: Catch tiny moves — 0.5% to 1% — many times a day.
🛠️ Tools: 1-minute or 5-minute chart, high volume coins, tight spreads.
2. Breakout Trading
Price builds up like pressure, then breaks out of a level.
Traders watch for resistance breakout or support breakdown.
After breakout, price usually moves quickly — giving fast trades.
🧠 Tip: Watch key levels and volume spike during breakout.
3. Range Trading (Buy Low, Sell High)
When price stays inside a box or zone.
Traders buy at the bottom of the range and sell at the top.
Simple but powerful when done right.
📌 Use on sideways markets. Works great with RSI (Relative Strength Index).
4. News-Based Trading
Crypto reacts quickly to news (good or bad).
For example: If Bitcoin ETF gets approved → Price jumps.
Traders jump in right after big news and ride the wave.
⚠️ Be careful — fake news can also move markets quickly.
🛠️ Must-Have Tools for Day Trading Crypto
TradingView – Best for charts and indicators.
Binance / Bybit / KuCoin – Major exchanges with good liquidity.
CoinMarketCap / CoinGecko – Track coins, market caps, news.
Twitter / Telegram / Discord – Stay updated on trending tokens.
Stop Loss & Take Profit Tools – Crucial for risk control.
📉 Risk Management – The Life Jacket of a Day Trader
Here’s the truth: Without good risk management, you will lose money — even if your strategy is good.
Here are golden rules:
✅ Never risk more than 1-2% per trade
✅ Always use a stop loss
✅ Don’t chase the market
✅ Don’t trade with emotions
✅ Keep a trading journal
Example: If you have $1000, don’t risk more than $20 on one trade.
😰 Common Mistakes (And How to Avoid Them)
❌ Overtrading
Trying to take too many trades in one day. Your brain burns out.
👉 Take only high-quality setups. Less is more.
❌ No Plan
Trading based on “gut feeling” is gambling.
👉 Always have an entry, stop loss, and target.
❌ Revenge Trading
You lost money — now you're trying to “win it back” emotionally.
👉 Take a break. Come back with a clear head.
❌ Ignoring Risk
Using 20x leverage on meme coins without a stop loss is financial suicide.
👉 Respect the risk or the market will humble you.
🤖 Can You Use Bots or AI?
Yes, many day traders use trading bots or AI assistants to:
Scan for signals
Enter/exit trades automatically
Apply indicators faster
But remember: Bots don’t guarantee profit. You still need logic and supervision.
🧘♂️ Mindset of a Successful Day Trader
The best traders treat trading like a business, not a game.
They are:
Disciplined
Patient
Data-driven
Emotionally stable
Focused on long-term performance, not just daily wins
They don’t chase hype — they follow the process.
💼 Can You Make a Living from Crypto Day Trading?
Yes, but not easily. It takes:
Skill
Discipline
Capital
Experience
Most beginners lose money in the first 3–6 months. That’s normal. But with proper learning, journaling, and strategy, it is possible to be consistently profitable.
📌 Final Thoughts: Is It for You?
Crypto day trading is exciting, fast-paced, and potentially very profitable — but also risky and demanding.
Pros:
High income potential
No 9–5 job
Remote, flexible lifestyle
Cons:
High risk
Mentally exhausting
Emotionally draining
Steep learning curve
If you love analyzing charts, making quick decisions, and have emotional control — this might be for you.
But if you’re not ready for the pressure, consider swing trading or investing instead.
✅ Bonus Tip:
Start with paper trading (demo mode) or trade small amounts before risking big money. Focus on mastering one strategy first before learning ten things at once.

BTCUSD 1D TIMEFRAME🔍 What's Driving Bitcoin Today
Institutional Adoption Increasing
Major financial institutions — hedge funds, asset managers, corporate treasuries — are heavily investing in Bitcoin. Dedicated crypto prime brokers are stepping up to serve these clients, signaling a growing institutional footprint.
Stable Institutional Holdings
While Bitcoin has touched record highs, recent dips reflect profit-taking rather than panic. That’s healthy consolidation, not a crash.
Regulatory Tailwinds in the U.S.
New laws (like the “Genius” and “Clarity” Acts) are clarifying the status of stablecoins and digital assets, boosting confidence. Political support from the current administration has incentivized institutional participation and even the creation of a national Bitcoin reserve.
Technical Patterns Suggesting Continuation
Bitcoin appears to be forming a bullish flag or pennant consolidation near the $118K–$120K level — suggesting a likely continuation toward $140K–$250K, depending on momentum and catalysts.
🧭 Market Outlook
Short-Term: Slight consolidation or mild pullback (common after sharp rallies). Key support zones are $115K–$118K. A bounce here may drive prices back toward $120K–$123K.
Mid-Term: If bulls hold momentum and institutional inflows persist, the next major upside targets are in the $140K–$200K range.
Long-Term: With long-term models and institutional forecasts in play, targets stretch as high as $250K by year-end, and some ultra-bullish scenarios envision even $500K+ over a longer time horizon.
⚠️ Key Risks to Watch
Breakdowns below $115K could trigger a deeper correction toward $112K–$110K.
Volatility spikes may occur if macroeconomic factors shift, even as regulatory clarity improves.
Caution from macro critics: Some thought leaders warn of bubble-like conditions, advising risk management.
✅ Summary
Bitcoin remains in a strong bull phase. Today's dip is healthy consolidation after reaching all-time highs. Key support sits between $115K–$118K. A sustained bounce from here could drive a move to $120K–$140K, potentially even higher if institutional flows stay strong. However, a breakdown below that support zone would flip the outlook to neutral or slightly bearish.

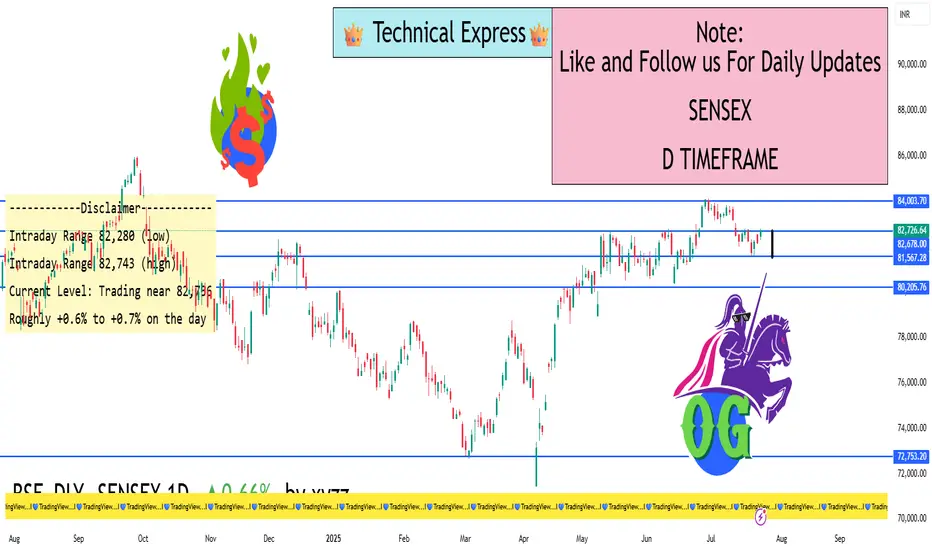
SENSEX 1D TIMEFRAME🧾 Basic Market Overview
Open: ~80,135
High: ~80,177
Low: ~79,513
Close: ~79,698
Net Change: Down by approximately -437 points or -0.55%
The SENSEX index opened slightly positive today but faced strong resistance near the 80,200 level and then reversed sharply during the session. It closed lower than the opening, indicating bearish pressure.
🕯️ Candlestick Analysis
Today’s candlestick is bearish, forming something close to a bearish engulfing or long red candle. It:
Opened higher than yesterday’s close
Rejected higher levels
Closed near the bottom of the day’s range
This suggests supply pressure and profit-booking near the all-time high zone.
📈 Trend & Structure
Short-Term: Weakening; showing signs of reversal
Medium-Term: Still bullish, but cautious near highs
Long-Term: Uptrend still intact (higher highs and higher lows)
The index is currently facing a resistance zone around 80,200–80,300. This is a psychological and technical barrier.
📌 Sector-wise Observation
Banks (ICICI, HDFC Bank): Weak today; contributed to downside
Reliance: Also showed weakness; contributed to fall
IT Sector: Mixed performance; Infosys held flat
FMCG and Pharma: Stable or slightly positive
Major drag came from financials and heavyweight Reliance.
📉 Price Action Summary
SENSEX failed to hold above 80,000, showing resistance
Sellers active at higher levels
First signs of minor distribution phase near the top
May now move into short-term correction or consolidation
🔮 Possible Scenarios Ahead
✅ Bullish Case:
If Sensex can reclaim and hold above 80,200, a breakout rally toward 80,800–81,000 is possible
⚠️ Bearish Case:
If it breaks below 79,400, the index could fall to 78,800, which is the 20-day moving average and prior swing support
🔄 Consolidation Case:
If it trades between 79,400–80,200 for a few days, it would be in a range-bound phase, waiting for new cues
🧠 Strategy Suggestions
Intraday Traders: Look for reversals near support/resistance. Volatility likely near 79,500 and 80,200.
Swing Traders: Avoid fresh long positions until SENSEX closes above 80,300. Short only below 79,400.
Investors: Trend is healthy but wait for a correction before adding large-cap positions.
✅ Conclusion
SENSEX on July 23, 2025, showed clear signs of resistance at 80,200 and closed lower. Although the broader trend remains intact, today’s action hints at short-term profit booking and potential consolidation.
Be watchful of the 79,400–79,500 support zone tomorrow. A break below this could trigger further weakness, while holding above it could stabilize the index.
NIFTY 1D TIMEFRAME🟢 Market Overview
Current Status: Nifty 50 opened with strength today, showing positive momentum.
Previous Close: Around 25,123
Today’s Opening: Roughly +60 to +90 points higher, showing bullish intent
Intraday Range: Between 25,100 (Low) and 25,290 (High)
Current Price (as of late afternoon): Trading around 25,270 to 25,285, indicating a +0.6% to +0.7% gain
🔍 Technical Structure
📈 Trend:
Nifty remains in a bullish trend on the daily chart. Price is holding above 21-EMA and 50-EMA, a sign of strength. The recent breakout above 25,100 confirms bullish continuation.
💹 Candlestick Pattern:
The current candle is forming a strong green bar with minor upper wick – indicating buyers are in control.
Past few candles show a rising channel or ascending triangle, suggesting higher highs and higher lows.
📊 Key Technical Levels
Level Type Price Zone Description
🔼 Resistance 25,300 – 25,350 Immediate resistance zone
🔽 Support 25,050 – 25,100 Strong support (breakout retest area)
📉 Deeper Support 24,800 – 24,900 Demand zone if correction happens
🔁 Indicators Summary
RSI (Relative Strength Index): Around 65–68, in bullish territory but not overbought
MACD: Positive crossover still active, supporting bullish momentum
Volume: Healthy volume on green days, slightly higher than red days — bullish sign
🧠 Price Action Summary
Nifty broke out from a consolidation range between 24,800–25,100
The breakout is holding above the resistance now turned into support, showing market strength
No major reversal patterns spotted yet – trend is intact unless we see heavy selling with volume
🔮 Possible Scenarios
✅ Bullish Case
If Nifty breaks above 25,300, expect move toward 25,450 – 25,500 in coming days
Strength in banking, IT, and auto sectors support this view
⚠️ Bearish Case (Short-Term Only)
If it closes below 25,100, could test 24,800 in short term
Watch for sudden global triggers or heavy profit booking
📦 Sector Performance Overview
🔋 Strong: Banking, Auto, FMCG
🛑 Weak/Flat: Realty, Pharma, Metal
📝 Expert Notes
Institutional buying seen in index-heavyweights like HDFC Bank, Reliance, and TCS
FIIs (Foreign Institutional Investors) have shown net buying in the last two sessions
Market breadth is positive – more stocks advancing than declining
📌 Conclusion
Nifty 50 is showing strong bullish momentum on the 1D chart. Unless we see a sudden breakdown below 25,100, the trend remains positive. A breakout above 25,300 will add more fuel to the rally, possibly pushing the index toward 25,500+ in the coming sessions.
Ideal strategy: Buy on dips near 25,100–25,150 with a stop loss below 25,000 and upside targets of 25,300–25,500.

Trading Master Class With Experts🔰 Introduction
In today’s fast-moving financial markets, trading has evolved from basic buying and selling to data-driven strategies, advanced analysis, and systematic execution. A Trading Master Class With Experts is not just another course—it’s a comprehensive mentorship program that bridges the gap between beginner-level knowledge and professional-level performance.
This class is designed for those who are serious about trading as a skill, business, or career, and who want to learn directly from experienced traders, analysts, and market strategists. The program focuses on real-time learning, practical strategies, market psychology, and risk management, giving participants the tools to trade confidently and consistently.
🎯 Objective of the Master Class
The primary goal of the Trading Master Class With Experts is to transform retail traders into independent, strategy-based professionals. It’s structured to help you:
Understand how markets really work
Learn proven strategies from professional traders
Avoid common beginner mistakes
Build and test your own trading system
Develop the mindset and discipline of institutional-level traders
🧠 What You Will Learn
This master class covers a holistic approach to trading with a strong focus on practical execution, including:
🔍 1. Market Basics & Trader Foundation
How stock markets work
Key players: Retail vs Institutions
Types of markets: Bullish, Bearish, Sideways
Trading styles: Intraday, Swing, Positional, Scalping
Asset types: Equity, Derivatives, Forex, Crypto, Commodities
🕯️ 2. Technical Analysis
Reading and analyzing candlestick patterns
Support and Resistance theory
Trend identification and trendline accuracy
Price Action-based entry and exit techniques
Volume analysis and institutional behavior spotting
📊 3. Indicators and Tools
Moving Averages (SMA, EMA)
RSI, MACD, Bollinger Bands, Supertrend
Fibonacci retracement and projection
Volume Profile and VWAP
How to avoid indicator overloading
🧱 4. Chart Patterns & Setups
Reversal patterns: Double Top/Bottom, Head and Shoulders
Continuation patterns: Flags, Pennants, Triangles
Breakout trading vs Pullback trading
Building entry/exit rules with confirmation signals
🧮 5. Options and Futures Trading (Optional Module)
Understanding Calls and Puts
Option chain analysis and Open Interest
Option Greeks (Delta, Theta, Vega, Gamma)
Directional vs Non-directional option strategies
Institutional Option Trading Techniques
💹 6. Risk Management
Capital allocation methods
Risk-to-reward ratio and win-rate planning
Stop-loss and trailing stop methods
Diversification and exposure control
Avoiding overtrading and emotional decisions
🧘 7. Trading Psychology & Discipline
How to handle losses without fear
Dealing with greed and overconfidence
Mindset of a consistent trader
Journaling, post-trade analysis, and routine building
💻 8. Live Trading & Practical Learning
Real-time market sessions with expert commentary
Watching experts plan, execute, and review trades
Hands-on assignments and trade simulations
Market opening/closing routines
Building your personal trading plan
🔧 Advanced Topics (for Experienced Traders)
Institutional Trading Strategies
Smart Money Concepts
Volume Spread Analysis (VSA)
Multi-leg Option Strategies
Algo-trading basics (optional)
Trading Journals and performance analysis tools
👨🏫 Who Are the Experts?
This master class is conducted by a team of seasoned professionals:
Full-time traders with 10+ years of market experience
Certified technical analysts and SEBI-registered mentors
Option strategists and quantitative traders
Risk managers and trading psychologists
They provide you with:
Live mentorship
Real trade breakdowns
Direct Q&A sessions
Feedback on your trading plans
👥 Who Should Join This Master Class?
This program is ideal for:
Aspiring traders who want to start with clarity
Traders stuck at breakeven or in losses
Professionals looking to become part-time traders
Students or working individuals with serious interest in trading
Anyone who wants to trade like an institution, not a gambler
📜 Certification & Support
Upon completion, you will receive:
A certificate of participation
Access to recorded sessions
A trading toolkit: Checklists, planners, and journals
Lifetime access to community/mentorship group
🧭 Final Words
A Trading Master Class With Experts is not about shortcuts or tips. It’s a structured pathway to build you into a professional-level trader who understands risk, follows a system, and survives long-term.
Markets will always test you—but this master class gives you the skills, mindset, and mentorship to pass every test with confidence.

Technical ClassA Technical Class for Trading is a structured learning program that helps aspiring traders understand how to analyze financial markets using technical analysis. Unlike guessing market movements or relying on news, technical analysis is a science of price behavior, built on charts, patterns, indicators, and market psychology. This class is essential for anyone who wants to become a self-reliant trader in stocks, options, futures, forex, or crypto.
✅ What You Learn in a Technical Trading Class
A good technical trading class teaches how to analyze price action, spot trading opportunities, and apply disciplined risk management. Here’s what’s typically covered:
📈 1. Introduction to Technical Analysis
What is Technical Analysis?
Difference between Technical and Fundamental Analysis
Importance of studying price action and volume
Types of traders: Day Trader, Swing Trader, Positional Trader, Scalper
🕯️ 2. Candlestick Chart Reading
Candlestick charts tell stories of price movement and trader psychology.
You'll learn:
Structure of a candlestick (open, high, low, close)
Key single candlestick patterns (Hammer, Doji, Marubozu)
Dual & triple patterns (Engulfing, Morning Star, Evening Star)
How to use candles to detect reversals or continuations
📊 3. Chart Types and Timeframes
Line chart vs Bar chart vs Candlestick chart
Timeframe selection for different trading styles:
Intraday (5 min, 15 min)
Swing (1 hour, 4 hour)
Positional (Daily, Weekly)
📌 4. Support and Resistance
What are support and resistance levels?
How to identify major levels using price action
Role of psychological round numbers
Breakouts and false breakouts
How to use them for entry, exit, and stop-loss
📉 5. Trend Analysis
Understanding the direction of the market is critical.
You will learn:
How to spot uptrends, downtrends, and sideways markets
How to draw trendlines correctly
Using price structure: Higher Highs / Higher Lows
Tools like Moving Averages to confirm trends
📐 6. Chart Patterns
Chart patterns help forecast future moves.
Key patterns covered:
Reversal Patterns: Head & Shoulders, Double Top/Bottom
Continuation Patterns: Flags, Pennants, Triangles
Breakout strategies and volume confirmation
⚙️ 7. Technical Indicators
Indicators help confirm entries and manage trades.
Most-used indicators:
Moving Averages (SMA/EMA)
Relative Strength Index (RSI)
MACD (Moving Average Convergence Divergence)
Bollinger Bands
Volume analysis
How to combine indicators for smarter entries
⏳ 8. Time, Volume & Volatility
Importance of volume spikes
Volatility analysis for risk management
Understanding market sessions and timing your trades
🎯 9. Risk Management
This is where most traders fail. A technical class teaches:
How much to risk per trade (1–2%)
Risk-to-reward ratios
Where to place a stop-loss
How to avoid revenge trading
Capital preservation first, profit later
🧠 10. Trading Psychology
Handling emotions: Greed, Fear, Impatience
Importance of discipline and patience
Building confidence through planning
Developing a trading journal and sticking to rules
⚡ 11. Practical Strategy Building
The real power of a technical class lies in combining all the knowledge to build strategies:
Trend-following strategy
Reversal setups
Breakout/breakdown trades
Momentum-based trades
Intraday vs swing setups
📚 Benefits of Joining a Technical Class
Learn systematic trading instead of gambling
Avoid common beginner mistakes
Practice through live market examples
Prepare to move toward professional-level trading
Save time by learning from expert mentors
🔎 Who Should Take a Technical Class?
Aspiring full-time or part-time traders
Stock market beginners
Intraday traders, swing traders, or positional investors
Option traders who want to improve timing
Anyone who wants clarity and structure in their trading
📌 Final Thoughts
A Technical Class for Trading is not just about indicators and charts. It’s about learning a structured, rule-based approach to understanding the market. It empowers you to make trading decisions confidently and helps you grow from a beginner to a skilled, strategy-driven trader.
Whether you’re trading stocks, Bank Nifty, Nifty50, or even crypto — technical analysis is your foundation. Learn it well, practice with discipline, and your chances of success in the markets will dramatically improve.

Advance Option TradingKey Concepts in Advanced Options Trading
Multi-Leg Strategies:
Advanced options trading heavily involves multi-leg strategies — using two or more options contracts in a single trade. Popular ones include:
Iron Condor: A neutral strategy involving four different options contracts to profit from low volatility. It generates a limited profit if the stock remains within a specific range.
Straddles and Strangles: Used when expecting a large price move, but unsure of the direction. Traders buy both a call and a put option.
Butterfly Spreads: These limit both risk and reward and are ideal when the trader believes the stock will stay near a specific price.
Adjustments and Rolling:
Unlike basic options traders who may let contracts expire, advanced traders constantly adjust positions. For example, if a trade moves against them, they may "roll" the position — closing it and reopening another at a different strike or expiry.
Understanding Option Greeks:
Advanced traders don’t just bet on direction; they manage exposure to:
Delta (Direction)
Gamma (Rate of change of delta)
Theta (Time decay)
Vega (Volatility sensitivity)
Rho (Interest rate impact)
This helps in building more calculated, data-driven trades.
Volatility Trading:
Volatility is key in advanced options. Some traders look to exploit Implied Volatility (IV) — pricing of future volatility — by trading IV crush around earnings or economic events. For instance, an Iron Condor may be used when IV is high, aiming to profit from the IV drop.
Directional vs. Non-Directional Trading:
Advanced traders often prefer non-directional strategies. These are setups where you can make money even if the market goes sideways, such as with Iron Condors or Calendar Spreads.
Risks in Advanced Options Trading
While the rewards can be higher, so are the risks. Complex strategies can lead to significant losses if misunderstood. Margin requirements can be high, and some trades may have unlimited loss potential (e.g., uncovered calls). Hence, strict risk management, stop-loss rules, and position sizing are essential.
Final Thoughts
Advanced options trading is not for beginners, but for those who want to move beyond simply guessing market direction. It’s about constructing trades that work in various market conditions — bullish, bearish, or sideways — and using volatility and time as weapons. With the right knowledge and discipline, advanced options can become a powerful tool in any trader’s arsenal. However, success requires education, continuous learning, and a clear understanding of risk and reward

Institutional Trading StrategiesWhat is Institutional Trading?
Institutional trading means the buying and selling of stocks, futures, options, and other financial instruments by large organizations. These organizations are often:
Mutual Funds
Pension Funds
Hedge Funds
Banks and Insurance Companies
Foreign Institutional Investors (FII)
Domestic Institutional Investors (DII)
Unlike retail traders who trade with small amounts of capital, institutional players move huge sums of money, sometimes trading in crores or billions in a single day.
Why Do Institutions Trade Differently?
Institutions have massive capital, so their approach is completely different:
They can’t enter or exit a stock quickly without moving its price.
They focus more on long-term positions or large short-term trades.
They use advanced tools like algorithms, high-frequency trading, and exclusive market data.
In simple words: they trade like whales in the ocean, while retail traders are like small fish.
Core Institutional Trading Strategies Explained
1. Order Flow and Volume Analysis
Institutions often leave their footprint in the market by how much they buy or sell. This is visible through volume spikes and order flow. Retail traders can track this by:
Watching unusual volume on a stock
Monitoring delivery percentage (for cash segment)
Using indicators like VWAP (Volume Weighted Average Price) to see where large trades are happening
Institutions use volume as a key indicator because when big money flows in, prices generally follow.
2. Order Block and Supply-Demand Zones
Institutions don’t buy stocks in one go. They accumulate positions slowly within certain price ranges. These areas are called:
Order Blocks – zones where large buying or selling has happened in the past.
Supply-Demand Zones – areas where the market reacts due to prior institutional activity.
When price comes back to these zones, you will often see a strong bounce (demand) or rejection (supply).
3. Breakout and False Breakout Manipulation
Institutions are masters of manipulation. They often cause:
False Breakouts to trap retail traders.
Breakdown traps to collect positions cheaply.
You will see prices breaking key levels (like support or resistance), triggering retail stop losses, and then reversing sharply. Institutions use liquidity from these retail stop losses to enter or exit positions.
4. Volume Weighted Average Price (VWAP) Strategy
Most institutions benchmark their trades around VWAP.
When prices are above VWAP, the bias is bullish.
When prices are below VWAP, the bias is bearish.
Institutions often buy when price retraces to VWAP after a breakout and sell when it tests VWAP after a breakdown. VWAP acts like a fair value line for many large traders.
5. Liquidity Hunting and Stop Loss Fishing
Institutions need liquidity to place large orders. So they create fake moves:
Push prices higher to make retail buy, then sell into it.
Push prices lower to trigger retail stop-losses and then reverse the price upwards.
This is why retail traders often feel the market is “hitting my stop-loss and then moving in my direction”.
6. Options Data Analysis
Institutions hedge their cash and futures positions using options:
High Open Interest (OI) at certain strike prices indicates important levels.
Sudden OI build-up can show institutional call writing (bearish) or put writing (bullish).
Institutions use Option Selling strategies because time decay (theta) works in their favor.
Retail traders can track option data to understand institutional bias, especially around expiry.
7. Algorithmic Trading (Algo Trading)
Institutions use computers (algos) to execute trades based on pre-defined rules:
Speed: Algos trade in microseconds.
Precision: No emotions, just system-based entries and exits.
Scalability: Handles thousands of orders simultaneously.
You can’t compete with algos on speed, but you can follow the flow by watching patterns like sudden large candles without news or price bouncing off VWAP repeatedly.
8. Fundamental Catalysts Trading
Institutions also trade based on news, earnings, and economic data:
Positive quarterly results → gradual accumulation before the news
Interest rate changes → repositioning in banking stocks
Government policy changes → entering sectors like infrastructure or defense
They often buy early before the public knows and sell after retail traders start entering.
9. Sector Rotation Strategy
Institutions rotate money between sectors:
Moving from IT to Banks
From FMCG to Auto
From Metal to Pharma
Retail traders get stuck chasing one stock, while institutions follow where big sector money is flowing. You can track sector indices (like Nifty Bank, Nifty Auto) to ride these moves.
10. Index Balancing Strategy
In indices like Nifty 50 or Sensex, institutions adjust portfolios based on:
Index addition/removal
Rebalancing due to quarterly reviews
Passive fund flows
Stock prices often jump or fall sharply around these events, giving smart traders easy trading opportunities.
How to Identify Institutional Activity as a Retail Trader
Look for unusual volume spikes
Watch for rejection or breakout around order blocks
Use VWAP as a guidance tool
Track option chain data before key events
Follow sector rotation via index charts
Watch price-action near important news events
Practical Tips for Retail Traders
Trade less, trade better: Institutions don’t chase every small move, neither should you.
Wait for confirmation: Let institutions show their hand through volume before entering.
Avoid emotional trades: The market is designed to make you emotional — don’t fall for it.
Risk management is king: Institutions have risk teams; you must use stop-loss.
Never blindly follow tips: By the time you hear news, institutions are already in or out.
Why Institutional Strategies Work Better
Institutions follow a data-driven approach backed by:
Risk management policies
Trained analysts
Large capital to manage volatility
No emotional trading
Use of technology (Algos)
Retail traders who respect market structure and trade alongside institutions improve their win rate dramatically.
Final Thoughts
Institutional Trading is all about structure, discipline, and patience. It’s not about guessing but about observing market behavior — where are the big players active? Why is volume rising? Where is liquidity flowing?
You don’t need huge capital to benefit from institutional strategies. You simply need to follow the footprints, avoid traps, and focus on high-probability trades.
Global Factors Impacting Indian MarketsIntroduction
The Indian stock market, like any other major market, is deeply interconnected with global events. While domestic news like RBI policy, election results, or monsoons do influence our stocks, global factors often act as the real drivers behind sharp up-moves or crashes.
Whether you're an investor, trader, or analyst, understanding how global cues influence Nifty, Bank Nifty, Midcaps, and even commodities is essential for smart decision-making.
In this explanation, we’ll break down the major global factors, how they affect Indian markets, and what traders should watch daily and weekly.
1. U.S. Federal Reserve & Interest Rates (Fed Policy)
Why it matters:
The U.S. Federal Reserve’s interest rate decisions directly impact global liquidity. When the Fed raises rates, money becomes costlier. Foreign investors often pull out from emerging markets like India to invest in safer U.S. bonds.
Impact on India:
Rising U.S. interest rates = FII selling in India
Weakens rupee, inflates import costs (e.g., crude oil)
Tech & high-growth sectors take a hit (especially those sensitive to valuations)
2. Crude Oil Prices
India is a major oil importer—more than 80% of our crude is imported. Crude price volatility has massive ripple effects across inflation, currency, fiscal deficit, and stock market sectors.
Impact on India:
High crude = inflation + weak rupee + fiscal stress
Negatively affects oil-dependent sectors like aviation, paints, logistics, autos
Boosts oil marketing companies' revenue (but hits margins if subsidies increase)
Example:
If Brent Crude moves from $70 to $95 in a month, expect:
Nifty to correct
INR to weaken vs USD
Stocks like Indigo, Asian Paints, Maruti to face pressure
💰 3. Foreign Institutional Investors (FII) Flow
FIIs bring in billions of dollars into Indian equity and debt markets. Their buying or selling behavior is often influenced by:
Global risk appetite
Currency trends
Interest rate differentials
Geopolitical tensions
When do FIIs sell?
When the dollar strengthens
When there’s fear in global markets (e.g., war, U.S. recession)
When India underperforms vs peers
When do FIIs buy?
When global liquidity is high
India shows growth resilience vs China or other EMs
Post-election clarity, reform hopes, etc.
Daily Tip:
Watch FII cash market activity—daily inflows/outflows often decide Nifty’s intraday trend.
🏦 4. U.S. Economic Data (CPI, Jobs, GDP, PCE)
Every month, the U.S. releases:
CPI (inflation data)
Jobs Report (NFP)
GDP numbers
PCE (Personal Consumption Expenditures)
These influence Fed decisions, hence impacting global markets.
Example:
A hot U.S. inflation print → Fear of more rate hikes → Nasdaq crashes → Nifty follows
A weak U.S. jobs report → Rate cut hopes → Global rally → Bank Nifty surges
Keep an eye on U.S. calendar events, especially the first Friday of every month (NFP Jobs) and mid-month (CPI release).
🌏 5. Geopolitical Tensions & Wars
Markets hate uncertainty. Global conflicts often lead to panic selling, flight to safety, and surge in gold/crude prices.
Key global risk zones:
Russia-Ukraine
Middle East (Israel-Iran, Saudi-Yemen)
China-Taiwan-U.S. tensions
Impact on India:
Spike in gold and crude
Selloff in equity markets
Rise in defensive sectors (FMCG, Pharma, IT)
Surge in defence stocks (BEL, HAL, BDL)
💱 6. Dollar Index (DXY) & USD-INR Movement
The Dollar Index (DXY) measures the dollar's strength vs other currencies.
Rising DXY = Stronger dollar = FII outflows from India = Nifty weakens
Falling DXY = More risk-on = Money flows into emerging markets = Nifty rallies
Rupee’s role:
A weak INR/USD makes imports costly → impacts inflation
A strong INR/USD helps improve trade balance → attracts investors
💹 7. Global Equity Markets (Dow Jones, Nasdaq, Asian Peers)
The Indian market is heavily influenced by:
Dow Jones, Nasdaq (overnight sentiment)
SGX/GIFT Nifty (pre-market cues)
Asian Markets (Nikkei, Hang Seng, Shanghai)
How it affects us:
Strong global cues = Nifty opens gap-up
Weak Nasdaq = IT stocks sell off at open
Mixed Asian markets = Rangebound Nifty till clarity
Pro Tip: Always check Nasdaq futures and GIFT Nifty levels before the market opens.
🧭 8. China’s Economic Health
As a large global player in manufacturing, China’s growth (or lack of it) sends signals across the world.
If China slows down:
Commodities fall (good for India)
Asian currencies weaken
Global markets get jittery
If China shows strong stimulus:
Metal stocks rally globally (Tata Steel, Hindalco benefit)
Global optimism lifts all EMs
🏦 9. Global Banking or Financial Crises
Remember the Silicon Valley Bank collapse (2023)? Or the 2008 Lehman crisis?
Global financial stress always triggers:
A sell-off in Indian banks
Panic across all indices
Shift toward safe havens (gold, USD)
Traders should monitor:
Global bond yields
Credit Default Swaps (CDS spreads rising = trouble)
Bank stress signals in Europe/U.S.
🌾 10. Global Commodity Cycles (Metals, Energy, Agri)
India, being resource-dependent, reacts to global commodity moves.
Rally in metals = Tata Steel, Hindalco, JSW Steel surge
Rally in coal, oil = Uptrend in ONGC, Coal India, Oil India
Rally in agri = FMCG and consumer food stocks affected
Keep a watch on:
LME (London Metal Exchange) prices
Global wheat/rice/cocoa/sugar trends
🛑 Final Thoughts
Global factors are not just background noise. They are active triggers that move Indian markets every single day.
A smart trader or investor should:
Track global cues as seriously as domestic ones
Prepare for overnight risks using hedges or stop losses
Read market behavior through global context, not just stock-level news
By staying connected to the world, you can stay one step ahead of the market.

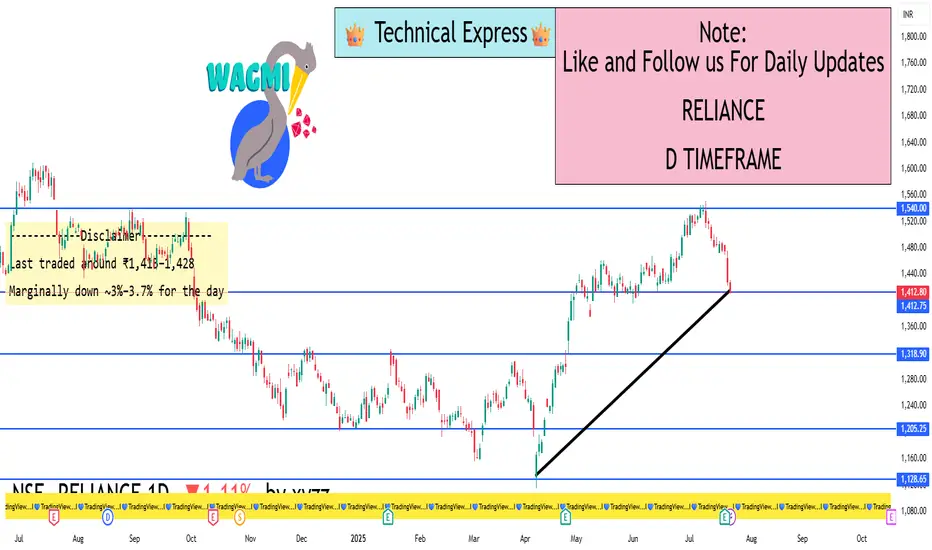
Reliance 1D Timeframe📊 Reliance Industries – Intraday Overview
Previous Close: ₹1,428.6
Opening Price: Opened slightly lower around ₹1,427–₹1,431.
Intraday High: Approximately ₹1,432 during early session.
Intraday Low: Dropped towards ₹1,410 during the mid-session.
Current Trading Price: Trading near ₹1,415, showing around 0.9% to 1% decline from the previous close.
🔍 Key Reasons for Movement Today
Post-Earnings Pressure: After recent earnings, Reliance faced profit booking as some investors booked gains following a previous rally.
Sector Weakness: Energy and telecom segments showed subdued strength while retail remained flat.
Heavy Volume: Trading volume remained above average, suggesting active participation from institutions and retail traders.
📈 Technical Snapshot
Immediate Support Zone: ₹1,410–₹1,412. If this breaks, next support could be near ₹1,400.
Immediate Resistance Zone: ₹1,430–₹1,432. A breakout above this may lead towards ₹1,440–₹1,450.
Trend Positioning: Reliance is currently below its short-term (20-day) moving average, indicating mild short-term weakness but no major breakdown.
💡 Intraday Strategy Levels
Scenario Trigger Point Expected Move
Bullish Reversal Above ₹1,432 Potential upside towards ₹1,445–₹1,450
Neutral/Bearish Between ₹1,410–₹1,430 Consolidation zone with limited moves
Breakdown Risk Below ₹1,410 Could slide to ₹1,400 or even ₹1,390 short-term
✅ Summary Conclusion
Reliance is trading with a mild negative bias, with price action holding between ₹1,410–₹1,432. The overall short-term structure remains weak after intraday profit booking, but key support is holding near ₹1,410. Watch for recovery above ₹1,432 for any bullish reversal or break below ₹1,410 for further downside.
Trade Like Istitution💡 What It Means to Trade Like Institution
✅ You analyze the market like a pro, focusing on price action and key liquidity areas.
✅ You avoid retail traps like false breakouts and late entries.
✅ You follow smart money flow, using higher timeframes for bias and lower timeframes for precision entries.
✅ You target high-probability zones, not random entry signals.
🟣 Core Institutional Trading Concepts
1. Liquidity Hunting
Institutions know where most traders place stop-losses — above recent highs and below recent lows. They:
Push the price to grab liquidity,
Then reverse the market to their original direction.
2. Order Block Theory
An Order Block (OB) is the last bullish or bearish candle before a major move.
Institutions leave footprints at these points:
Bullish Order Block = Entry zone for long trades.
Bearish Order Block = Entry zone for short trades.
3. Market Structure
Smart money never trades randomly. Institutions:
Trade with the trend: identifying Break of Structure (BOS).
Change bias when Change of Character (CHOCH) happens.
Always trade in alignment with market structure.
4. Fair Value Gaps (FVG)
When price moves rapidly, it leaves imbalances on the chart (FVG zones). Institutions often come back to fill these gaps before continuing.
🎁 Trade Like Institution – Step-by-Step Method
Step 1: Mark Higher Timeframe Zones
Use 4H or Daily timeframe to identify major order blocks and liquidity zones.
Step 2: Track Liquidity
Look for equal highs/lows (liquidity build-up).
Wait for liquidity grabs before entering.
Step 3: Look for Break of Structure (BOS)
After liquidity is grabbed, wait for a market structure shift (BOS or CHOCH).
Step 4: Refine Entries on Lower Timeframes
Drop to 5min or 15min timeframe.
Wait for clean entry at order block or FVG, with a small stop loss.
Step 5: Manage Risk Like Institutions
Risk 1-2% per trade maximum.
Target 2:1, 3:1, or more, but exit partially at key liquidity zones.
📝 Institutional Trading Mindset
✅ Patience is Power: Institutions wait for price to come to them.
✅ Quality over Quantity: Few high-probability trades, not dozens of small trades.
✅ Risk Management First: Protect capital like a professional fund.
✅ Follow the Smart Money Flow, never the crowd.
🧩 Example Institutional Trade Setup (Simple):
✅ Timeframe: 4H for direction, 15min for entry.
✅ Mark Daily Order Block → Wait for liquidity grab.
✅ Wait for CHOCH on 15min → Enter after FVG fill.
✅ SL below OB → Target last high (RR 1:3).

Learn Institutional Trading💡 What Does “Learn Institutional Trading” Mean?
When you learn institutional trading, you focus on:
Smart Money Behavior — How institutions think and trade.
Market Manipulation — How the big players create fake moves to trick small traders.
Liquidity Zones — Areas where institutions enter or exit trades.
Order Blocks, Breaker Blocks, Fair Value Gaps — Special price zones where banks place their orders.
Higher Time Frame Analysis — Institutions trade on bigger time frames like 4H, Daily, and Weekly.
🎁 Why Learn Institutional Trading?
✅ Understand why price moves before big news.
✅ Learn where to enter trades with high accuracy.
✅ Trade with peace of mind by following market logic, not emotions.
✅ Get consistent profits by following smart money footprints.
🔥 Key Topics to Learn in Institutional Trading
1. Market Structure
Learn how the price moves in trends: Higher Highs, Higher Lows (Uptrend) and Lower Highs, Lower Lows (Downtrend).
Identify key swing points used by big traders.
2. Liquidity Concepts
Price always goes where liquidity is (stop-loss clusters, pending orders).
Learn about liquidity grabs, stop hunts, and false breakouts.
3. Order Blocks
The secret zones where institutions enter trades.
Once you spot order blocks, you can trade before the market moves big.
4. Fair Value Gap (FVG)
Price always returns to imbalance zones where few trades happened.
Learn to trade the gap fills with high accuracy.
5. Entry Techniques
Learn how to enter using Break of Structure (BOS) or Change of Character (CHOCH).
Use confirmation entries on lower time frames (5min, 15min) after spotting order blocks on higher time frames (4H, Daily)
🧩 Tools You Need to Learn Institutional Trading
✅ TradingView — For chart analysis.
✅ Forex Factory — For news events and market sessions.
✅ SMC Indicators — Some free, some paid tools available for order block marking.
✅ YouTube or Paid Courses — Channels like Mentfx, ICT (Inner Circle Trader), etc.
✅ Trading Journal — To track every trade and improve.
📊 Example Setup (Simple Explanation):
Timeframe: Daily chart for order block → 15min chart for entry.
Step 1: Spot Order Block on Daily.
Step 2: Wait for Liquidity Grab.
Step 3: Wait for CHOCH on 15min.
Step 4: Enter trade with SL below OB → Target previous high/low.
📝 Conclusion:
Learning Institutional Trading = Trading Smart Money Way
This method teaches you to follow the banks and big traders — not get trapped by them. Mastering these skills takes time and practice, but it transforms you from a random gambler into a professional trader.

Master Institutional Trading What is Institutional Trading?
Institutional trading involves market participation by major financial organizations that trade massive volumes of stocks, forex, commodities, or derivatives. Their trades are usually well-planned, research-driven, and executed with precision to avoid large price movements during entries and exits.
Institutions have:
Access to insider research.
Priority order execution.
Advanced algorithmic trading tools.
Huge capital, which can shift market directions.
Retail traders, in contrast, often lack these tools and operate with limited funds. However, by mastering institutional trading concepts, a retail trader can "follow the smart money" and make better, more informed trades.
🎯 Key Concepts in Master Institutional Trading
1. Market Structure
Institutional traders rely heavily on market structure — identifying how price moves in trends, ranges, and key swing points.
Higher Highs & Higher Lows in uptrends.
Lower Highs & Lower Lows in downtrends.
Liquidity zones where institutions place orders.
2. Order Blocks
Order blocks are areas on the chart where institutions have placed large buy or sell orders. These blocks often act as strong support or resistance zones where price reacts heavily.
Bullish Order Block: A zone of institutional buying.
Bearish Order Block: A zone of institutional selling.
3. Liquidity Grabs & Stop Hunts
Institutions often "hunt liquidity" by pushing the price to take out retail stop-losses before moving in the desired direction.
Stop Loss Liquidity: Targeting areas where many traders have their stops placed.
Fakeouts & Traps: Creating false breakouts to capture liquidity.
4. Imbalances / Fair Value Gaps
After strong institutional moves, price often leaves imbalances (gaps) in the market where few or no trades occur. Institutions usually revisit these gaps to "fill" them before continuing the trend.
5. Smart Money Concepts
This strategy focuses on aligning your trades with institutional activity using:
Internal/External Liquidity
Premium/Discount Pricing
High Timeframe Bias
Refined Entry Models
✅ Benefits of Mastering Institutional Trading
Trade with the Market Movers instead of against them.
Higher Accuracy, fewer fakeouts.
Better Risk Management, learning how and where institutions place their stops.
Improved Patience & Discipline, by following smart money footprints.
🚀 Popular Institutional Trading Tools
TradingView for clean charts and liquidity mapping.
MT4/MT5 with SMC indicators.
Volume Profile to see where high-volume trades occur.
Order Flow Tools (more advanced) to analyze order book data.
📝 Final Thoughts
Mastering Institutional Trading is not about copying a magic strategy but learning how the market truly operates from a smart money perspective. It requires patience, backtesting, and constant observation of market behavior. Once you align yourself with institutional flows, your win rate and consistency can dramatically improve.

HERO MOTOCORP LTD. ----- Deep AnalysisHERO MOTOCORP Ltd.--- High Probability Reversal Setup based on (Power of 3) concept of ICT Strategies.
Timeframe - Daily
Current Price -- 4396
Projection -- High Probability Reversal Setup after Manipulation phase.
Price Action Overview ---
Stock is currently Respecting higher time frame Orderblock just after Accumulating Liquidity in its sideways Range.
Orderblock Zone -- 4390-4500
In retailers term, It is rejecting upside Resistance or Orderflow zone of 4380-4500 Levels.
Liquidity & POI Zone --
Immediate Liquidity is resting in orderblock zone of 4400-4500
Volume Imbalance ---
Downside Unmitigated Liquidity is resting in Volume Imbalance zone of 3800-3920 Levels.
RSI ---
1st Divergence observed at bottom From March to April period which showed bullishness and market moved upside.
2nd Divergence observed at Upside from 20 may to Mid july period which now shows bearishness and market likely downside.
Final Projection for 2-3 months View -----
Main Target (High Probability)
-- Price likely to grab Orderblock Liquidity (4390-4480) to manipulate retailers.
-- After rejection and Clear Market structure shift on lower time frame, Entry module will be confirmed.
-- From entry Module a Sell position expected towards downside Volume Imbalance zone as marked as Distribution.
-- Entry Module --- In the Orderblock zone price levels (4390-4480)
-- Target projection --- Volume Imbalance Zone (3850-3930)
-- Exit Area --- If stock continue going upside without giving any market sturcutre shift then avoid above 4600.
This setup is just reflecting the POWER OF 3 Concepts -- Accumulation >>>>>> Manipulation >>>>>> Distribution.
it means that first stock accumulates large liquidity and then gives a fakeout or false breakout before giving huge opposite move.
Traders or Investors views or comments are most welcome.
[Disclaimer --- This setup is made just for Educational purpose onlu. Dont consider it as any Investment Idea.
Consult Your Financial Advisor before any investment.)
Regards,
Hit_Analyst
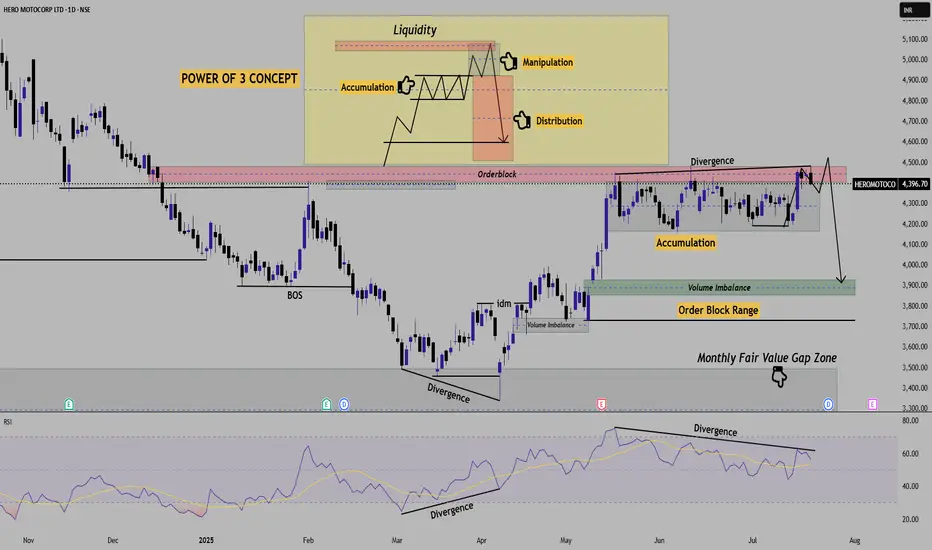
Learn Institutional Trading Part-8✅ What is the Trading Master Class?
The Trading Master Class with Experts is a comprehensive and interactive program where seasoned market professionals share their knowledge, trading systems, and live market experience. It’s not just about theory — it's about real techniques that work in today’s volatile and highly manipulated markets.
You’ll learn:
How institutions really move the markets
When and why price reverses (not just where)
How to build your own strategy with risk management
Live chart reading and trade planning with expert commentary
🧠 What You’ll Learn in the Master Class
1. Market Basics to Advanced Concepts
Understand price action, market structure, order flow, and key indicators. Move from beginner to strategic thinker.
2. Smart Money Concepts
Learn how hedge funds and institutions trade. Understand concepts like:
Order Blocks
Liquidity Zones
Fair Value Gaps
Trap Moves & Stop Hunts
3. Live Market Analysis
Watch experts break down charts in real-time. Learn how they spot opportunities, manage risk, and plan entries/exits.
4. Risk Management & Trading Psychology
Know how much to risk, where to place stop-losses, and how to stay disciplined. Learn how pros control emotions and trade with confidence.
5. Strategy Building
You won’t just follow someone else’s setup — you’ll learn how to build your own based on logic and data, not guesswork.
👨🏫 Why Learn From Experts?
Books and free videos can only take you so far. Expert traders bring:
Years of market experience
Real trade breakdowns with proof
Live Q&A support
Mentorship that corrects your mistakes
You get access to tested methods, real examples, and market insight that’s hard to find elsewhere.
🚀 Who Should Join?
New traders wanting proper guidance
Retail traders tired of inconsistent results
Intermediate traders wanting to go pro
Investors looking to add short-term income through trading
🎯 Final Thought
Success in trading doesn’t come from signals, hype, or luck — it comes from education, mentorship, and practice. The Trading Master Class with Experts gives you a shortcut to years of trial-and-error by putting you in direct contact with those who have already mastered the craft.
Join the master class, learn from the best, and take your trading journey to the next level.
