High-Probability Scalping Techniques🔍 What Is Scalping?
Scalping is a fast-paced intraday trading style where traders aim to take multiple small profits throughout the trading day. Instead of holding trades for hours or days, scalpers may be in and out of trades within minutes or even seconds.
Scalping is all about:
Quick entries and exits
High accuracy
Controlled risk
Small but frequent gains
The core idea? “Many small wins add up to a big win.”
Scalping works best in liquid markets, like Nifty, Bank Nifty, large-cap stocks, or high-volume futures and options.
💡 Why Do Traders Choose Scalping?
Scalping is perfect for traders who:
Have limited capital but want to grow it steadily
Prefer not to hold positions overnight (no gap-up/gap-down risk)
Love short-term action and decision-making
Want to trade professionally in 1-2 hours daily
Also, scalping can reduce your exposure to market news, global events, or overnight uncertainty.
But remember: scalping isn’t easy. It’s a skill. You need discipline, speed, and a proven strategy.
🎯 Key Characteristics of High-Probability Scalping
To make scalping successful, your strategy must include:
Factor Requirement
Speed Fast entries and exits with minimal slippage
Liquidity Trade only stocks/indexes with high volume
Precision Narrow stop losses, clear targets
Discipline No emotions, stick to plan
Risk Management Small risk per trade, compounding over time
🧠 Scalper's Mindset: Think Like a Sniper, Not a Machine Gunner
You’re not shooting randomly. You’re waiting patiently for high-probability opportunities where the odds are clearly in your favor.
Scalping is not about trading more—it’s about trading better.
🔧 Tools Every Scalper Needs
Before we dive into strategies, here’s what you must have in place:
Fast internet connection
Live market depth / Level 2 data
5-min, 1-min, and tick charts
Hotkeys for fast order placement
Broker with low brokerage per trade
Scalping involves dozens of trades per session, so costs matter!
🛠️ High-Probability Scalping Techniques (Explained in Human Language)
Let’s now explore some proven techniques that many experienced scalpers use.
🔹 1. VWAP Bounce Strategy
VWAP = Volume Weighted Average Price. It tells you the average price where most volume happened during the day.
📌 Concept:
In a trending market, price often bounces off VWAP before continuing the trend.
You trade that bounce.
✅ Rules:
Identify trend (price above VWAP = uptrend, below = downtrend)
Wait for a pullback to VWAP
Look for confirmation (like a bullish candle in uptrend)
Enter trade with tight SL below VWAP
Target = 0.5% to 1% move
🔍 Chart Timeframe:
1-minute or 5-minute candles
Ideal for: Nifty/Bank Nifty, Reliance, HDFC, SBIN, INFY
🔹 2. Opening Range Breakout (ORB)
This is a classic scalping setup used in the first 15–30 minutes of market open.
📌 Concept:
First 15-min range defines the initial battle between buyers/sellers.
Breakout from this range = strong momentum.
✅ Rules:
Mark high and low of 15-min candle from 9:15 to 9:30
Buy when price breaks above the high + volume rises
Sell when price breaks below the low + volume rises
SL = below/above opposite side of the range
Target = 1:1 or trail profit
💡 Tip:
Works best on trending news days or earnings release days.
🔹 3. Scalping Breakouts with Volume Confirmation
A breakout is only real if volume supports it. Otherwise, it’s a trap.
✅ Rules:
Use 5-minute chart
Identify consolidation (flat price action with narrow range)
Watch for breakout with spike in volume
Enter with SL just outside the range
Exit with a 1:1 or 1.5:1 risk-reward
🎯 Indicators:
Bollinger Bands tightening
Volume histogram
Price breaking upper/lower band
🔹 4. RSI Divergence Scalping
You can scalp reversal points using RSI divergence.
✅ Rules:
Use 5-min or 3-min chart
RSI near 70 or 30 signals overbought or oversold
If price makes higher high but RSI makes lower high → Bearish divergence
If price makes lower low but RSI makes higher low → Bullish divergence
Enter for quick reversal scalp
SL = recent swing high/low
Target = VWAP or recent pivot
🔹 5. News-Based Scalping
Scalping on earnings releases, news events, or market-moving headlines can be profitable—but risky.
✅ Approach:
Stick to high-volume large-cap stocks
Avoid holding more than a few minutes
Use Level 2 order book to watch supply/demand shifts
Trade the initial burst, exit quickly
📈 Ideal Indicators for Scalping
VWAP
RSI (5 or 14-period)
Bollinger Bands
EMA crossover (e.g., 8 EMA vs 21 EMA)
MACD (fast settings for short-term signals)
But remember: indicators are tools, not guarantees. Always combine them with price action and volume.
📉 Risk Management: The Scalper’s Shield
This part matters even more than the strategy itself.
Rule Explanation
Risk only 0.5% to 1% of capital per trade Protects you from wipeout on a bad day
Always have a stop-loss No SL = no survival
Don’t average losing trades You’re scalping, not investing
Exit on SL or target—no emotion Don’t hope, don’t pray
Track your win-rate Aim for 60%+ with 1:1 risk-reward
🧮 Sample Scalping Day Plan
Time Action
9:15–9:30 AM Watch first 15-min candle for ORB
9:30–11:00 AM Take 2-3 high-quality trades (VWAP bounce, RSI scalp)
11:00–2:00 PM Avoid choppy markets or only scalp consolidations
2:00–3:00 PM Look for afternoon breakouts
3:00–3:20 PM Avoid taking fresh trades, exit open ones
🔁 Scalping Checklist
Before you place any trade, ask yourself:
✅ Is the setup clear and backed by volume?
✅ Am I trading with the trend or against it?
✅ Is my SL defined and within risk limit?
✅ Am I emotionally calm and focused?
✅ Is this a high-probability or random trade?
📊 Example of a High-Probability Scalping Trade
Stock: Reliance
Chart: 1-min
Setup: VWAP bounce + bullish engulfing candle
Entry: ₹2,950
Stop-Loss: ₹2,944
Target: ₹2,958
Result: Profit of ₹8 per share in 3 minutes
This may look small—but scalpers do 5–10 such trades a day, scaling with quantity.
🚨 Common Mistakes to Avoid
❌ Overtrading (more is not better)
❌ No plan or random entries
❌ Chasing trades late
❌ Holding scalps like swing trades
❌ Trading during news without preparation
❌ Ignoring transaction costs
🧾 Final Words: Is Scalping Right for You?
Scalping is not for everyone. It requires:
High focus and speed
Strong discipline
Quick decision-making
Excellent risk control
But if you develop the skill, it can provide:
Daily consistency
Limited overnight risk
Quick compounding
Full control over trades
✅ Start small.
✅ Practice on paper or low quantity.
✅ Use one strategy, track results, then scale up.
Sensex
Option Selling Strategies for Monthly Income📘 What is Option Selling?
In options trading, you have two parties:
Option Buyer – Pays premium to buy the right (but not obligation) to buy/sell a stock or index
Option Seller (Writer) – Receives that premium, but takes on the obligation to deliver, if the buyer exercises
📌 So, in option selling:
You earn premium upfront
Your profit comes if the option expires worthless
Time is your friend (theta decay helps you)
The odds of success are higher, but risk is theoretically unlimited (if not managed well)
🔧 Core Concepts You Must Know Before Selling Options
✅ 1. Time Decay (Theta)
Option prices fall as expiry nears (especially if OTM)
Sellers benefit because buyers lose value daily
✅ 2. Implied Volatility (IV)
Higher IV = Higher Premiums = Better for sellers
Sell when IV is high, buy when IV is low
✅ 3. Margin Requirement
You need sufficient funds (or collateral) to sell options
Brokers block margin depending on your strategy
✅ 4. Strike Price Selection
Selling options far away from current price reduces risk
Choose strikes based on support/resistance or option chain OI
📦 Top 4 Option Selling Strategies for Monthly Income
Let’s look at the most trusted, beginner-to-pro level strategies used for monthly income.
🔹 1. Covered Call – Best for Stock Investors
You own a stock and you sell a Call Option against it.
Generates income from stocks you already hold
You earn premium every month
If stock stays below strike → you keep stock + premium
If stock crosses strike → your stock may get sold (with profit)
Example:
You hold 1 lot of TCS (300 shares) at ₹3,600
Sell 3700CE for ₹40 premium
If TCS stays below ₹3700, you keep ₹12,000 premium (₹40 × 300)
✅ Low risk
✅ Good for long-term investors
🚫 Limited upside on stock
🔹 2. Cash-Secured Put (CSP) – Get Paid to Buy Stocks
You sell a Put Option for a stock you’re willing to buy at a lower price.
You collect premium
If stock falls below strike → You must buy it
You effectively get stock at discount
Example:
Sell 3600PE in TCS and collect ₹50 premium
If TCS closes above ₹3600, you keep the ₹15,000 premium
If TCS drops below ₹3600, you get to buy it—but at an effective price of ₹3550
✅ Ideal for long-term investors
✅ Safer than naked put selling
🚫 Requires full cash or margin
🔹 3. Short Strangle – Good for Range-Bound Market
You sell one Out-of-the-Money Call and one OTM Put.
Profit if the stock/index remains in a range
You earn premium from both sides
Risk if price moves too much either way
Example (Nifty at 24,000):
Sell 24200CE at ₹100 and 23800PE at ₹120
Total premium = ₹220 (₹11,000 per lot)
Max profit = ₹11,000 if Nifty stays between 23800 and 24200 till expiry
✅ High premium potential
🚫 Unlimited risk if market breaks range
✅ Can be hedged with far OTM buys
🔹 4. Iron Condor – Limited Risk, Limited Reward
This is an advanced version of strangle with protection.
Sell 1 OTM Call + 1 OTM Put
Buy 1 further OTM Call + 1 further OTM Put
You form a “box” where profit is limited, but losses are capped
Example (Nifty at 24000):
Sell 24200CE (₹100) + 23800PE (₹120)
Buy 24400CE (₹30) + 23600PE (₹40)
Total premium = ₹220 – ₹70 = ₹150
Max profit = ₹150 × 50 = ₹7,500
Max loss = ₹50 (difference in strikes – net credit)
✅ Great for peace of mind
✅ No unlimited risk
🚫 Less profit than naked strangle
📅 How to Use These Strategies for Monthly Income
🔄 Repeat Monthly:
Choose 1 or 2 strategies
Select stocks or index with high liquidity
Sell options 20–30 days before expiry
Exit before expiry (if needed) or let decay work
📌 Ideal Instruments:
Nifty / Bank Nifty
Liquid stocks: Reliance, HDFC Bank, Infosys, ICICI, TCS
🧠 Smart Practices:
Trade with capital you can afford to lock for a few weeks
Don’t sell options blindly – check news, IV, support/resistance
Use alerts or trailing stops
⚠️ Risks and How to Manage Them
Risk How to Handle
Unlimited Loss Use hedging (e.g., iron condor) or stop-losses
Sudden Market Moves Avoid during events (budget, elections, Fed)
Low Premium Don't sell too close to expiry with low reward
Margin Call Keep extra buffer; monitor exposure
Overtrading Stick to 1–2 good trades per expiry
✅ Final Thoughts
Option selling is not a get-rich-quick tool—but it’s a powerful way to generate stable income month after month, when done with patience, logic, and discipline.
You don’t need to be a genius—just:
Understand how premiums behave
Focus on low-risk, high-probability trades
Use hedges and stop-losses
Stick to tested rules
Track your performance and learn from mistakes
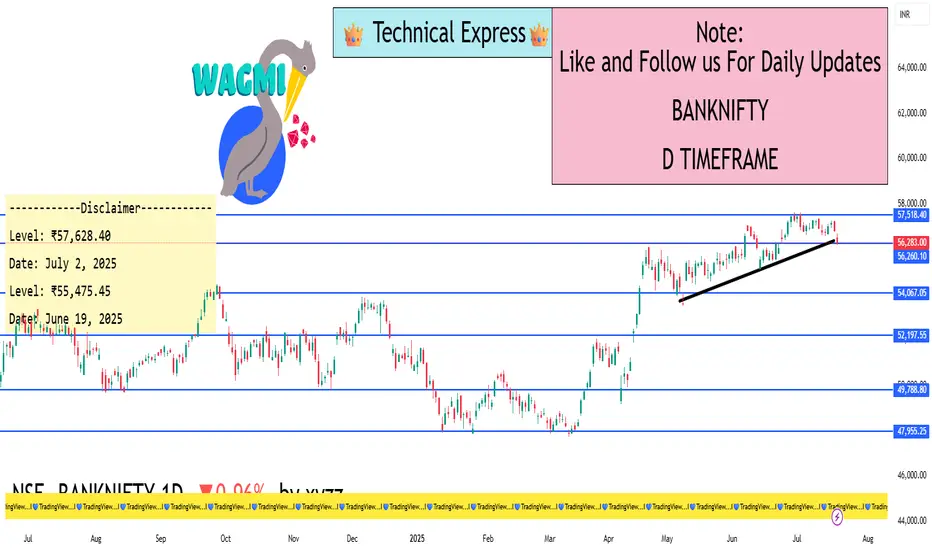
BANKNIFTY - 1D Timeframe📅 Current Market Status (as of July 18, 2025)
Closing Price: ₹56,283
Fall Today: –547 points (–0.96%)
Intraday Range: ₹56,205 (Low) to ₹56,849 (High)
52-Week Range: ₹43,199 (Low) to ₹57,817 (High)
2025 Performance So Far: Up around 9.5%
🧮 Moving Averages – All Are Negative
From 5-day to 200-day, all moving averages are giving SELL signals.
This confirms a strong downtrend.
Price is below every major moving average → means no strength for recovery yet.
📉 Support and Resistance Levels
Type Price Range
Support ₹55,800 – ₹56,000
Resistance ₹56,700 – ₹57,200
If the price falls below ₹55,800, we may see further fall toward ₹55,000.
For any upward trend to begin, Bank Nifty must close above ₹57,200.
⚠️ Market Mood – What’s Going On?
Strong Downtrend: Bears are in control; market is falling continuously.
High Volume on red candles: Big traders are selling heavily.
Oversold Condition: Market has fallen too much, may bounce a little.
High Volatility: Big movements (500–600+ points) can happen daily.
✅ Easy Summary
Overall Trend: Bearish (Downtrend)
Short-Term Possibility: Small upward bounce may come due to oversold indicators
But: No proper recovery signal until Bank Nifty moves above ₹57,200
Traders should be cautious – trend is still weak and selling pressure is high.
🔮 What to Watch Next?
RSI Above 35: Could be an early sign of recovery.
MACD Crossover: Needed for trend reversal.
Low Red Candle Volume: Means selling may be ending.
₹55,800 Support: If this breaks, further downside likely
Nifty 50 - 1D Timeframe📊 Nifty 50 – Daily Chart Overview (1D Timeframe)
Current Close (July 18): Around 24,968
Change: Down ~143 points (–0.57%)
Intraday Range: High ~25,145 | Low ~24,918
52‑Week Range: 21,744 to 26,277
YTD Performance: Approximately +5.6%
📈 Technical Indicators
RSI (14-day): ~32.5
This shows that the market is entering bearish territory, but not yet oversold.
MACD: Below signal line, value ~–67
A clear sell signal, confirming negative momentum.
Stochastic Oscillator: Above 98
Indicates that the index is overbought, and a correction may be due.
ADX (Average Directional Index): ~48
Signifies a strong trend—right now, it’s favoring bearish movement.
Other Oscillators (CCI, ROC, Ultimate): Mostly giving sell signals
🧠 Market Sentiment & Context
Nifty has been bearish for the third straight week
Trading is happening below the 20-day EMA, suggesting downward pressure
Overall tone is range-bound and lacking momentum due to:
Weak quarterly earnings
Foreign investor selling
Global market uncertainty
📉 Volatility & Risk Gauge
India VIX: ~11.2 to 11.4
This is the lowest in 15 months, signaling low market fear
Low VIX often means sideways consolidation and narrow movement
📊 Put-Call Ratio (PCR) & Options View
PCR (based on open interest): ~0.80
Indicates a bearish bias
More calls being written compared to puts
🏦 Bank Nifty Overview (for Comparison)
Close: ~56,283
Drop: ~1%
RSI: ~28 (Bearish)
MACD: Sell signal
Resistance: 57,200 – 57,600
Support: 56,300 – 55,800
Bank Nifty is also showing bearish momentum and mirrors Nifty’s structure.
📅 What to Watch Next
Corporate Q1 results – especially from large caps like Reliance, HDFC, ICICI
Global cues – US inflation, interest rate decisions, global markets
India VIX – If it spikes above 14–15, market fear might return
FIIs activity – Any strong buying/selling can swing the market
✅ Summary (Daily Timeframe)
Nifty is currently weak and range-bound
Key level to hold: 24,900
Key level to break: 25,250
Momentum is with sellers; cautious approach recommended
If no trigger appears, expect sideways movement or slow decline

Divergence Secrets✅ What is Divergence?
Divergence occurs when price action and an indicator (usually a momentum oscillator) move in opposite directions. This signals a disconnection between price and momentum, often happening before significant reversals.
Most Common Indicators Used:
RSI (Relative Strength Index)
MACD (Moving Average Convergence Divergence)
Stochastic Oscillator
CCI (Commodity Channel Index)
✅ Types of Divergence
1. Regular Divergence (Classic Divergence)
Bullish Divergence: Price makes lower lows, but the indicator makes higher lows → Suggests potential upward reversal.
Bearish Divergence: Price makes higher highs, but the indicator makes lower highs → Suggests potential downward reversal.
📌 Use Case: Best applied during downtrends (bullish divergence) or uptrends (bearish divergence) to catch reversals.
2. Hidden Divergence (The Professional’s Favorite)
Bullish Hidden Divergence: Price makes higher lows, but indicator makes lower lows → Signals trend continuation upwards.
Bearish Hidden Divergence: Price makes lower highs, but indicator makes higher highs → Signals trend continuation downwards.
📌 Use Case: Hidden divergence is used to confirm trend continuation after pullbacks, ideal for trend traders.
3. Exaggerated (Extended) Divergence
Price forms equal highs/lows, but the indicator shows higher lows/lower highs → Signals momentum build-up for reversal.
📌 Use Case: Seen at range breakouts or market tops/bottoms.
✅ Why Divergence Works (Institutional View)
Liquidity Manipulation: Institutions push price to make new highs/lows to grab liquidity, but momentum slows because real volume decreases.
Momentum Imbalance: Even as price extends, internal market strength weakens, revealed through divergence.
Smart Money Accumulation/Distribution: Divergence often appears when institutions quietly build or offload positions, creating momentum shifts.
✅ Advanced Divergence Trading Secrets
🔥 Secret #1: Multi-Timeframe Divergence
Always check divergence on higher timeframes (H4, Daily), then execute entries on lower timeframes (M15, H1).
A daily divergence holds more power than M15 divergence.
🔥 Secret #2: Confluence with Support/Resistance or Order Blocks
Divergence is strongest when it happens at a key structure level (support, resistance, order block, or imbalance zone).
Don’t trade divergence alone — combine it with price reaction at major zones.
🔥 Secret #3: Wait for Structure Break Confirmation
After divergence, wait for Break of Structure (BOS) or Change of Character (CHoCH) to confirm reversal.
This filters out many false divergence signals.
🔥 Secret #4: Volume Confirmation
Confirm divergence with volume drop or volume spike reversal.
Divergence with low participation increases reversal probability.
✅ Pro Divergence Entry Method
✅ Spot Divergence at key levels.
✅ Wait for candlestick confirmation (engulfing candle, pin bar, inside bar).
✅ Look for Break of Minor Structure.
✅ Enter on retest of BOS/CHoCH zone or order block.
✅ Stop loss below swing low/high, target next liquidity pool or imbalance zone.
✅ Common Mistakes to Avoid
❌ Trading divergence without context (e.g., countering a strong trend blindly).
❌ Ignoring higher timeframe trend direction.
❌ Entering without confirmation candle or structure break.
❌ Using lagging indicators without understanding price action.
✅ Final Thoughts
Divergence is a leading indicator, but it must be combined with market structure, key levels, and confirmation price action. Professionals use divergence as a warning sign, not an instant entry trigger. By mastering divergence, you can predict market exhaustion, capture high-reward reversals, and avoid common retail traps.
Divergence is one of the hidden secrets of market timing — master it, and your trading accuracy will improve dramatically

Support and ResistenceWhat is Support?
Support refers to a price level where a downtrend tends to pause or reverse due to increased buying interest. When price drops to a support level, traders and investors see it as a “discounted” price, which attracts buying activity. This buying demand causes the downtrend to slow down or reverse.
Key Points About Support:
It acts as a floor in the market.
Support levels are created when buyers are willing to purchase at a certain price level.
The more times price touches a support level and bounces back, the stronger the support becomes.
Once broken, support can become resistance, meaning that if the price breaks below support, it may face difficulty moving back up past that level.
What is Resistance?
Resistance refers to a price level where an uptrend tends to pause or reverse due to increased selling pressure. When price rises to a resistance level, traders see it as an “expensive” price and tend to sell, causing the price to stall or drop.
Key Points About Resistance:
It acts as a ceiling in the market.
Resistance levels are formed when sellers dominate and prevent the price from moving higher.
The more times price touches resistance and fails to break through, the stronger the resistance is.
If price breaks above resistance, it can become support, known as a support-resistance flip.
Why Support and Resistance are Important
✅ Identifies High-Probability Trade Zones – Helps you spot where to enter and exit trades.
✅ Improves Risk Management – Lets you place stop-loss orders around logical areas.
✅ Confirms Market Direction – Breakouts and rejections from these zones signal potential trend continuations or reversals.
✅ Works Across All Timeframes – Support and resistance can be applied to intraday trading, swing trading, and long-term investing.
Types of Support and Resistance
🔹 Horizontal Levels
Flat, horizontal price areas where the market reverses multiple times. This is the simplest and most common form.
🔹 Dynamic Support and Resistance
Levels that change with price movement, usually identified using moving averages like the 50-day or 200-day MA.
🔹 Trendlines
Diagonal support and resistance lines that connect higher lows in an uptrend or lower highs in a downtrend.
🔹 Zones Instead of Exact Lines
Professional traders focus on zones, not exact price points, because the market often reacts within a range.
How Professionals Use Support and Resistance
Institutions use these levels to accumulate positions quietly.
Smart traders wait for confirmation (candlestick patterns, volume increase) before entering trades.
Breakouts of these levels often lead to big moves because many stop-loss orders are triggered, creating momentum.
False breakouts or liquidity grabs are used by big players to trap retail traders before reversing the market.
Final Thoughts
Understanding support and resistance is fundamental to becoming a successful trader. It helps you anticipate market behavior, manage risk, and trade with confidence. Whether you are a beginner or an experienced trader, continuously refining your ability to identify and trade these key levels will improve your consistency and profitability.
Support and resistance are not just lines on a chart — they are the battle zones where market decisions are made. Master them, and you will master the market.

Support and Resistence Part-2✅ The True Meaning of Support and Resistance
At the core, support and resistance levels are psychological price areas where supply and demand dynamics shift. However, in institutional trading, these levels are engineered by large players to trigger retail reactions — such as false breakouts, stop hunts, and liquidity grabs.
Institutions use these levels to:
Accumulate large positions without moving the market.
Manipulate price to create breakout traps.
Trigger liquidity pools where retail stop-losses and pending orders are stacked.
✅ Types of Advanced Support and Resistance
1. Liquidity-Based Zones
Institutions seek liquidity to fill their large orders. They target zones where retail traders:
Place stop losses.
Have pending buy/sell orders.
Expect breakout continuations.
These zones are rarely clean horizontal lines but broader zones where price can spike in and quickly reverse.
2. Order Blocks
Order blocks are the last bullish or bearish candles before a significant price move caused by institutional orders. These are key institutional support/resistance levels where price often returns for mitigation or re-entry.
Bullish Order Block = Support Zone
Bearish Order Block = Resistance Zone
3. Breaker Blocks
When support breaks and flips to resistance (or vice versa), institutions often retest breaker blocks to add positions or induce liquidity.
4. Fibonacci Confluence Zones
Advanced traders use Fibonacci retracement and extension levels in combination with support and resistance zones to identify high-probability trade setups. Common levels like 61.8% and 78.6% often align with key order blocks.
5. Dynamic Support & Resistance (Moving Averages, VWAP)
Institutions monitor:
200 EMA/SMA on higher timeframes as dynamic resistance/support.
VWAP (Volume Weighted Average Price) as an institutional support/resistance during intraday moves.
These dynamic levels often act as price magnets during trend days.
✅ Institutional Manipulation Around Support/Resistance
🔹 Liquidity Grabs (Fake Breakouts):
Price breaks a key level (support or resistance), triggers stops, grabs liquidity, and violently reverses.
Common in forex, indices, and crypto markets.
🔹 Stop Loss Hunting:
Institutions drive price into known stop zones to fill large orders cheaply, especially during low-volume sessions.
🔹 Re-Tests and Confirmations:
Professional traders wait for confirmation after breakouts.
A common method: Break – Retest – Continuation setup, especially around higher timeframe support/resistance.
✅ How to Trade Support and Resistance Like an Institution
Mark Zones, Not Lines: Use zones (20-50 pip zones in forex or 1-2% zones in stocks), not fixed lines.
Use Multi-Timeframe Confluence: Identify higher timeframe levels (Daily, Weekly) and trade based on lower timeframe confirmations (M15, M30, H1).
Wait for Confirmations: Avoid blind entries. Wait for:
Rejection Candles (Pin Bar, Engulfing, Doji)
Break of Structure (BOS) or Change of Character (CHoCH) after grabbing liquidity.
Target Imbalance Zones: Combine support/resistance with fair value gaps (FVG) or imbalances where price is likely to revisit.
Track Volume Reaction: Volume spikes at support/resistance zones often indicate institutional activity.
✅ Pro Tips for Mastering Support and Resistance
Never chase price. Let the market come to your zones.
Higher timeframe levels = stronger reaction zones.
Watch for ‘fakeouts’ during news releases – institutions use volatility to create liquidity spikes.
Learn to recognize exhaustion (long wicks, low momentum) after liquidity grabs to confirm reversals.
Institutional levels often align with market sessions – London Open, New York Open tend to respect these zones more than Asian session.
✅ Final Thoughts
At an advanced level, support and resistance aren’t simple price levels — they are strategic zones used by institutions to trap uninformed traders. Once you start recognizing these patterns, you’ll stop reacting emotionally and start anticipating market behavior like a professional. You’ll know when to stay patient, when to avoid traps, and when to capitalize on market inefficiencies with high-probability, low-risk trades.

Learn Institutional TradingWhy Learn Institutional Trading?
The financial markets are not random; they are highly structured environments controlled by large financial players who leave visible footprints on the chart. Most retail traders don’t see these footprints and end up on the wrong side of the market. By learning institutional trading, you will finally understand:
Why the market moves the way it does.
How to spot liquidity traps and avoid stop-loss hunting.
Where smart money enters and exits trades.
How to trade with confidence instead of fear and guesswork.
This course focuses on the real mechanics of price movement, not on unreliable indicators or random trade signals.
What You Will Learn in Institutional Trading
✅ Smart Money Concepts (SMC):
Learn how institutional traders accumulate and distribute orders, using liquidity to their advantage. Understand the true story behind price action.
✅ Liquidity and Order Blocks:
Master the art of identifying liquidity pools, order blocks, and market manipulation zones. Understand where smart money enters the market and how you can follow their lead.
✅ Market Structure Mastery:
Learn to read market structures with precision, identify internal and external structures, and capitalize on market shifts with high-probability trade setups.
✅ Entry and Exit Strategies:
Get access to professional-grade entry methods, including refined confirmation entries, break-of-structure (BOS) trades, and optimal risk-reward setups.
✅ Risk Management Techniques:
Understand how institutions manage risks and protect their capital. Implement strong risk management rules to protect your trading account from unnecessary losses.
✅ Live Market Sessions and Mentorship:
Participate in live market discussions, chart breakdowns, and Q&A sessions with expert traders who trade institutional concepts every day.
Who Can Learn Institutional Trading?
This course is suitable for:
📌 Beginners who want to start with professional strategies from day one.
📌 Intermediate traders who are tired of inconsistent results.
📌 Advanced traders who want to refine their understanding of market manipulation.
📌 Investors who wish to add active trading as an income source.
📌 Aspiring professionals who aim to make trading a serious career path.
Benefits of Learning Institutional Trading
✅ Trade with clarity and confidence, knowing you are on the side of smart money.
✅ Stop chasing trades and start trading with high-probability setups.
✅ Learn to avoid retail traps and false breakouts.
✅ Build a sustainable trading career with proper risk management and psychological discipline.
✅ Apply your skills to any market: stocks, forex, crypto, indices, or commodities.
✅ Experience real growth as a professional trader, thinking several steps ahead of the market.
Learn Institutional Trading is more than just a course — it’s a complete professional transformation. It equips you with the skills, mindset, and strategies to succeed in modern financial markets. Stop trading blindly and start trading with purpose, accuracy, and confidence.

Trading Master Class With ExpertsWhy Choose the Trading Master Class With Experts?
In the world of trading, there’s a fine line between success and failure. The financial markets are full of opportunities but also come with significant risks. The key difference between winning traders and losing traders is education, discipline, and strategy. This masterclass is not just about learning how to trade; it’s about developing a professional trading mindset, learning proven techniques, and practicing high-probability setups under the guidance of industry experts.
This is a result-oriented program designed to give you a complete transformation from a confused trader to a disciplined market participant.
Key Highlights of the Master Class
In-Depth Market Knowledge: Learn the complete fundamentals of financial markets, including market structure, how different asset classes work, and what drives market movements.
Technical Analysis Mastery: From candlestick patterns to advanced indicators, understand how to read charts like a pro. Learn key technical tools like moving averages, RSI, MACD, Fibonacci retracements, and more.
Professional Trading Strategies: Master multiple trading styles including day trading, swing trading, scalping, and positional trading. Get access to expert-verified strategies used by institutional traders.
Options and Derivatives Trading: Understand the power of options trading, futures contracts, hedging techniques, and options strategies like iron condor, spreads, straddles, and strangles.
Institutional Trading Insights: Discover how big players operate in the market. Learn about smart money concepts, liquidity traps, stop loss hunting, and how to trade in alignment with market movers.
Risk Management and Trading Psychology: Learn how to protect your capital using strict risk management rules. Understand the psychological side of trading and how to build emotional discipline for consistent success.
Live Trading Sessions: Participate in live market analysis and live trading sessions with experts who explain their trades in real-time, helping you understand their decision-making process.
Community and Mentorship: Join a supportive community of traders where you can share ideas, discuss setups, and receive continuous guidance from mentors.
Who Should Attend This Master Class?
This masterclass is suitable for:
Aspiring traders who are looking for a solid foundation to start their trading journey.
Intermediate traders who are struggling with consistency and need structured guidance.
Investors who want to learn active trading techniques to multiply their returns.
Working professionals who want to trade part-time with smart strategies.
Full-time traders who want to sharpen their skills and expand their market knowledge.
What You Will Achieve After This Master Class
✅ You will be able to independently analyze charts and identify profitable trading opportunities.
✅ You will develop professional risk management habits that protect you from heavy losses.
✅ You will gain the confidence to trade any market condition — bullish, bearish, or sideways.
✅ You will have clear strategies to trade with discipline, eliminating guesswork and emotional mistakes.
✅ You will build a trader’s mindset focused on growth, patience, and long-term profitability.
This is not just another trading course. It is a complete transformation program that helps you think, act, and succeed like a professional trader. Step into the world of high-probability trading and change your financial future with the Trading Master Class With Experts.

Master Candle Sticks✅ Why Candlesticks Are So Powerful
Candlesticks visually represent real-time market sentiment. Every single candlestick shows you:
Who is in control (buyers or sellers).
The strength of momentum.
Potential exhaustion or continuation.
The battle between retail traders and smart money.
Unlike indicators, which lag, candlesticks are real-time market footprints, helping traders make quick, informed decisions based on pure price action.
✅ Structure of a Candlestick
Every candlestick consists of:
Body: The range between open and close prices — shows strength or weakness.
Wick/Shadow: High and low of the session — shows rejection, liquidity grabs, or manipulation.
Color: Bullish (green/white) vs. Bearish (red/black).
The size of the body and wicks tells a story about market strength or indecision.
✅ Essential Candlestick Patterns
🔵 Reversal Patterns:
Pin Bar (Hammer/Inverted Hammer): Long wick shows rejection of price and potential reversal.
Engulfing Candles: Bullish or bearish candles fully engulf previous candle → momentum shift.
Morning Star / Evening Star: Three-candle reversal at key levels → trend change confirmation.
Doji: Indecision candle, often seen before reversals or breakouts.
🔵 Continuation Patterns:
Inside Bar: Consolidation, often leading to breakouts in the direction of trend.
Bullish/Bearish Flag: Continuation after a sharp move.
Three White Soldiers / Three Black Crows: Strong multi-candle trend confirmation.
✅ Advanced Institutional Candlestick Secrets
🔥 Secret 1: Candlesticks at Key Market Levels
Candlestick signals are most reliable at:
Order Blocks
Support & Resistance Zones
Liquidity Pools
Imbalance/Fair Value Gaps
Always combine candlestick signals with higher timeframe zones for high-probability setups.
🔥 Secret 2: Wick Rejections & Stop Loss Hunts
Institutions often push price to grab liquidity beyond a support/resistance level, shown by long wicks. Wick rejections = liquidity grab = high reversal probability.
🔥 Secret 3: Multi-Timeframe Candlestick Reading
A single higher timeframe candle (Daily, 4H) is built from multiple smaller timeframe candles. Professionals:
Use HTF direction and LTF entry.
For example, Daily bullish engulfing + M15 break of structure = precise sniper entry.
✅ How to Master Candlestick Trading
✅ Focus on clean price action, avoid overcrowding charts with indicators.
✅ Study reaction at key levels, not random patterns.
✅ Always confirm with market structure (trend direction, higher highs/lows, BOS/CHoCH).
✅ Use candlestick confluence, combining patterns with liquidity zones, order blocks, or supply/demand.
✅ Avoid low-quality signals in choppy or low-volume markets.
✅ How Institutions Use Candlesticks
Institutions manipulate candles during low liquidity periods (fakeouts).
They use time-based traps, creating bullish/bearish patterns before reversing direction.
Volume + Candlestick Analysis shows true institutional intent — e.g., high volume bullish pin bars after liquidity grab = strong upside signal.
✅ Pro Tips for Candlestick Mastery
💡 Best signals occur after liquidity grabs — false breakout + rejection wick.
💡 Always combine candlesticks with market structure shifts — don’t take isolated signals.
💡 Trade in the direction of higher timeframe momentum, even if lower timeframe gives opposite signals.
💡 In sideways markets, avoid reversal signals, favor range trades.
✅ Final Thoughts
Candlesticks are the true language of the market. By mastering candlestick trading, you’ll gain the ability to predict market moves before they happen, trade with confidence, and avoid the common mistakes of indicator-dependent retail traders.
Master Candlestick Trading is your first step to becoming a consistently profitable trader, whether in forex, stocks, crypto, or commodities

Geopolitical & US Macro WatchWhat Is Geopolitical & US Macro Watch?
This is a two-part term:
1. Geopolitical Watch
This refers to tracking and analyzing global political situations that can impact trade, oil, currency, defense, or investor confidence. Examples include:
Wars or conflicts (Ukraine-Russia, Israel-Gaza, China-Taiwan)
Global oil sanctions
Strategic alliances (e.g., BRICS+ expansion, NATO decisions)
Diplomatic tensions between countries
These events influence:
Crude oil prices
Foreign exchange rates
FII flows (Foreign Institutional Investment)
Global demand-supply outlooks
2. US Macro Watch
This focuses on tracking economic developments in the United States, the world's largest economy. Key areas to watch include:
Inflation reports (CPI, PCE)
US Federal Reserve interest rate decisions
Jobs data (non-farm payrolls, unemployment rate)
Retail sales, housing starts
US GDP growth
U.S. debt levels and political decisions on trade/tariffs
Because the US dollar is the world's reserve currency, and because Wall Street often sets the tone for global markets, these macro signals directly affect India’s equity market, bond yields, and rupee valuation.
🧠 Why Does This Matter to Indian Traders & Investors?
You may ask—“Why should I care about some news in the U.S. or Europe when I’m only buying shares of Indian companies?”
Here’s the reality:
Over 50% of the daily movement in Indian indices like Nifty and Sensex is now influenced by global cues.
Foreign investors (FIIs), who own a huge portion of Indian stocks, take buy/sell decisions based on global trends, not just local stories.
US interest rates affect where FIIs want to put their money—if US bonds are yielding more, they might pull out of India.
Crude oil, which India imports heavily, is priced globally—if a war breaks out, oil shoots up and hits inflation in India.
In short: What happens outside India often decides how India trades.
🔥 Major Geopolitical Risks in 2025
Let’s look at some real-world developments that have been shaking or supporting markets this year:
1. Russia-Ukraine Conflict (Still Ongoing)
Even in 2025, the war isn’t over.
It affects wheat prices, natural gas, and military spending globally.
India has been balancing ties with both Russia and the West, but disruptions affect commodity markets, logistics, and inflation.
2. Middle East Tensions (Gaza, Iran, Red Sea Attacks)
Ongoing conflicts have kept crude oil prices elevated.
Shipping through the Suez Canal and Red Sea has become riskier, increasing global logistics costs.
This directly affects India’s import bill, trade deficit, and rupee stability.
3. US–China Trade Friction
The US has imposed tech restrictions on China; China is retaliating.
If tensions escalate further, it will impact the global supply chain, especially for semiconductors, electronics, and electric vehicles.
Indian tech companies (like TCS, Wipro) may see ripple effects due to changes in global outsourcing dynamics.
4. Taiwan Risk
Any Chinese military action on Taiwan could be catastrophic for markets, especially in electronics and semiconductors.
Since semiconductors power everything from phones to EVs, even a threat here affects stocks globally.
📊 Key US Macro Trends Impacting Markets in 2025
1. US Inflation is Cooling, But Not Gone
After peaking in 2022, inflation has come down, but in 2025, it’s still sticky.
That means the Federal Reserve (US central bank) is not cutting rates as aggressively as markets hoped.
➡️ When the Fed keeps rates high:
US bond yields rise
FIIs pull money out of emerging markets like India
Nifty and Sensex feel the pressure
2. US Job Market Is Strong
A robust job market signals continued economic expansion, good for global demand.
This is why metals, IT, and manufacturing stocks in India rally when US jobs data is good.
3. The Fed’s Interest Rate Policy
The biggest global event each month is the Fed meeting.
If they cut rates, stocks rally globally.
If they pause or raise rates, money flows into safe assets like gold or the US dollar—hurting Indian equities.
Real-Time Example: July 2025
In July 2025, Indian markets have been:
Rallying due to strong US jobs data and earnings
Cautious due to potential Trump-era tariffs on countries buying Russian oil
Watching closely for US inflation print and Fed meeting signals
GIFT Nifty shows bullish strength in pre-market hours when the US ends green. But we’ve also seen sell-offs on days of oil spikes or war-related news.
🧭 How to Track These Developments (Even If You’re Busy)
Here’s a simple checklist for staying informed:
✅ Every Morning
Check GIFT Nifty
Read major global headlines (US data, oil prices, geopolitics)
Note the USDINR trend
Watch India VIX
✅ Every Week
Look at US job reports, inflation (CPI), and Fed speeches
Follow crude oil and gold charts
Track FII/DII activity
Keep an eye on shipping, metals, and defense-related stocks
✅ Final Thoughts
"Geopolitical & US Macro Watch" is not just a fancy term—it's a crucial lens for today’s markets. The biggest stock market moves often come not from company news but from macroeconomic surprises or global tensions.
In 2025, being globally aware gives you an edge:
You’ll avoid panic on news-driven crashes
You’ll better understand why your portfolio is up or down
You’ll identify trade setups ahead of others
👉 Think global, act local—that’s the new mantra for smart Indian investors.
If you want daily or weekly updates summarizing these events and their impact on Indian markets, let me know—I’ll be happy to prepare a custom watchlist or dashboard for you
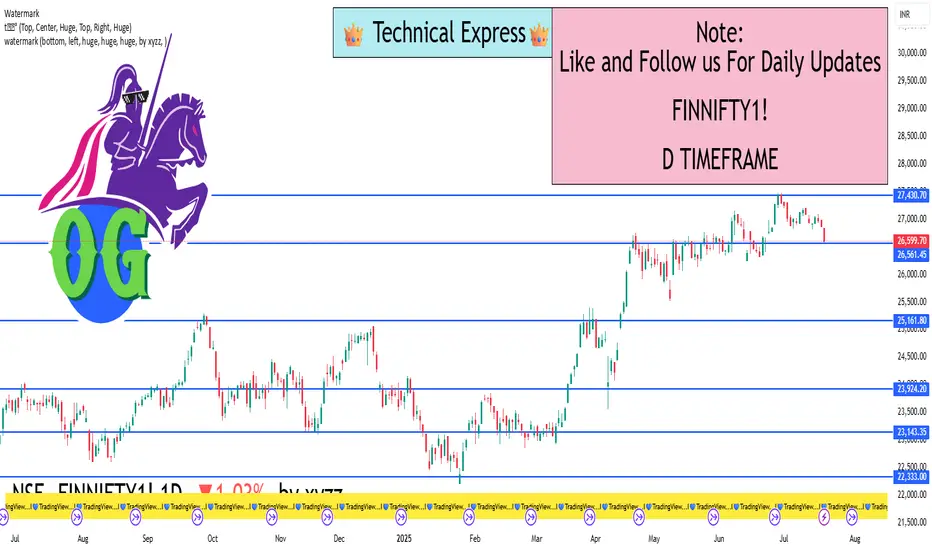
FinNifty – 1 Day Timeframe✅ Closing Summary:
Closing Price: ₹26,556.15
Change: −₹253.30 (−0.94%)
Opening Price: ₹26,809.45
Intraday High: ₹26,785.35
Intraday Low: ₹26,513.80
The FinNifty index saw a sharp drop today, primarily driven by weakness in key financial stocks and negative investor sentiment.
🔍 Key Reasons for the Decline:
Banking Sector Weakness:
One of the biggest drags was a major bank (e.g., Axis Bank) that reported weaker-than-expected quarterly earnings.
This led to panic selling in other banking and financial institutions as well.
Foreign Institutional Investors (FII) Selling:
Significant outflows from FIIs contributed to the negative sentiment.
Investors remained cautious ahead of upcoming major earnings reports and global cues.
Global Market Pressure:
Concerns about U.S. interest rate policies, inflation data, and global recessionary fears kept the broader financial market under pressure.
Psychological Level Break:
The index broke key psychological support around ₹26,600, triggering technical selling and increased volatility.
📈 Technical Outlook (Short-Term):
Support Zone: ₹26,500 to ₹26,400
This area provided some buying interest during the day, but a break below could open doors to ₹26,200 or lower.
Resistance Zone: ₹26,750 to ₹26,900
This region needs to be reclaimed for any positive momentum to sustain.
Momentum Indicators:
RSI (Relative Strength Index): Trending downward, approaching oversold conditions (~38–42).
MACD (Moving Average Convergence Divergence): Showing bearish crossover, confirming short-term weakness.
Volume: Above average during the sell-off, suggesting institutional participation in the decline.
📆 Recent Trend Performance:
1-Day Return: −0.94%
1-Week Return: −0.65%
1-Month Return: +1.35%
6-Month Return: +18.6%
1-Year Return: +13.4%
Despite the daily fall, the medium-to-long-term trend remains bullish, supported by overall strong fundamentals and earnings growth expectations.
🧠 What Traders & Investors Should Know:
Short-Term Traders: Should be cautious. Look for a bounce near the support zone for short-covering opportunities or fresh entries with tight stop-losses.
Swing Traders: May wait for confirmation of support holding at ₹26,500 before considering long trades.
Long-Term Investors: The decline could be seen as a healthy correction in an otherwise strong uptrend. Ideal for staggered buying in quality financial stocks.
💬 Conclusion:
FinNifty is currently experiencing short-term pressure due to earnings misses, global uncertainty, and FII outflows. However, its long-term chart remains constructive. Today’s 1-day candle represents a bearish move, but unless ₹26,400 breaks decisively, a recovery is possible in the coming sessions—especially if upcoming results from top banks like HDFC and ICICI meet or exceed expectations
LEARN INSTITUTIONAL TRADING✅ What is Institutional Trading?
Institutional trading focuses on understanding how big money flows in the market. Institutions trade in huge quantities, and their strategies revolve around manipulating prices to collect liquidity, triggering stop-losses, and creating false breakouts. Retail traders often lose money because they follow trends without understanding the market structure set by these institutions.
✅ What You Will Learn in Institutional Trading
1. Smart Money Concepts (SMC):
Learn how smart money (institutions) traps retail traders using fake breakouts, stop hunts, and liquidity grabs.
2. Market Structure:
Higher Highs (HH), Higher Lows (HL), Lower Highs (LH), Lower Lows (LL)
Break of Structure (BOS) and Change of Character (CHOCH)
This helps you predict market direction with logic, not emotions.
3. Order Blocks:
These are zones where institutions place large orders. You’ll learn how to identify them and trade with the big players.
4. Liquidity Pools:
Find out where stop-losses and pending orders are sitting in the market so you can trade smartly by targeting liquidity zones.
5. Entry & Exit Strategies:
Master high-probability entry techniques and learn proper risk management like institutional traders.
✅ Why Learn Institutional Trading?
Retail Trading Institutional Trading
Random entries Planned entries based on logic
Easily manipulated Trades follow the footprint of big players
Low win rate Higher win rate with patience
Emotional trading Rule-based, stress-free trading
✅ Benefits of Mastering Institutional Trading
🎯 Accurate Trades – Follow the market makers.
💸 Better Risk-Reward – Small stop-loss, bigger targets.
⏰ Trade Less, Earn More – No overtrading, only quality setups.
🧠 No Indicators Needed – Pure price action and market reading.
✅ Who Can Learn Institutional Trading?
✅ Beginners who want to start right.
✅ Retail traders who keep losing.
✅ Part-time traders looking for consistency.
✅ Anyone serious about becoming a profitable trader.
✅ Final Words:
Institutional trading teaches you how to trade with the smart money instead of against it. Once you master these strategies, you will understand market moves like a professional and make more consistent profits

Technical Class✅ What You Learn in a Technical Class
1. Introduction to Technical Analysis
What is price action?
Difference between Technical and Fundamental Analysis
Basics of Candlestick Charts
2. Candlestick Patterns
Bullish and Bearish Patterns
Reversal Patterns (Doji, Hammer, Shooting Star)
Continuation Patterns (Flags, Pennants)
3. Chart Patterns
Double Top, Double Bottom
Head and Shoulders
Triangles (Ascending, Descending)
4. Indicators and Oscillators
Moving Averages (MA, EMA)
RSI (Relative Strength Index)
MACD (Moving Average Convergence Divergence)
Bollinger Bands
5. Support and Resistance
How to Identify Strong Support Zones
How to Use Resistance Levels for Entries/Exits
6. Trend Analysis
How to Spot a Trend (Uptrend, Downtrend, Sideways)
Trendlines and Channels
Breakouts and Fakeouts
7. Volume Analysis
Importance of Volume in Confirming Moves
Volume Spikes and Market Reversals
8. Risk Management
How to Protect Your Capital
Stop Loss and Take Profit Strategies
Risk-Reward Ratio
✅ Who Should Attend a Technical Class?
✅ Stock Market Beginners
✅ Intraday Traders
✅ Swing Traders
✅ Option Traders
✅ Anyone who wants practical market knowledge

What is FII and DII✅ What is FII and DII?
These are two major types of investors who invest huge amounts of money in the Indian stock market.
Acronym Full Form Meaning
FII Foreign Institutional Investor Big investors from outside India
DII Domestic Institutional Investor Big investors within India
🧠 Let’s Understand Them One by One:
🔵 FII – Foreign Institutional Investor
These are large investment firms, hedge funds, mutual funds, pension funds, insurance companies, etc. from outside India.
They invest in Indian equity markets, debt markets, bonds, etc.
Registered with SEBI to invest in Indian markets
📌 Examples:
Morgan Stanley
BlackRock
Goldman Sachs
Vanguard
JP Morgan Asset Management
🎯 Why They Invest in India?
Growth opportunity in Indian economy
Higher returns compared to developed markets
Long-term story of India = bullish
🔥 When FII inflow increases:
Nifty, Sensex, Bank Nifty usually go up
Especially impacts large-cap stocks (Reliance, HDFC, ICICI Bank)
🔴 DII – Domestic Institutional Investor
These are big Indian institutions that invest in Indian markets.
Includes:
Mutual Funds (like SBI MF, ICICI Pru MF)
Insurance companies (LIC, HDFC Life)
Banks (SBI, HDFC Bank treasury)
Pension funds (EPFO)
📌 They manage common people's money, and invest in:
Equity (stocks)
Debt (bonds, government securities)
🎯 Why DIIs Matter?
Provide stability to markets
When FIIs sell, DIIs often support the market by buying
📊 FII vs DII - Key Differences
Factor FII DII
Based I Foreign Countries India
Regulated By SEBI SEBI
Invest In Equity, Bonds, Derivatives Equity, Bonds, Mutual Funds
Impact On Market Highly volatile, quick to enter/exit More stable, long-term investing
Popular Examples BlackRock, JP Morgan, Nomura LIC, SBI Mutual Fund, ICICI Pru MF
🧭 Why Traders Watch FII/DII Data Daily
📈 FII/DII Activity Shows Market Mood
When FIIs are buying, markets often trend up
When FIIs are selling, markets can become volatile
When DIIs are buying, they may be supporting the market
Example:
"FII bought ₹2,500 Cr, DII sold ₹500 Cr"
→ Strong bullish sign, smart money is entering
🔄 What Happens When FIIs Sell and DIIs Buy?
FIIs sell during global tension or USD strength (they pull out money)
DIIs buy at dips to average out long-term positions
This creates volatility but also buying opportunities
🧠 Final Thoughts
FII = Foreign money → fast movers, sensitive to global news
DII = Indian money → stable investors, long-term focused
Daily FII/DII data tells us where smart money is flowing
📌 Smart traders always check FII/DII data before taking major trades — especially in Nifty, Bank Nifty, Reliance, Infosys, HDFC twins
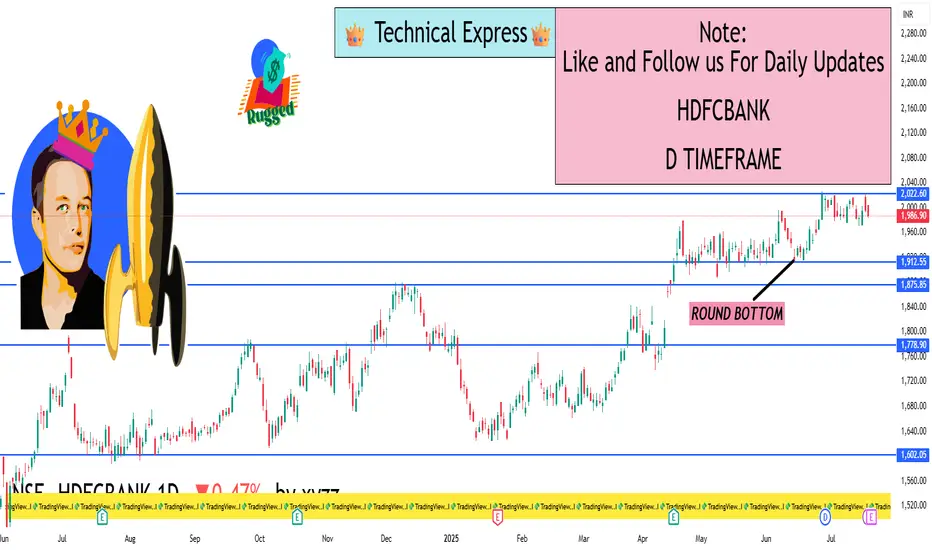
HDFCBANK 1d investment levelKey Support (Buy-on-Dip) Levels
(Where buyers tend to show up)
₹1,985 – ₹1,986 (S1 – Classic Pivot)
First support zone based on classic pivot calculations
₹1,973 – ₹1,974 (S2 – Fibonacci Pivot)
Stronger cushion in case of deeper pullbacks
₹1,954 – ₹1,955 (S3 – Classic Pivot)
Final buffer zone—breaking it may signal deeper weakness
🚧 Key Resistance (Profit-Taking) Levels
(Where selling might appear)
₹2,015 – ₹2,016 (R1 – Classic/Fibonacci Pivot)
Immediate resistance and possible profit-booking zone
₹2,033 – ₹2,034 (R2 – Classic/Fibonacci Pivot)
Next hurdle; be prepared to take partial profits
₹2,045 (R3 – Classic Pivot)
A stronger resistance zone; breaking it could signal fresh upside
🎯 Action Tips
Buying: Enter around ₹1,985, and add at ₹1,973 if dip deepens. Use ₹1,954 as a stop-loss trigger.
Selling (Profit Booking): Trim part of your position near ₹2,015, and more near ₹2,033–₹2,045 if momentum slows.
Breakout Strategy: A clean daily close above ₹2,045 with volume may trigger fresh upside moves.
Risk Control: If price dives below ₹1,954, re-evaluate—broader market risk may be rising.
🧠 Why These Levels Matter
Pivot levels are watched closely by traders and algorithms, making them natural turning points in daily price action
HDFC Bank’s technical signals are currently neutral to slightly bearish, making dip-buying near supports more advantageous than chasing highs .
✅ Final Word (Plain Language)
Look to buy dips in the ₹1,985–1,974 range with a tight stop below ₹1,954.
Take profits around ₹2,015 and ₹2,033–₹2,045 based on your risk appetite.
Watch closely above ₹2,045—that’s your breakout level for potential new highs
Tech & Digital Transformation (AI, Automation, EV)Introduction
We live in a time where machines can think, cars can drive themselves, and businesses are run by algorithms and automation. This isn’t a sci-fi movie — it’s happening now.
In 2025, the technology and digital transformation wave is in full swing in India. From Artificial Intelligence (AI) to robotic automation, and from electric vehicles (EVs) to cloud-based services, industries across the board are being reshaped.
This isn’t just about fancy tech buzzwords. It’s about:
Creating new businesses
Changing how old industries operate
Giving rise to new investment and trading opportunities
Let’s break down this major trend in a way that’s simple, clear, and real — so whether you’re a trader, investor, student, or entrepreneur, you’ll understand exactly what’s going on and how you can benefit.
🔍 What Is Digital Transformation?
Digital Transformation means using technology to make businesses smarter, faster, and more efficient.
For example:
A factory installs sensors and AI software to reduce waste
A hospital uses AI to detect diseases faster
A cab company replaces petrol cars with electric vehicles and uses an app to manage rides
It’s not just about using computers — it’s about rethinking how we do things using modern technology.
🚀 What’s Driving the Tech Transformation in 2025?
Let’s look at what’s fueling this massive shift:
✅ 1. Government Support & Policies
India’s government is pushing hard for:
AI adoption in governance, education, and healthcare
EV ecosystem with PLI schemes, subsidies, and charging infra
Digital India 2.0 for internet access, 5G, and digital services
This strong policy backing is giving tech companies the freedom to scale quickly.
✅ 2. Rise of Young Tech-Savvy Population
India has over 700 million internet users and a median age of 29. That means:
More digital consumption
More startups building tech products
More users adopting AI, EVs, and online services
✅ 3. Global Tech Trends Are Local Now
AI models like ChatGPT, MidJourney, and Copilot are being used in:
Schools
Small businesses
Customer service
Indian firms are localizing this tech — using it for regional languages, agriculture, finance, etc.
✅ 4. Corporate India Is Adopting Automation
From TCS to Tata Steel, companies are:
Automating HR, finance, supply chains
Using AI for predictive maintenance and demand forecasting
Adopting cloud computing for scale and security
This saves time, reduces cost, and improves profits — which markets love.
🧠 Let’s Dive Into 3 Key Areas
1️⃣ Artificial Intelligence (AI)
💡 What is AI?
AI is when machines are programmed to “think” like humans — they learn from data and make smart decisions.
Examples:
Google Maps finding fastest routes
YouTube recommending videos
Chatbots answering your bank queries
Indian AI Stocks to Watch
Tata Elxsi – AI in automotive, healthcare, media
Persistent Systems – AI in BFSI and digital transformation
Happiest Minds – AI-powered automation, analytics
LTTS (L&T Tech) – AI in industrial automation
Cyient DLM – Smart systems for defence and manufacturing
📈 Why AI Is a Hot Investment Theme
AI is not just a cost-saver — it creates entirely new business models
Global demand is exploding (even SMEs are adopting it)
India has rich data + cheap talent = AI leadership potential
2️⃣ Automation & Robotics
🤖 What is Automation?
Automation is when machines or software handle repetitive tasks without human help.
From factory robots to chatbots, automation is everywhere.
🏭 Where India Is Using Automation in 2025
Smart Factories: Robots assembling products, AI managing inventory
Warehousing: Amazon-style automated fulfillment
Banks: Robotic Process Automation (RPA) for account management, KYC
Transportation: Drones for delivery, automated traffic systems
🧑💼 Impact on Jobs & Skills
While some repetitive jobs may reduce, automation is creating new roles in:
Robotics management
AI training and supervision
Tech repair and integration
Data analytics
In short: Humans + Machines = Powerful combo
📊 Indian Automation Stocks to Watch
ABB India – Robotics & factory automation
Honeywell Automation – Process control tech
KPIT Tech – Automotive software automation
LTTS – Industrial and smart city automation
Tata Elxsi – Automation in EVs, healthcare, and rail
3️⃣ Electric Vehicles (EVs)
⚡ What are EVs?
EVs are vehicles powered by electric batteries instead of petrol/diesel.
They are:
Cleaner (no tailpipe emissions)
Cheaper to run (₹1/km vs ₹6/km for petrol)
Quieter and more efficient
🚗 Why India Is Going Electric in 2025
High petrol/diesel prices
Pollution control targets
Government incentives (FAME II, state subsidies)
Massive charging infra expansion
🏭 Companies Driving the EV Revolution
EV Manufacturers:
Tata Motors – India’s EV leader (Nexon EV, Tiago EV)
Mahindra & Mahindra – Born-EV architecture
Ola Electric – Two-wheelers and upcoming EV cars
Battery & Charging:
Exide Industries
Amara Raja Energy
Servotech Power
HBL Power Systems
Ancillary (parts, controllers, software):
Sona Comstar
Samvardhana Motherson
Electra EV (private)
📈 EV Investment Trend
Investors are eyeing battery tech, charging infra, and lightweight materials
Many EV stocks are already multi-baggers
PLI Scheme for battery storage and EV parts = big boost
📊 Performance Snapshot: Tech & Digital Leaders (Jan 2023 – July 2025)
Stock Jan 2023 Price July 2025 Price Approx. Gain
Tata Elxsi ₹6,500 ₹10,200 57%+
LTTS ₹3,800 ₹6,200 63%+
KPIT Tech ₹750 ₹1,560 108%+
Persistent Systems ₹4,000 ₹6,850 71%+
Servotech Power ₹45 ₹210+ 360%+
Tata Motors ₹400 ₹950+ 130%+
🧭 The Bigger Picture: Digital India 2.0
The Indian government is pushing:
5G/6G rollout
Smart city automation
AI in governance
Digital healthcare
Universal EV adoption by 2030
All of this means huge tailwinds for technology companies, startups, and R&D investments.
✅ Final Thoughts
The Tech & Digital Transformation theme in 2025 is not a bubble — it’s a fundamental shift in how India works, moves, learns, and grows.
AI is no longer future tech — it’s today’s business driver.
Automation is making Indian industries globally competitive.
EVs are no longer a dream — they’re on every city road.
This megatrend is not going away anytime soon. Whether you’re an investor, trader, or entrepreneur, now is the time to understand, explore, and ride the digital wave

LEARN INSTITUTIONAL TRADING🔍 What Is Institutional Trading?
Institutional trading is how large financial organizations operate in the markets. They don’t buy based on tips or random indicators — they use price action, volume data, liquidity zones, and market structure to accumulate and distribute positions quietly, often without the retail crowd noticing.
Learning institutional trading means learning:
How markets truly move
How smart money traps retail traders
How to follow big money footprints
🧠 Key Concepts You’ll Learn
1. Market Structure Mastery
Understand how institutions analyze market structure:
Break of Structure (BoS)
Change of Character (ChoCH)
Trends, ranges, and consolidation zones
2. Liquidity and Order Blocks
Learn how to identify:
Institutional order blocks (entry zones of banks)
Liquidity grabs (stop loss hunting zones)
Fair value gaps and imbalance areas
3. Smart Money Concepts (SMC)
SMC is the foundation of institutional trading. You’ll learn:
Wyckoff accumulation & distribution
Internal vs. external market structure
Entries based on premium-discount theory
4. Volume and Manipulation
Learn how volume, price action, and timeframes work together to show:
Hidden buying/selling
Trap zones
Institutional accumulation patterns
5. Entry & Exit Planning
How institutions plan:
Low-risk, high-reward entries
Multi-timeframe confirmation
Managing trades with scaling in/out
📊 Why Institutional Trading Is Powerful
Institutions:
Have deep capital
Move the market
Use strategies based on logic and patience
When you learn how to think like an institution, you stop chasing signals and start trading with confidence and structure.
👨🏫 Who Should Learn Institutional Trading?
Beginners looking for the right trading foundation
Intermediate traders tired of inconsistent results
Advanced traders seeking deeper strategy and psychology
Intraday, swing, and positional traders
✅ What You'll Gain:
A complete mindset shift in how you view the markets
Strategies with clear entry, stop loss, and target rules
Tools to trade any market: stocks, forex, indices, crypto
Confidence to follow smart money — not get trapped by it
🚀 Start Your Journey Now
Stop trading like the 90%. Learn how the 10% think, plan, and profit.
"Learn Institutional Trading" is your opportunity to elevate your market skills and build long-term trading success with a professional edge.

Commodity Supercycle 2025: Metals & Energy⚒️ Metals: The Foundation of Industrial Growth
Why are metal prices booming?
Let’s break it down in human terms:
Massive Infrastructure Projects
India, US, China, and Europe are all spending billions on roads, bridges, railways, smart cities, and housing.
All of that needs steel, cement, aluminum, copper, etc.
Clean Energy = More Copper & Aluminum
Solar panels, EVs, and wind turbines need a lot more copper, lithium, and rare metals than conventional energy.
This creates a demand explosion for base metals.
Supply Chain Bottlenecks
Mines across the world (especially in Africa, Chile, and Australia) are facing labour shortages, political instability, or environmental restrictions.
Less mining = less supply = prices go up.
China’s Comeback
China is the largest consumer of metals globally.
After a slow period in 2022–23, it’s back with a stimulus to revive housing and infrastructure — adding massive demand pressure.
🔋 Energy: Fuel for the Supercycle
What’s happening in oil, gas, and coal?
Crude Oil Above $90/Barrel
Conflicts (Russia-Ukraine, Middle East) + OPEC production cuts = tight supply
Despite the push for renewables, the world still runs on oil for transport and manufacturing
Natural Gas Shortages in Europe/Asia
War-related disruptions in Russian supply have caused natural gas prices to skyrocket
LNG imports from the US and Qatar are booming — good for companies in that ecosystem
Coal Prices Rising Again
Despite climate goals, India, China, and others are still using coal for base power
Coal India and related PSUs have seen strong earnings due to volume demand + price support
🧾 How This Affects the Indian Market
India is both a major consumer and a growing exporter of various commodities.
Winners in the Supercycle:
1. Metal Stocks (Steel, Aluminum, Copper)
Company Why It’s Benefiting
Tata Steel Global presence + rising prices = higher margins
JSW Steel Export growth + capex-driven demand
Hindalco Aluminum giant + Novelis (US-based unit)
Hindustan Copper India’s only copper miner; global demand rising
2. Energy Stocks (Oil, Gas, Coal)
Company Why It’s Benefiting
ONGC Rising crude prices = stronger profitability
Oil India Smaller PSU with strong rally potential
Coal India Massive volumes, dividend, pricing power
Reliance Petrochemicals + oil refining benefits
3. Ancillary & Export-Based Stocks
Company Role in Supercycle
NMDC Supplies iron ore – key to steelmakers
MOIL Manganese supplier for steel industry
APL Apollo Tubes Beneficiary of infra + steel boom
Welspun Corp Pipes for oil & gas pipelines
📊 Real Performance: Numbers Don’t Lie
Let’s take a quick look at recent returns (approx. from Jan 2023 to July 2025):
Stock Price in Jan 2023 Price in July 2025 Approx % Gain
Tata Steel ₹110 ₹170+ 55%+
JSW Steel ₹690 ₹930+ 35%+
Hindalco ₹430 ₹675+ 55%+
Coal India ₹220 ₹450+ 100%+
ONGC ₹150 ₹270+ 80%+
These are fundamentally driven rallies — not pump-and-dump moves. That’s the beauty of supercycles.
📈 Technical Outlook in July 2025
Nifty Metal Index:
📌 Near all-time highs (~9,000+ zone)
📈 Trend: Strong bullish
🔁 Expect periodic corrections of 5–7%, but uptrend likely to continue
Nifty Energy Index:
📌 In a broad uptrend, thanks to Coal India, ONGC, Reliance
📈 Breakouts seen in power generation and refining stocks
🎯 Next resistance at 30,000+, support at 28,500
🧠 What Traders & Investors Should Do
🧭 For Traders:
Focus on volume breakouts in metal & energy stocks
Watch for sectoral momentum using indices like Nifty Metal, Nifty Energy
Use Futures & Options (F&O) strategies like:
Call buying on breakout confirmation
Bull call spreads in ONGC, Hindalco, Tata Steel
Short straddles for sideways phases in Coal India
📆 For Swing Traders:
Identify weekly breakout patterns (flags, cup & handle, triangle)
Use trailing SL and partial booking (these stocks move fast)
Best timeframe: 2–4 week swings, especially in trending names
💼 For Long-Term Investors:
Allocate 10–15% of your portfolio to core metal/energy stocks
Focus on low-debt, dividend-paying companies (e.g., Coal India, ONGC)
SIP or staggered entries work well in a volatile commodity cycle
Expect volatility — supercycles are not linear
❗ Risks & Cautions
Every rally has its risks. Here’s what to keep in mind:
Risk Impact
Global Recession Could reduce commodity demand globally
China Slowdown Big impact on copper/steel demand
Currency Volatility Affects import/export profitability
Policy Changes Carbon tax, ESG push may hurt coal/oil stocks
Overheating Stocks may correct 15–20% if valuations get stretched
Always use risk management — especially in leveraged trades.
🗺️ Global Supercycle Factors to Watch in 2025–26
🛢️ Crude oil production quotas (OPEC+ decisions)
🏗️ China’s stimulus on construction and EVs
🌱 ESG push: Will governments ban/restrict dirty fuels faster?
💹 US Fed rate cuts/inflation outlook (affects commodity pricing)
🧾 Mining policies in resource-rich countries (Africa, Latin America)
These global forces shape how long the current commodity upcycle will last.
✍️ Final Thoughts
The commodity supercycle in 2025 is real and being driven by multi-year global trends in infrastructure, energy transformation, and supply limitations. This is not just a short-term rally — it’s part of a structural shift.
If you’re a trader — this sector is offering sharp, trend-friendly price action.
If you’re an investor — this is your chance to ride secular growth in India’s industrial backbone.
💡 “When the world builds, commodities boom. And when that boom is real, wealth is created.”

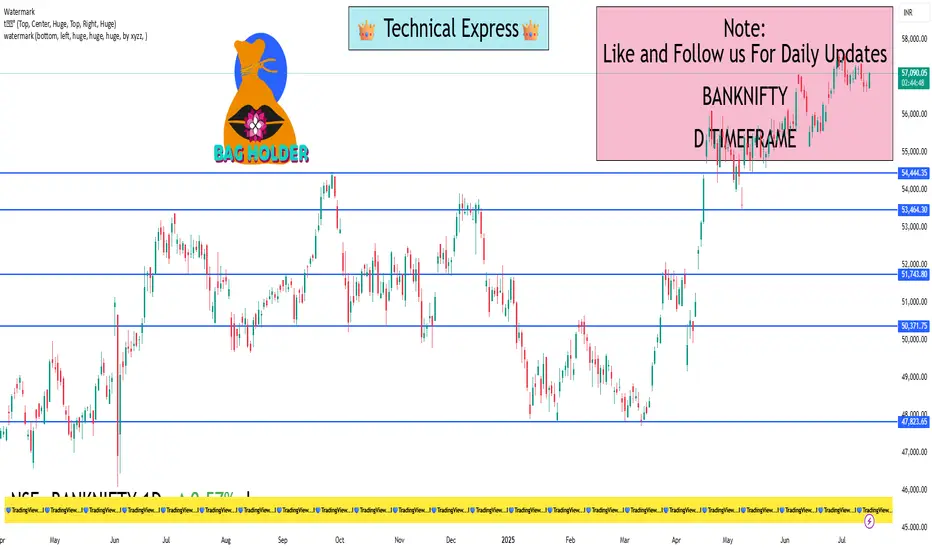
BankNifty 1D Timeframe📊 Current Market Price:
Around ₹56,750 – ₹56,800
Bank Nifty has recently cooled off a bit after touching its all-time high of ~₹57,628. It’s still in a strong uptrend, but showing short-term consolidation—which is healthy for long-term moves.
🛡️ Important Support Zones (Buy on Dips)
These are levels where Bank Nifty is likely to bounce if it falls:
✅ ₹56,200 – ₹56,300
Recent swing low and key 1-day candle support
Ideal first level to enter or add
Can act as a good buying zone if the index dips slightly
✅ ₹55,500 – ₹55,700
Strong demand zone
Acts as a cushion in case of deeper correction
Great zone for long-term accumulation
✅ ₹54,800 – ₹55,000
Previous breakout level
Excellent entry point for long-term investors if panic selling happens
🚧 Resistance Levels (Upside Barriers)
These are levels where profit booking may happen:
🔼 ₹57,000 – ₹57,200
Near current highs; if crossed, momentum may return quickly
🔼 ₹57,600 – ₹57,800 (All-Time High Zone)
Heavy resistance; needs volume to break
🔼 ₹58,500+
Potential future target on strong breakout above ₹57,800
📌 What to Do Now (Investment Plan)
🔹 Already Holding?
Stay invested. Trend is still bullish unless price breaks below ₹55,000.
Consider booking partial profits near ₹57,600 if you're short-term focused.
🔹 Want to Invest Now?
Wait for dip to ₹56,200 – ₹56,300 for safer entry
Start buying in small parts. Don’t go all in at once.
🔹 Aggressive Entry?
You can also consider entering now and adding more on dips
Just place a stop loss near ₹55,000 (daily close basis)
Option TradingInvesting Approach by Institutions
✅ Investment Philosophy:
Long-term horizon
Focus on fundamentals (P/E, ROE, growth)
Sector rotation and macro trends
✅ Allocation Strategies:
Strategic Asset Allocation (SAA)
Tactical Asset Allocation (TAA)
Smart Beta and Factor Investing
Trading Strategies by Institutions
🔹 High-Frequency Trading (HFT)
Executes thousands of trades in milliseconds
Relies on arbitrage, price inefficiencies
🔹 Statistical Arbitrage
Mean-reversion strategies using historical patterns
🔹 Swing & Trend Trading
Use technical indicators like MACD, Moving Averages, RSI

Advance Option Trading Why Institutions Prefer Options
Leverage – Control large positions with small capital
Risk Management – Protect portfolios
Cash Flow – Earn premium income
Volatility Play – Earn from IV rise/fall
Customization – Tailored exposure using exotic options
Core Strategies Used by Institutions
1. Protective Puts
Buy puts to insure large stock holdings against downside risk.
2. Covered Calls
Earn premium income on long-term stock holdings.
3. Calendar Spreads
Take advantage of time decay and volatility differences.
4. Straddles & Strangles
Bet on volatility movement, not direction.
Tools Used by Institutional Option Traders
Bloomberg Terminal – Real-time data, pricing models
Quantitative Models – Black-Scholes, Binomial Trees
Algo Execution – Smart order routing
Risk Management Software – VaR, Greeks analysis
Option Analytics Platforms – Orats, Trade Alert

Option Trading Part-1 What Is Institutional Option Trading?
Institutional Option Trading involves using derivatives (Options) for:
Hedging big equity portfolios
Speculating on volatility or price movement
Arbitrage opportunities
🔹 Key Techniques:
Volatility Arbitrage
Delta-Neutral Hedging
Covered Calls
Protective Puts
Iron Condors & Spreads
How Institutions Use Options Differently
✅ Retail Focus:
Naked calls/puts
Directional trades
Limited capital
✅ Institutional Focus:
Portfolio insurance
Complex multi-leg strategies
Implied Volatility arbitrage
Event-based hedging (like earnings or Fed news)
