Institutional Option Trading Part -3Institutional Investment Process
Setting Objectives: Determining risk tolerance, return targets, and time horizons.
Asset Allocation: Dividing the portfolio among different asset classes.
Security Selection: Choosing individual investments.
Portfolio Monitoring: Continuously reviewing performance and risk.
Institutional Trading
Institutional trading refers to the buying and selling of securities in large volumes by institutions.
Types of Institutional Traders
Proprietary Traders: Trade with the institution's own money.
Agency Traders: Execute trades on behalf of clients.
Program Traders: Use algorithms to trade baskets of stocks.
Trading Venues
Exchanges: NYSE, NASDAQ, etc.
Dark Pools: Private exchanges for large orders.
Over-the-Counter (OTC): Direct trading without an exchange.
Sensex

Institutional Option Trading Part -10Investment Strategies
Active Management: Constantly buying and selling assets to outperform benchmarks.
Passive Management: Tracking indices like the S&P 500 to match market performance.
Value Investing: Identifying undervalued stocks.
Growth Investing: Focusing on companies with high growth potential.
Quantitative Investing: Using mathematical models to guide investment decisions.
Risk Management
Diversification: Spreading investments across various sectors and assets.
Hedging: Using derivatives to offset risks.
Liquidity Management: Ensuring enough cash to meet obligations.
Regulatory Compliance: Adhering to financial regulations.

Institutional Option Trading Part -2Disadvantages
Regulatory scrutiny.
Complexity and need for highly skilled traders.
Potential market impact.
Institutional Investing
Institutional investing is the process of managing large-scale investment portfolios with long-term goals.
Investment Objectives
Capital Preservation: Maintaining the value of assets.
Capital Appreciation: Growing the portfolio over time.
Income Generation: Providing steady returns through dividends or interest.
Asset Classes Used
Equities: Shares of publicly traded companies.
Fixed Income: Bonds and other debt instruments.
Real Estate: Direct investments or REITs.
Commodities: Such as gold, oil, or agricultural products.
Derivatives: Options, futures, and swaps.

Institutional Option Trading Part -5Institutional Option Trading
Institutional option trading involves using options as part of sophisticated strategies to hedge risk, enhance returns, or speculate.
Objectives of Institutional Option Trading
Hedging: Protecting large portfolios against market downturns.
Income Generation: Selling options to collect premiums.
Speculation: Taking directional bets with options.
Arbitrage: Exploiting price inefficiencies across markets.

Institutional Option Trading Part -6Institutional trading and investing significantly differ from retail activities. Institutions trade in large volumes, use complex strategies, and have access to exclusive information and tools. This guide will provide a comprehensive overview of institutional option trading, investing, and general trading practices, detailing their methodologies, tools, and market impacts.
Understanding Institutional Investors
Institutional investors include mutual funds, hedge funds, pension funds, insurance companies, and large banks. These entities manage vast sums of money, often on behalf of others, and possess substantial market influence.
Key Characteristics:
Large Capital Base: Institutions trade in millions or billions.
Market Influence: Their trades can impact prices significantly.
Professional Resources: Access to cutting-edge research, proprietary algorithms, and high-speed trading platforms.

Put Call Ratio (PCR) Explained in Simple TermsWhat is PCR?
The Put-Call Ratio (PCR) is a popular market sentiment indicator used in option trading. It helps traders understand whether more people are buying put options (bearish bets) or call options (bullish bets) at a given time.
Put Options: Contracts betting the price will go down.
Call Options: Contracts betting the price will go up.
How to Read PCR?
PCR < 1: More call options → Bullish sentiment.
PCR > 1: More put options → Bearish sentiment.
PCR = 1: Neutral sentiment.
But extreme values often suggest the opposite:
Very High PCR: Possible market reversal upwards (too many bearish bets).
Very Low PCR: Possible market reversal downwards (too many bullish bets).
Example:
Put OI: 5,00,000 contracts
Call OI: 10,00,000 contracts
PCR = 5,00,000 / 10,00,000 = 0.5 → This indicates bullish sentiment.
Why PCR Matters?
Helps identify market mood (bullish or bearish).
Gives contrarian signals (overcrowded trades can reverse).
Used in option trading strategies for timing entry and exit.

Learn Institutional Trading Pros and Cons
Pros: Early signals, useful for reversals.
Cons: Requires confirmation, may produce false signals.
Technical Trading
What is Technical Trading?
Technical trading focuses on using historical price data, volume, and technical indicators to predict future price movements. Traders use charts and patterns instead of company fundamentals.
Key Tools in Technical Trading
Price Charts: Candlestick, line, bar charts.
Indicators: Moving averages, RSI, MACD, Bollinger Bands.
Chart Patterns: Head and Shoulders, Triangles, Double Tops, Flags.
Support and Resistance Levels: Key price points where stocks reverse.

Learn Institutional Trading Part-10What is Divergence?
Divergence occurs when the price of a stock and an indicator (like RSI, MACD, or momentum indicators) move in opposite directions. It is often considered a warning that the current trend may be losing strength.
Types of Divergence
Regular Divergence:
Indicates potential trend reversal.
Example: Price makes a new high, but RSI makes a lower high.
Hidden Divergence:
Indicates trend continuation.
Example: Price makes a higher low, but RSI makes a lower low.
How to Use Divergence
Combine with support and resistance levels.
Confirm with volume and candlestick patte

Why People Trade OptionsKey Components of Options
Strike Price: The pre-agreed price at which the option can be exercised.
Premium: The price you pay to buy the option contract.
Expiration Date: The date until which the option is valid.
Why People Trade Options
Leverage: Small investment, potential for large returns.
Hedging: Protects portfolio from losses.
Speculation: Betting on price movements.
Example
If a stock is currently priced at ₹500, you can buy a call option with a strike price of ₹550, expiring in one month, by paying a premium of ₹5. If the stock price rises to ₹600, you can buy at ₹550 and immediately sell at ₹600, making a profit.

Learn Institutional Trading Part-2What is Investing?
Investing involves committing your money to various assets like stocks, mutual funds, gold, real estate, or bonds to grow your wealth over time. Investing is generally a long-term strategy, focusing on the gradual accumulation of wealth.
Key Types of Investments
Stock Market Investments: Buying shares of companies.
Mutual Funds: Pooling money with other investors.
Bonds: Lending money to companies or governments for interest.
Gold & Real Estate: Physical assets that typically grow over time.
Investment Strategies
Value Investing: Buying undervalued stocks.
Growth Investing: Investing in companies with high growth potential.
Dividend Investing: Investing in companies that pay regular dividends.
Benefits of Investing
Builds wealth over time.
Helps fight inflation.
Provides financial security.

Learn Institutional Trading Part-4Technical Trading
Technical trading uses charts, patterns, and indicators to make decisions.
Traders study past price movements, volume, and signals to predict future trends instead of focusing on company financials.
Stock Market
The stock market is a place where shares of companies are bought and sold.
It’s like a big online shopping mall for stocks (e.g., NSE, BSE, NYSE). Prices go up and down based on demand, news, earnings, and investor emotions.

Learn Institutional Option Trading Part-1Risk and Return in Indian Investments:
Stock Market: High risk, high reward.
Mutual Funds: Moderate risk.
Fixed Deposits and Government Bonds: Low risk, lower returns.
Gold: Medium risk, often used as a hedge.
Factors Influencing Investment Choices:
Risk Appetite
Investment Horizon
Tax Benefits
Liquidity

Learn Institutional Option Trading Part-6Mutual Funds in India:
Mutual funds pool money from multiple investors and invest in a diversified portfolio.
Types:
Equity Mutual Funds
Debt Mutual Funds
Hybrid Funds
Index Funds & ETFs
Systematic Investment Plan (SIP) is a popular method to invest monthly with discipline.
Government Schemes:
PPF (Public Provident Fund)
NSC (National Savings Certificate)
EPF (Employees Provident Fund)
These are safe, tax-efficient, and suitable for conservative investors.

Learn Institutional Option Trading Part-5Stock Market Investing:
Stock investing involves buying shares of publicly traded companies listed on NSE or BSE.
Why Indians Invest in Stocks:
Potential for higher returns.
Dividend income.
Portfolio diversification.
Approaches to Investing:
Fundamental Analysis: Based on financial health, growth potential, and management quality.
Technical Analysis: Based on price patterns, volumes, and charts.
Long-Term Investing: Holding stocks for years to build wealth.
Short-Term Trading: Buying and selling stocks within days or weeks.

Learn Institutional Option Trading Part-4Recent Growth of Options in India:
Retail participation has surged.
Weekly expiry options (especially on Bank Nifty) have become extremely popular.
SEBI introduced lot size and margin regulations to control excessive speculation.
Investing in India
What is Investing?
Investing means allocating money into assets like stocks, mutual funds, bonds, gold, or real estate to earn returns over time.
Major Investment Options in India:
Equities (Shares)
Mutual Funds
Fixed Deposits
Public Provident Fund (PPF)
Gold (Physical and Digital)
Real Estate
Bonds and Debentures

Learn Institutional Option Trading Part-2Option Greeks in India:
Delta: Measures sensitivity to price changes.
Theta: Measures time decay.
Vega: Measures sensitivity to volatility.
Gamma: Measures change in Delta.
Indian traders use these Greeks to manage risk and optimize strategies.
Risks in Indian Option Trading:
Premium Decay: Loss in value as expiry approaches.
High Volatility: Can cause sudden losses.
Liquidity Risk: Some options have low trading volume.
Complexity: Requires deep market knowledge.

Learn Institutional Option Trading Part-10Popular Option Strategies in India:
Buying Call Options: Profit when the market rises.
Buying Put Options: Profit when the market falls.
Covered Call: Holding a stock and selling a call option to earn premiums.
Protective Put: Buying a put option to safeguard stock holdings.
Iron Condor: Earning from a range-bound market using multiple options.
Straddle and Strangle: Benefiting from high volatility.

Learn Institutional Option Trading Part-3In India, options are traded primarily on:
NSE (National Stock Exchange)
BSE (Bombay Stock Exchange)
The Securities and Exchange Board of India (SEBI) regulates the derivatives market and ensures fair practices.
Why is Option Trading Popular in India?
Leverage: Traders can control large positions with small capital.
Hedging: Investors use options to protect their portfolios from market fluctuations.
Income Generation: Strategies like covered calls can provide regular income.
Speculation: Traders can bet on price movements with limited risk.

Learn Advanced Institutional TradingOption trading is a part of the derivatives market where investors buy and sell contracts known as options. These contracts derive their value from an underlying asset, which can be a stock, index, commodity, or currency.
In India, the most commonly traded options are based on Nifty 50, Bank Nifty, and stocks like Reliance, TCS, Infosys, etc.
Options give traders the right, but not the obligation, to buy or sell the underlying asset at a predetermined price (strike price) before or on the expiry date.
Types of Options:
Call Option: Gives the buyer the right to buy the underlying asset.
Put Option: Gives the buyer the right to sell the underlying asset.

Option TradingIndia’s financial markets are rapidly evolving, and the participation of retail investors, institutions, and foreign players has significantly increased over the past two decades. Among various investment avenues, option trading, equity investing, and gold trading have become the most prominent ways of wealth creation and hedging against risks. Each of these segments has its unique importance, strategies, and regulatory frameworks in India.
This guide will help you understand the core concepts, market structure, strategies, and risks associated with Indian Option Trading, Equity Investing, and Gold Trading in a simple and practical manner.

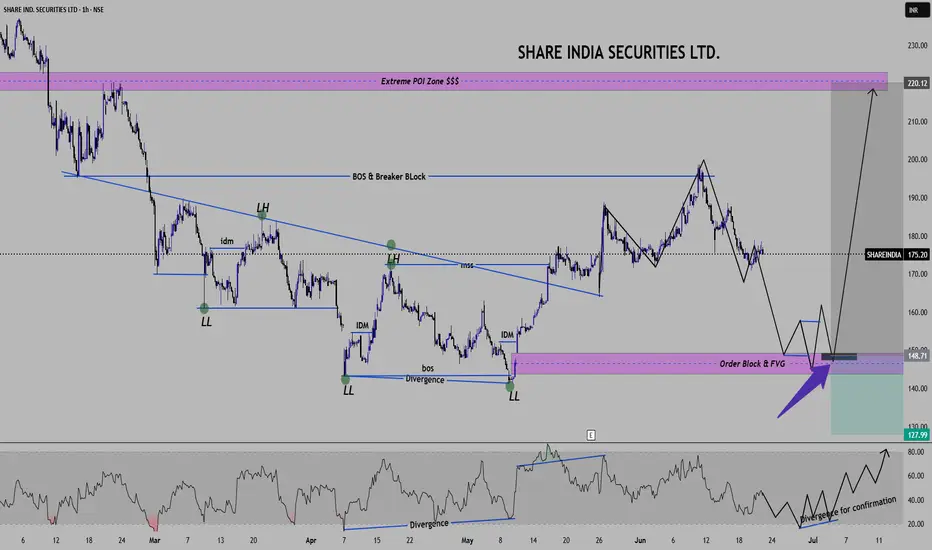
Share India Securities Ltd. ---- Deep AnalysisShare India Securities Ltd.
1. -----Company Technical Analysis Data
Analysis -- Based on ICT and SMC Concepts
TIME Frame -- 1 hour
Chart Elements & Observations ----
Market Structure -- 1. Clear bearish structure earlier with Lower Lows(LL) and Lower High(LH).
-- 2. Market Structure Shift (MSS) observed which indicates a possible reversal
-- 3. BOS(Break of structure) confirms shift from bearish to bullish bias.
Short Term Outlook (3-6 Weeks) ---
-- Price is currently retracing after recent high (190 levels)
-- We are projecting price to move down to the demand zone @150-160 levels followed by accumulation and reversal.
-- Short term plan is just watch price around 145-150, if price forms a liquidity sweep + Bullish structure then
this is a potential buy Zone.
-- RSI confirmation will strengthen this zone (here we will look for bullish divergence again.)
Short term trade plan -- Buy zone - 145-150 (after confirmation Liq. sweep, bullish engulfing candle and OB Tap)
Stop Loss - 135--138 (Liquidity Below demand)
Target -1 ---- 175 (Retest structure)
Target -2 ---- 190 (Recent High),
Target -3 -----220 (Extreme Liquidity Zone)
Keep note that ----- If price 148-145 demand zone fails then next Higher Time Frame demand may come near 135 levels.
All Traders and Market Influencers, Your Views or comments are most welcomed. Thank You.
==============================================================================
Institutions Option Database Trading Part-5 Risk Management in Option Trading
Even with data, risk control is key:
Max 2% capital risk per trade.
Hedge with opposite option.
Avoid low liquidity options.
Always track IV, PCR, OI live.
Building a Custom Option Scanner
With databases and logic, you can create a personal scanner for:
High IV options
OI breakout zones
PCR + Max Pain alert
Theta-rich expiry trades

Institutions Option Database Trading Part-4Advanced traders use machine learning to forecast:
Option price movement
Volatility changes
IV spikes before events
Popular Models:
Random Forest → Trend direction.
LSTM (Deep Learning) → Predict future IV.
Logistic Regression → Probability of ITM expiry.
These are trained on millions of past trades using structured databases.
