learn database trading with optionclub**Database Trading** refers to the practice of using databases and automated systems to analyze and trade financial markets, typically involving large amounts of data to make decisions. This method combines knowledge from both trading and database management, often leveraging historical data, real-time market information, and various quantitative models.
1. Basics of Database Trading**
**What is Database Trading?**
- Database trading involves the use of **databases** to collect, store, and analyze large amounts of financial market data.
- This data can be **historical**, **real-time**, or a combination of both.
- Traders use algorithms and statistical models that rely on data stored in these databases to make automated trading decisions.
**Basic Concepts**:
- **Market Data**: Prices, volumes, bids, asks, trades, etc., that are collected and stored in a database.
- **Historical Data**: Past price data used for backtesting trading strategies and understanding market behavior.
- **Real-Time Data**: Streaming data that includes up-to-the-second prices and news.
- **Data Sources**: Financial data can come from various exchanges, financial news sources, or APIs like Alpha Vantage, Quandl, or Yahoo Finance.
Key Components of a Database Trading System**:
- **Database Management System (DBMS)**: Software that manages the storage, retrieval, and manipulation of data.
- **Data Warehouse**: A large repository of historical data, typically used for long-term analysis.
- **Data Processing**: Cleaning and processing data to ensure it's accurate and ready for analysis (e.g., removing missing values, correcting errors).
- **Algorithmic Trading**: Writing algorithms to analyze data and execute trades based on predefined rules or patterns.
2. Learning Database Management and Data Storage**
To effectively implement database trading, you'll need to know how to store and manage data efficiently. Understanding how to use a **DBMS** is essential.
**Key Concepts in Database Management**:
- **SQL (Structured Query Language)**: SQL is the standard language for interacting with databases. It's used to query, manipulate, and analyze data.
- Example: Writing queries to extract price data for certain stocks.
- **Relational Databases**: Databases that store data in tables (e.g., MySQL, PostgreSQL).
- **NoSQL Databases**: Non-relational databases often used for more flexible data structures (e.g., MongoDB).
- **Data Normalization**: Structuring data so it's consistent and avoids redundancy.
**Common Tools**:
- **MySQL/PostgreSQL**: Popular relational databases for data storage.
- **SQLite**: A lightweight database, often used for smaller-scale projects.
- **MongoDB**: A NoSQL database for storing unstructured data.
- **Cloud Databases**: Such as AWS, Google Cloud, or Azure for scalable data storage solutions.
3. Data Analysis and Trading Algorithms**
Once you have the data stored in a database, the next step is learning how to analyze it and create **trading algorithms**. The analysis of market data is often done using quantitative methods.
**Quantitative Analysis**:
- **Technical Analysis**: Analyzing historical price movements and volume patterns to predict future price movements (e.g., moving averages, candlestick patterns).
- **Statistical Analysis**: Using statistical methods to identify trends, correlations, and price patterns. Techniques like **regression analysis** or **machine learning models** are commonly used.
- **Backtesting**: Testing a trading strategy using historical data to see how it would have performed in the past.
- Tools for backtesting: Backtrader, Zipline, QuantConnect.
**Learning How to Code Trading Algorithms**:
- **Python**: One of the most popular languages in finance for data analysis and algorithmic trading.
- Libraries: **pandas** (for data manipulation), **NumPy** (for numerical computing), **matplotlib** (for plotting data), **TA-Lib** (for technical analysis indicators).
- Example: Writing Python scripts to pull stock data from your database and apply technical indicators.
- **R**: Another language widely used in finance for statistical analysis and visualizations.
- **C++/Java**: Used in high-frequency trading, where low latency and fast execution times are critical.
4. Developing Trading Strategies**
**Algorithmic Trading Strategies**:
Here’s how you can develop and test various trading strategies using databases:
1. **Trend Following**:
- Using technical indicators like **Moving Averages** (e.g., SMA, EMA) to detect market trends.
- The algorithm buys when a stock price moves above a moving average and sells when it moves below.
2. **Mean Reversion**:
- Assumes that prices will return to their mean or average value.
- The algorithm buys when the stock is undervalued relative to its historical price and sells when it is overvalued.
3. **Statistical Arbitrage**:
- Identifies price discrepancies between related assets (e.g., two stocks in the same sector) and trades on that difference.
- Uses statistical models to predict price convergence or divergence.
4. **Machine Learning**:
- Implement machine learning models to predict future stock price movements based on historical data.
- Algorithms like **Random Forests**, **Support Vector Machines**, and **Neural Networks** can be used to train models for classification and regression tasks.
- You can use Python libraries like **scikit-learn**, **TensorFlow**, or **PyTorch** for building machine learning models.
*5. Real-Time Data and Automated Trading**
For **database trading**, real-time data is critical for executing trades promptly and accurately. Here’s how it works:
**Streaming Data**:
- **APIs**: You can use APIs from data providers like **Alpha Vantage**, **Quandl**, **Interactive Brokers**, or **IEX Cloud** to pull real-time market data into your database.
- **Web Scraping**: In some cases, data is scraped from news websites or financial reports.
**Trading Platforms**:
- **MetaTrader**: A popular trading platform for retail traders, often used for algorithmic trading with its own scripting language (MQL).
- **Interactive Brokers API**: A widely used API for automated trading, capable of executing trades and accessing market data.
- **QuantConnect/Quantopian**: Platforms where you can write, backtest, and execute algorithmic trading strategies.
**Setting Up Automated Trades**:
Once the system is built to pull data and analyze it, you can use **order execution** systems to automatically buy or sell stocks when certain conditions are met. This involves writing scripts or using platforms with API access for real-time execution.
6. Risk Management in Database Trading**
Effective risk management is critical to the success of a trading system. Key techniques include:
- **Stop Loss Orders**: Automatically sell a stock when it falls below a certain price to limit potential losses.
- **Position Sizing**: Determining how much capital to allocate to each trade based on risk tolerance and the strategy’s win rate.
- **Portfolio Diversification**: Spread risk by investing in multiple assets (stocks, ETFs, bonds, etc.).
### **7. Practice and Continuous Learning**
To truly master database trading, practice is essential. Here’s how you can improve your skills:
- **Paper Trading**: Simulate trades without risking real money. Many platforms like **Interactive Brokers** and **TradingView** offer this feature.
- **Backtest**: Always backtest your strategies using historical data before trading live.
- **Follow Market Trends**: Stay updated on news, trends, and innovations in trading and financial markets.
**Conclusion**
Database trading is a powerful tool for traders looking to automate their decision-making process and leverage large datasets for analyzing and predicting market movements. With knowledge in database management, coding, quantitative analysis, and algorithmic strategies, you can create automated trading systems that operate in real-time or backtest strategies using historical data.
Sensexanalysis

learning stock market basic to advance levelLearning the stock market from the basics to advanced levels is an exciting journey that requires a clear understanding of fundamental principles, effective strategies, and continuous learning.
1. Basic Stock Market Concepts**
**What is the Stock Market?**
- The **stock market** is a platform where buying and selling of shares (stocks) of publicly listed companies occurs. It helps businesses raise capital and allows investors to buy ownership in companies.
**Key Terms You Need to Know**:
- **Shares (Stocks)**: Units of ownership in a company.
- **Ticker Symbol**: A unique code used to identify a company's stock (e.g., AAPL for Apple).
- **Stock Exchange**: A marketplace where stocks are bought and sold (e.g., NYSE, NASDAQ).
- **Market Order**: A request to buy or sell a stock at the current market price.
- **Limit Order**: A request to buy or sell a stock at a specific price or better.
**Types of Stocks**:
- **Common Stocks**: Give shareholders voting rights and potential dividends.
- **Preferred Stocks**: Offer fixed dividends and priority over common stock in case of liquidation, but no voting rights.
#### **Basic Investment Concepts**:
- **Bull Market**: A period when the market is rising.
- **Bear Market**: A period when the market is falling.
- **Dividends**: A portion of a company's profit paid to shareholders.
#### **Types of Investors**:
- **Active Investors**: Individuals who buy and sell frequently, trying to outperform the market.
- **Passive Investors**: Investors who typically buy and hold stocks for the long term, often through index funds or mutual funds.
---
### **2. Intermediate Stock Market Strategies**
Once you're familiar with the basics, it's time to explore more intermediate concepts and strategies for investing and trading.
#### **Types of Stock Trading**:
- **Day Trading**: Involves buying and selling stocks within the same trading day.
- **Swing Trading**: Buying stocks and holding them for a few days or weeks to profit from short- to medium-term price moves.
- **Position Trading**: A longer-term strategy where you hold stocks for months or even years, based on company fundamentals and long-term trends.
#### **Technical Analysis** (For Traders):
Technical analysis involves using charts and historical data to forecast future price movements. Key tools include:
- **Candlestick Charts**: Visual representations of price movements over time.
- **Support and Resistance**: Levels where a stock price tends to reverse or pause.
- **Moving Averages**: Used to smooth out price data and identify trends (e.g., 50-day moving average).
- **RSI (Relative Strength Index)**: A momentum indicator that measures overbought or oversold conditions.
- **MACD (Moving Average Convergence Divergence)**: A tool to identify changes in the strength, direction, and momentum of a stock.
#### **Fundamental Analysis** (For Investors):
Fundamental analysis involves evaluating a company's financial health and future growth potential. Important metrics include:
- **Earnings Per Share (EPS)**: Measures a company’s profitability.
- **P/E Ratio (Price-to-Earnings)**: Shows how much investors are willing to pay for a dollar of earnings.
- **Dividend Yield**: The return on investment from dividends.
- **Debt-to-Equity Ratio**: Indicates how much debt a company has in relation to its equity.
- **Revenue Growth**: Measures a company’s ability to increase sales over time.
#### **Diversification and Portfolio Management**:
- **Diversification**: Spreading your investments across different assets (stocks, bonds, sectors, etc.) to reduce risk.
- **Asset Allocation**: Deciding how to divide your investments among various asset classes (stocks, bonds, real estate, etc.).
---
### **3. Advanced Stock Market Concepts and Strategies**
Once you’re comfortable with the basics and have some experience, it’s time to explore advanced stock market strategies and deeper financial concepts.
#### **Advanced Technical Analysis**:
- **Chart Patterns**: Recognizing formations like Head and Shoulders, Double Top/Bottom, Triangles, and Flags that predict future price movements.
- **Advanced Indicators**: Such as Bollinger Bands, Fibonacci Retracements, and Stochastic Oscillators.
- **Volume Analysis**: Understanding how trading volume supports or contradicts price movements.
#### **Options Trading**:
- **What is Options Trading?**: Involves buying or selling options (calls and puts) on stocks. Options allow you to hedge, speculate, or leverage your position.
- **Options Strategies**:
- **Covered Calls**: Sell a call option against a stock you own to generate additional income.
- **Protective Puts**: Buying a put option to protect against a drop in a stock you own.
- **Iron Condors**: A combination of four options contracts, designed to profit from low volatility.
#### **Leveraging and Margin Trading**:
- **Margin Trading**: Borrowing money from a broker to purchase more stocks than you could afford with your own capital. It increases potential profits but also amplifies losses.
- **Leveraged ETFs**: These are exchange-traded funds (ETFs) that use financial derivatives and debt to amplify the returns of an underlying index.
#### **Short Selling**:
- **What is Short Selling?**: Borrowing shares to sell them at the current price with the plan to buy them back at a lower price in the future.
- **Risks of Short Selling**: Unlimited risk if the stock price rises instead of falls, as you will have to buy back the stock at a higher price.
---
### **4. Risk Management and Behavioral Finance**
Understanding and managing risk is crucial at any level of investing.
#### **Risk Management**:
- **Stop-Loss Orders**: Setting predetermined price levels to automatically sell a stock and limit your loss.
- **Position Sizing**: Determining how much capital to allocate to each trade based on risk tolerance.
- **Hedging**: Using options, futures, or inverse ETFs to protect against potential losses.
*Psychology of Trading** (Behavioral Finance):
- **Fear and Greed**: Recognizing how emotions can drive market behavior and lead to poor decisions.
- **Loss Aversion**: The tendency to fear losses more than valuing gains, which can prevent effective decision-making.
- **Confirmation Bias**: Seeking information that confirms your existing beliefs about a stock, leading to biased decisions.
**5. Developing Your Own Strategy and Continued Learning**
The stock market is constantly evolving, so continuous learning is important. Consider:
- **Backtesting**: Testing your strategies against historical data to see how they would have performed.
- **Simulated Trading**: Use platforms that offer paper trading (simulated trading with fake money) to practice your skills.
- **Staying Updated**: Follow financial news, reports, earnings announcements, and trends to remain informed.
**6. Resources for Continued Learning**
Here are some resources to help you expand your stock market knowledge:
- **Books**:
- *“The Intelligent Investor”* by Benjamin Graham (for value investing)
- *“A Random Walk Down Wall Street”* by Burton Malkiel (for a broad market perspective)
- *“How to Make Money in Stocks”* by William J. O'Neil (for growth investing)
- **Online Courses**: Websites like Coursera, Udemy, and Khan Academy offer courses on stock trading and investing.
- **Websites**: Follow financial news on sites like Bloomberg, Reuters, and CNBC for updates on the market.
- **Forums**: Engage with communities like r/stocks on Reddit or StockTwits to learn from other traders and investors.

learn option trading with optionclub (basic to advance)#1. Basics of Options Trading**
**What are Options?**
- **Option**: A financial contract that gives the buyer the right (but not the obligation) to buy or sell an underlying asset (like stocks) at a specific price before a certain expiration date.
- **Two Types of Options**:
- **Call Option**: The right to buy an asset at a specific price (strike price).
- **Put Option**: The right to sell an asset at a specific price.
**Important Terms to Know:**
- **Strike Price**: The price at which the underlying asset can be bought or sold.
- **Expiration Date**: The date the option contract expires.
- **Premium**: The price paid to purchase the option.
- **In-the-Money (ITM)**: When the option has intrinsic value.
- **Out-of-the-Money (OTM)**: When the option has no intrinsic value.
- **At-the-Money (ATM)**: When the option's strike price is equal to the underlying asset's price.
**Basic Option Buying Strategies**:
- **Buying Calls**: You buy a call option if you expect the price of the underlying asset to go up. This gives you the right to buy the asset at a set price (strike price).
- **Buying Puts**: You buy a put option if you expect the price of the underlying asset to fall. This gives you the right to sell the asset at a set price.
#Key Takeaways**:
- Options give you the flexibility to profit from both rising and falling markets.
- The risk with buying options is limited to the premium you pay for the option.
2. Intermediate Strategies**
Once you understand the basics, it's time to explore more complex strategies.
#Covered Calls**:
- **What It Is**: A strategy where you hold the underlying stock and sell a call option against it.
- **How It Works**: This strategy generates income through the premium received from selling the call option while keeping your stock. It’s ideal when you expect the stock to remain relatively flat or have slight gains.
#Protective Puts**:
- **What It Is**: A strategy used as insurance. You buy a put option on a stock you own.
- **How It Works**: If the stock price falls, the put option increases in value, helping to offset potential losses from the stock.
#Straddles & Strangles**:
- **Straddle**: Buy both a call and a put option at the same strike price and expiration date. This is useful when you expect significant price movement but aren't sure in which direction.
- **Strangle**: Similar to a straddle, but the strike prices for the call and put are different. It’s a more flexible, but often cheaper, strategy than a straddle.
Vertical Spreads**:
- **What It Is**: A strategy where you buy and sell options of the same type (puts or calls) on the same asset with different strike prices but the same expiration date.
- **How It Works**: The goal is to profit from a price movement within a specific range, and the risk is limited compared to buying individual options.
---
3. Advanced Options Trading Strategies**
As you get more experienced, you can implement more advanced strategies that involve multiple legs and combine different option contracts.
Iron Condors**:
- **What It Is**: A non-directional strategy that combines two vertical spreads: a bear call spread and a bull put spread. It profits from low volatility.
- **How It Works**: You sell a call and a put with a strike price outside the current price range and buy further out-of-the-money options as a hedge. This is a strategy to profit when you expect the price of the underlying asset to stay within a narrow range.
Butterfly Spreads**:
- **What It Is**: A neutral strategy that involves buying and selling calls or puts at three different strike prices.
- **How It Works**: You buy one option at a lower strike price, sell two options at a middle strike price, and buy one option at a higher strike price. This strategy benefits from minimal price movement in the underlying asset.
Calendar Spreads**:
- **What It Is**: A strategy where you buy and sell options with the same strike price but different expiration dates.
- **How It Works**: You sell a short-term option and buy a longer-term option with the same strike price. This can help you take advantage of time decay on the short leg.
4. Advanced Risk Management**
As you dive deeper into options trading, you need to understand risk management to protect your capital. This includes:
- **Position Sizing**: Determining how much capital to allocate to each trade.
- **Stop Loss Orders**: Setting predefined points at which you'll exit a position to limit losses.
- **Volatility**: Understanding implied volatility (how much a stock is expected to move) and historical volatility (how much it has moved in the past).
5. Using Technical and Fundamental Analysis in Options Trading**
- **Technical Analysis**: Focuses on analyzing past market data, primarily price and volume, to predict future price movements. Popular tools include moving averages, RSI (Relative Strength Index), MACD, and support/resistance levels.
- **Fundamental Analysis**: Involves analyzing the financial health and performance of a company. Important factors include earnings reports, balance sheets, and market trends.
6. Practice and Learn by Doing
Once you've learned the strategies, the best way to solidify your knowledge is through **practice**. Consider:
- **Paper Trading**: Many brokers offer simulated trading environments where you can practice without risking real money.
- **Small Live Trades**: Start with small amounts of capital in a live account to gain experience.
- **Backtesting**: Test strategies against historical data to see how they would have performed.
**7. Continuous Learning**
Options trading is a dynamic field, and markets evolve. Keep learning by:
- **Following Market News**: Stay up-to-date on financial news and trends that affect the markets.
- **Taking Advanced Courses**: Many platforms offer courses on options strategies.
- **Engaging with a Trading Community**: Join forums, webinars, or communities to share ideas and strategies with other traders.
---
By following this structured approach, you'll move from a beginner to an advanced options trader. With practice and continuous learning, you’ll be able to develop strategies tailored to your risk tolerance and market outlook.

Learning database trading with skytradingzone **What is Database Trading?**
Database trading involves using **databases** filled with historical and real-time market data to design trading strategies. You’ll analyze things like stock prices, trading volumes, and other financial indicators to spot patterns that might suggest future price movements.
Think of it as using **data** to inform your trades rather than just relying on intuition or news. You’re letting the **numbers speak** for themselves.
**How Does It Work?**
1. **Collect Data**:
You gather huge amounts of **historical market data** (like stock prices, volumes, economic indicators, etc.) and **real-time data** (like live stock prices and news updates). This data forms your **database**.
2. **Store Data in Databases**:
You store this data in databases that allow for **quick retrieval and analysis**. Popular databases used in trading include **SQL databases**, **NoSQL**, and **data warehouses**.
3. **Data Analysis**:
Traders use tools and algorithms to **analyze** this data. They look for patterns, correlations, or trends that can indicate when a stock is likely to go up or down.
4. **Backtesting**:
Once you’ve analyzed the data and developed a strategy, you can **backtest** it. Backtesting means running your trading strategy on historical data to see if it would have worked in the past. If the strategy performs well historically, it may be worth trying in real-life trading.
5. **Automated Trading**:
The real magic happens when you combine database trading with **algorithmic trading**. This means creating an **automated system** that places trades based on the data analysis. For example, the system could automatically buy a stock when certain conditions are met (like when a stock’s price is below its moving average).
**Key Components of Database Trading**
1. **Data Collection**
- You need access to reliable market data, like stock prices, volume, indicators, news, etc.
- **API (Application Programming Interface)**: APIs are commonly used to pull live data from sources like **Yahoo Finance**, **Quandl**, or even stock exchanges.
2. **Data Storage and Management**
- You need a structured way to **store and manage** this data. Databases help with storing large amounts of information, and tools like **SQL** or **Python libraries (e.g., pandas)** can help manipulate and analyze the data.
3. **Data Analysis and Algorithm Development**
- Once the data is collected, it’s all about **finding patterns** or correlations. Traders can use machine learning, statistical analysis, or even AI to make predictions based on historical trends.
- **Popular analysis tools**: **Python**, **R**, and **Matlab** are widely used for analysis. They help you build models that predict market trends or identify arbitrage opportunities.
4. **Backtesting**
- Before going live with your strategy, you backtest it against historical data to ensure it’s profitable and safe. This helps you see whether your algorithm works in different market conditions (bullish, bearish, or sideways).
5. **Automated Trading Systems**
- Once you're confident with the strategy, you can use automated trading systems or **bots**. These systems can automatically place trades based on the rules you’ve programmed.
**Why is Database Trading Important?**
1. **Speed and Efficiency**:
Database trading allows you to make **faster decisions** than a human trader could, especially when combined with automated trading. The system can analyze data and execute trades in milliseconds.
2. **Data-Driven Decisions**:
Instead of relying on guesses or emotions, you’re making decisions based on hard data. This increases your **chances of success** and helps you avoid costly mistakes.
3. **Backtesting and Optimization**:
You can backtest your strategies, meaning you can test them on historical data before using real money. This gives you a lot of confidence in the strategy.
4. **Scalability**:
Once you’ve developed a successful database trading strategy, you can scale it easily. You can start trading small amounts, and as you gain experience, increase your trading volume with minimal risk.
**Example of a Simple Database Trading Strategy**
Let’s say you want to create a strategy that buys a stock if:
1. The stock price is above its **200-day moving average** (indicating it’s in an uptrend).
2. The **relative strength index (RSI)** is below 30 (indicating it might be oversold and due for a bounce).
You would:
1. **Collect historical stock price data** for the last year.
2. Use **SQL** or a **Python script** to compute the 200-day moving average and the RSI for each stock.
3. **Backtest** the strategy to see if it would have worked in the past.
4. Once you’re confident it’s a solid strategy, you can **automate** it to trade for you.
**Tools Used in Database Trading**
- **Databases**: SQL, NoSQL, MongoDB
- **Programming Languages**: Python, R, JavaScript
- **Libraries/Frameworks**: Pandas, NumPy, TensorFlow (for machine learning), scikit-learn
- **Backtesting Platforms**: QuantConnect, Backtrader
- **Automated Trading Platforms**: MetaTrader, Interactive Brokers API
**Conclusion**
Database trading allows you to make **data-driven** decisions rather than relying on gut feelings. By leveraging data analysis, backtesting, and automated trading systems, you can develop strategies that are more **efficient** and **profitable**.

learning option trading basic to advance Sure! Here’s a simplified version in a more engaging format, designed to be clear and easy to understand.
---
### **What is Options Trading?**
Options trading can sound complex, but at its core, it's a way to buy and sell the **right** to trade an asset at a set price by a certain date. **Think of it like reserving a chance to make a deal later**.
---
### **Basic Concepts You Need to Know**
#### **What is an Option?**
An option is a contract that gives you the **right** (but not the obligation) to **buy** or **sell** a stock at a specific price, on or before a specific date.
#### **Two Types of Options:**
1. **Call Option** – This gives you the right to **buy** the stock.
2. **Put Option** – This gives you the right to **sell** the stock.
---
### **Key Terms to Understand**
- **Strike Price**: The price you agree to buy or sell the stock at.
- **Expiration Date**: The deadline by which you must use your option.
- **Premium**: The price you pay to buy the option.
#### Example:
- You buy a **Call Option** for Stock ABC at a strike price of $100. If the stock goes up to $120, you can still buy it at $100.
- You buy a **Put Option** for Stock ABC at a strike price of $100. If the stock drops to $80, you can still sell it for $100.
---
### **How Options Work**
When you buy an option, you're betting on whether the stock's price will **go up** (if you buy a call) or **go down** (if you buy a put).
**In the Money (ITM)**: The option has value – your bet is working.
**Out of the Money (OTM)**: The option has no value – your bet is losing.
**At the Money (ATM)**: The stock price is the same as the strike price.
**Intermediate Strategies to Try**
Once you understand the basics, you can explore different strategies:
1. **Covered Call**:
- You **own the stock** and sell a **call option**. You earn extra income but limit how much you can gain if the stock goes up.
2. **Protective Put**:
- You **own the stock** and buy a **put option** to protect against losses if the stock price drops.
3. **Straddle**:
- You buy both a **call and a put** option with the same strike price. You bet that the stock will **move a lot**, but you don’t know in which direction.
4. **Strangle**:
- Similar to a straddle, but you buy the **call and put options** with **different strike prices**. It's cheaper but requires a bigger move in the stock to profit.
**Advanced Strategies**
1. **Iron Condor**:
- You sell an **out-of-the-money** call and put while buying more distant calls and puts. You profit if the stock stays **within a range**.
2. **Butterfly Spread**:
- You use three different strike prices to make a **bet on low volatility**, hoping the stock stays within a certain price range.
**Important Points to Know**
**Time Decay**
The value of your option decreases over time as it gets closer to the expiration date. The closer you get to expiration, the less time there is for the stock to move in your favor.
#### **Implied Volatility**
This is a measure of how much the stock is expected to move in the future. If volatility is high, option prices will be more expensive.
**Risk vs Reward**
- **For Buyers**: The most you can lose is the **premium** you paid. However, your potential profit is **unlimited** (if the stock moves significantly in your favor).
- **For Sellers**: You earn a premium but your potential loss can be **unlimited** (if the stock moves against you significantly).
**Final Thoughts**
Options trading can be a great way to make money if done right, but it requires a good understanding of **risk management**. Always be mindful of your **capital**, set **stop-losses**, and only trade with money you’re willing to lose.

What is price action and how to use it ?Price action refers to the movement of a financial asset's price over time. It’s a method of technical analysis that focuses on reading the market through price movements rather than relying on indicators or fundamental analysis. Traders who use price action study how price behaves on charts to predict future movements.
Here’s a breakdown of how to use price action:
1. **Understanding Candlestick Patterns**
Candlesticks represent price movements within a specific time period. A candlestick chart provides information about the opening, closing, highest, and lowest prices. Common price action patterns include:
- **Doji**: Suggests indecision in the market.
- **Engulfing Patterns**: A reversal pattern where a larger candle completely engulfs the previous one.
- **Pin Bar**: Indicates a potential reversal after a strong price movement.
2. **Support and Resistance Levels**
These are key horizontal levels where price tends to reverse or consolidate. Traders use price action to spot these areas and make decisions. For example:
- **Support**: Price tends to stop falling and might bounce back up.
- **Resistance**: Price tends to stop rising and might reverse downward.
3. **Trend Lines**
Trend lines are drawn by connecting higher lows (for uptrends) or lower highs (for downtrends). These lines help to visualize the direction of the market. Price action traders will look for price to stay above or below these trend lines, indicating strength or weakness in the trend.
4. **Breakouts**
Breakouts occur when the price moves beyond key support or resistance levels, often indicating the start of a strong trend. Traders use price action to confirm breakouts through candlestick patterns or volume analysis.
5. **Price Patterns**
Patterns like triangles, channels, and head and shoulders provide insight into potential price moves. By analyzing these formations, price action traders can predict whether a trend is likely to continue or reverse.
6. **Time Frames**
Price action can be applied across various time frames, from minutes (scalping) to hours or even daily (swing trading). Traders typically align their strategy with their trading time horizon.
7. **Risk Management**
With price action, traders often use strategies like setting stop losses based on recent swing highs or lows. This helps in managing risk and ensuring they exit trades before significant losses occur.
8. **Patience and Practice**
Successful price action trading requires understanding market psychology and being patient for the right setups. It's often about waiting for a confirmation of a move rather than reacting to every price fluctuation.

What is rsi and how to use it ?RSI stands for **Relative Strength Index**, which is a momentum oscillator used in technical analysis to measure the speed and change of price movements. It is primarily used to identify whether an asset is overbought or oversold, helping traders make decisions about potential buy or sell opportunities.
### Key Points About RSI:
- **Scale**: RSI ranges from 0 to 100.
- **Overbought and Oversold Levels**:
- **Overbought**: When RSI is above 70, the asset is considered overbought, meaning it may be overvalued and could see a price reversal downward.
- **Oversold**: When RSI is below 30, the asset is considered oversold, meaning it might be undervalued and could see a price reversal upward.
### How to Use RSI:
1. **Identifying Overbought/Oversold Conditions**:
- **Overbought (RSI > 70)**: This suggests the asset may have been overbought, and a pullback or price reversal might occur. Traders might consider selling or shorting.
- **Oversold (RSI < 30)**: This suggests the asset may be oversold, and a rebound or price reversal might happen. Traders might consider buying.
2. **RSI Divergence**:
- **Bullish Divergence**: When the price makes new lows, but RSI forms higher lows, this can indicate a potential upward reversal or buying opportunity.
- **Bearish Divergence**: When the price makes new highs, but RSI forms lower highs, this may signal a potential downward reversal or selling opportunity.
3. **RSI and Trend Strength**:
- RSI can also help assess trend strength. For example, during a strong uptrend, the RSI might stay above 40-50 and consistently test the overbought zone. Similarly, in a strong downtrend, the RSI may hover below 60 and frequently test oversold conditions.
4. **RSI and Trend Reversals**:
- When the RSI crosses back above the 30 level (from below), it can signal the start of an uptrend (bullish reversal).
- When the RSI crosses back below the 70 level (from above), it can signal the start of a downtrend (bearish reversal).
### Practical Example of Using RSI:
- **Example 1: Overbought Condition**:
- Let's say a stock has an RSI of 75. This indicates it’s overbought, suggesting that a price pullback or correction might be on the horizon. Traders might consider selling or taking profits at this point.
- **Example 2: Oversold Condition**:
- If the RSI of a stock is 25, it indicates the stock is oversold and could be undervalued. Traders might look for a buying opportunity, anticipating that the price may rise.
### Limitations:
- RSI is more useful in ranging (sideways) markets than in trending markets. In strong trends, RSI may stay overbought or oversold for extended periods without reversing.
- RSI signals should ideally be combined with other indicators or chart patterns for confirmation.

What is database trading and how it is been done ?**Database trading** refers to the process of buying and selling databases or data-related products, often for financial or commercial purposes. This could involve trading large datasets, data assets, or even the rights to access and use specific data. In financial contexts, it could also refer to trading information or algorithms derived from data for making investment decisions. Here's a breakdown of how database trading works and its typical applications:
### 1. **Types of Database Trading**:
- **Market Data Trading**: Traders can buy and sell real-time or historical market data, which includes stock prices, market indexes, commodity data, etc. This data is used for algorithmic trading, backtesting, and prediction purposes.
- **Data as a Service (DaaS)**: Companies often sell access to databases as a subscription or pay-per-use model. For example, accessing consumer behavior data, demographic information, and financial data.
- **Financial Data**: Financial institutions can trade proprietary datasets, like trading algorithms or high-frequency trading systems. Firms often buy or sell these datasets to improve their trading strategies or decision-making processes.
- **Alternative Data**: Beyond traditional financial data, alternative data (e.g., satellite imagery, social media sentiment, web scraping data) is increasingly used for market analysis and trading. These datasets can be sold or traded among companies that are looking for an edge in their investment strategies.
### 2. **How Database Trading is Done**:
- **Data Acquisition**: Traders or firms acquire valuable datasets from various sources. This can include public data, proprietary data, or data bought from third-party providers.
- **Data Integration & Cleansing**: Before trading data, it’s often cleaned, structured, and integrated into usable formats, especially for algorithmic or quantitative analysis. This step ensures the data is accurate, reliable, and ready for trading.
- **Trading Strategies**: Many trading firms rely on databases to identify patterns or to train machine learning models. For example, a hedge fund might use historical trading data, macroeconomic data, or even social media trends to predict stock price movements. These strategies are often automated using algorithms.
- **Platforms for Data Trading**: There are marketplaces and platforms where traders or businesses can buy or sell data. Examples include Quandl, Xignite, or even specialized marketplaces for alternative data (like Data & Sons, or Snowflake). These platforms allow users to trade data in a secure, streamlined manner.
- **Pricing**: The value of a dataset is based on its uniqueness, accuracy, and potential for generating insights. Some data can be very costly, especially real-time financial data, while others might be more affordable but provide valuable insights for specific use cases.
### 3. **Tools and Technologies**:
- **Big Data Analytics**: Trading systems often leverage big data technologies, such as Hadoop, Spark, or cloud-based solutions like AWS and Google Cloud, to analyze massive datasets and derive insights that inform trading decisions.
- **Machine Learning**: Machine learning algorithms are commonly applied to data sets to find patterns, forecast trends, or make predictions that drive trading strategies.
- **Blockchain**: In some cases, data transactions are executed on blockchain networks, ensuring transparency, security, and traceability in how data is traded.
- **Cloud Computing**: Data storage and processing are often conducted through cloud platforms, allowing for real-time access to large datasets and reducing the need for physical infrastructure.
### 4. **Risks and Challenges**:
- **Data Privacy & Security**: Trading datasets that contain sensitive or personal information might pose security and legal risks. For instance, selling consumer data without proper consent can violate privacy laws (e.g., GDPR, CCPA).
- **Data Quality**: Poor-quality or incomplete data can lead to inaccurate insights or wrong trading decisions. Ensuring the integrity of the data is crucial.
- **Market Oversaturation**: In some cases, large datasets can become commoditized, reducing their value. This can happen when data sources become widely available, or when traders misuse or flood the market with too much data.
In summary, **database trading** is a practice where data, whether it’s financial, market, or alternative data, is bought, sold, or used for trading strategies. It often involves sophisticated technologies and platforms, but it also comes with various risks that need careful management.

WHat is option chain and how to use it ?What is an Option Chain?
An **Option Chain** is a list of all the available **options contracts** (both calls and puts) for a specific underlying asset, like a stock, index, or commodity. It provides detailed information about the various strike prices, expiration dates, and other vital data that traders use to make informed decisions.
The **Option Chain** helps you track options for a particular asset (e.g., a stock) and provides data such as:
- **Strike Price**: The price at which the underlying asset can be bought or sold when the option is exercised.
- **Call Options**: Options that give the buyer the right to **buy** the underlying asset at the strike price.
- **Put Options**: Options that give the buyer the right to **sell** the underlying asset at the strike price.
- **Expiration Date**: The date on which the option expires.
- **Open Interest (OI)**: The total number of outstanding contracts that have not been exercised or closed.
- **Volume**: The number of contracts traded on that day.
- **Implied Volatility (IV)**: The expected volatility of the underlying asset.
- **Bid and Ask Price**: The buying and selling prices for the options contracts.
- **Premium**: The price you pay to buy an option.
---
### How to Read an Option Chain
Here’s an example of an Option Chain:
| Strike Price | Call Bid | Call Ask | Call Volume | Put Bid | Put Ask | Put Volume | OI (Open Interest) | IV (Implied Volatility) |
|--------------|----------|----------|-------------|---------|---------|------------|--------------------|-------------------------|
| 100 | 2.50 | 2.80 | 500 | 1.20 | 1.50 | 300 | 10,000 | 20% |
| 110 | 1.10 | 1.30 | 400 | 3.00 | 3.30 | 350 | 8,000 | 18% |
| 120 | 0.60 | 0.80 | 250 | 5.10 | 5.30 | 200 | 6,500 | 22% |
#### Key Columns:
- **Strike Price**: The price at which the underlying asset can be bought or sold.
- **Call/Put Bid/Ask**: The prices at which traders are willing to buy (bid) or sell (ask) the options.
- **Call/Put Volume**: The number of contracts traded for that specific strike price.
- **Open Interest (OI)**: Total open contracts that are currently active, indicating market interest in those strike prices.
- **Implied Volatility (IV)**: A measure of the expected future volatility of the underlying asset, which affects option pricing.
---
### How to Use an Option Chain in Trading
An Option Chain is a valuable tool for traders because it provides a comprehensive view of the options market and can help you make more informed decisions. Here's how to use it effectively:
---
#### 1. **Identifying Support and Resistance**
- **Open Interest**: Look for strike prices with the highest open interest (OI) in both calls and puts. High OI levels often represent key support and resistance levels. If a stock is trending upward and you see large open interest at a particular strike price on calls, that could act as **resistance**. Conversely, large OI on put options can act as **support** if the price is trending down.
- **Volume**: High volume near certain strike prices shows where market participants are most active and might be important levels for price movement.
#### 2. **Market Sentiment Analysis (PCR)**
- Use the **Put-Call Ratio (PCR)** derived from the option chain to understand market sentiment. A high PCR (more puts than calls) suggests bearish sentiment, while a low PCR indicates bullish sentiment.
- A **high PCR** can sometimes indicate an **overbought or oversold** market, especially when the ratio is unusually high, suggesting a potential reversal.
#### 3. **Price Prediction with Implied Volatility (IV)**
- **Implied Volatility (IV)** is a critical metric found in the Option Chain. If the IV is high, it means traders are expecting high price movements (volatility) in the underlying asset. Conversely, low IV suggests low expected movement. If you expect a big move, you might want to buy options. If IV is high and you expect little movement, you might want to sell options to take advantage of the higher premium.
#### 4. **Assessing Liquidity**
- **Bid-Ask Spread**: Look at the difference between the **bid** and **ask** price of the options. A narrow spread means there’s good liquidity, making it easier to enter and exit positions. A wide bid-ask spread may indicate low liquidity, which could make trading more expensive.
#### 5. **Choosing the Right Strike Price**
- Use the option chain to choose a **strike price** that fits your trading strategy:
- If you're expecting a **small move**, you might prefer an option with a **strike price close to the current price** (ATM – At the Money).
- For a **larger move**, you might choose **out-of-the-money (OTM)** options (with strike prices further away from the current price) for cheaper premiums and larger potential profits.
- **In-the-money (ITM)** options will have intrinsic value and are typically more expensive, but they are safer if you expect the asset to move in the desired direction.
#### 6. **Volume and Open Interest**
- **Volume** indicates the number of contracts traded in a given time period (usually a day), helping you gauge the level of interest in a specific option contract.
- **Open Interest** refers to the number of contracts that have not been closed or exercised. High OI means more contracts are open, which can indicate a stronger trend or sentiment toward that strike price.
---
### Practical Example of Using the Option Chain
Let’s say you’re looking at a stock, XYZ, which is currently trading at $100. You open its Option Chain and see the following:
| Strike Price | Call Bid | Call Ask | Call Volume | Put Bid | Put Ask | Put Volume | OI (Open Interest) | IV (Implied Volatility) |
|--------------|----------|----------|-------------|---------|---------|------------|--------------------|-------------------------|
| 95 | 5.00 | 5.20 | 1,500 | 1.10 | 1.30 | 1,000 | 10,000 | 20% |
| 100 | 3.50 | 3.70 | 2,000 | 2.00 | 2.20 | 1,500 | 15,000 | 22% |
| 105 | 1.80 | 2.00 | 1,200 | 4.00 | 4.20 | 1,200 | 12,000 | 25% |
- **Strike Price 100 (ATM)**: Both the call and put options at this strike price have high volume and open interest. The implied volatility (IV) is also moderate at 22%, suggesting moderate price movement expectations. Traders may expect XYZ to stay around this level.
- **Strike Price 95 (ITM)**: The call option at 95 is priced higher due to the stock being close to or above this price. It has high open interest, suggesting it could act as a strong **support** level for the stock.
- **Strike Price 105 (OTM)**: The put options here have higher IV (25%) and a significant price difference from the underlying asset. This could indicate expectations of a potential downturn if the price falls, but the probability of profit is lower due to it being out-of-the-money.
Conclusion
An **Option Chain** is an invaluable tool for options traders, as it helps assess various factors, such as liquidity, market sentiment, volatility, and potential price movements. By studying the option chain carefully, you can:
- Identify key levels of support and resistance
- Analyze the market sentiment through the put-call ratio (PCR)
- Make better decisions regarding which strike prices and expiration dates to choose
- Gauge the liquidity and volatility expectations for options contracts

what is pcr and how to use it in trading ?### What is PCR (Put-Call Ratio)?
The **Put-Call Ratio (PCR)** is a popular market sentiment indicator used in options trading. It is calculated by dividing the total open interest (OI) of **puts** by the total open interest of **calls**. It helps traders understand whether the market sentiment is bullish, bearish, or neutral, based on the relative buying activity in put and call options.
#### **Formula**:
\
- **Put options**: Give the right to sell an asset at a specified price within a set time frame.
- **Call options**: Give the right to buy an asset at a specified price within a set time frame.
### How to Interpret PCR?
1. **PCR > 1**: This suggests there are more puts than calls. It generally indicates **bearish** sentiment, meaning traders expect the market to go down. A high PCR can signal that traders are hedging against a market decline or speculating that the market will drop.
2. **PCR < 1**: This suggests there are more calls than puts, which typically indicates **bullish** sentiment. Traders are expecting the market to rise, as there is more demand for buying options (calls) than for selling options (puts).
3. **PCR = 1**: This suggests a neutral market sentiment, where the number of put and call options is the same. The market could be in a balanced state with no strong bias in either direction.
4. **Extremely High PCR**: If the PCR value is very high (e.g., 1.5 or above), it could indicate that the market is **overly bearish**, and a market reversal might be imminent. This can signal a potential buying opportunity.
5. **Extremely Low PCR**: If the PCR is very low (e.g., below 0.5), it could indicate that the market is **overly bullish**, and there may be a correction or pullback ahead.
---
### How to Use PCR in Trading
#### 1. **Sentiment Indicator**:
- **Bullish Signal**: If the PCR is low (e.g., below 0.5), it indicates that more traders are betting on a market rise (via calls). It’s often used as a signal that the market might be in an overbought condition and could correct soon.
- **Bearish Signal**: If the PCR is high (e.g., above 1), it suggests that more traders are betting on a market decline (via puts). This could indicate an oversold market and a potential for a rebound or upward movement in the market.
#### 2. **Contrarian Indicator**:
- **Extremely High PCR**: When the PCR rises too much (indicating too many put options), it could mean the market is too bearish, and a **contrarian approach** might be useful. Traders might interpret this as a signal that the market is oversold and due for a reversal.
- **Extremely Low PCR**: When the PCR falls too low (indicating too many call options), it may signal over-optimism in the market, which could be a warning that a **correction** is coming soon.
#### 3. **Confirmation Tool**:
- **Use with other indicators**: PCR alone should not be relied upon for making trading decisions. It works best when combined with other technical or fundamental analysis indicators (e.g., moving averages, RSI, MACD). For instance, if you see a high PCR and the market is oversold according to technical indicators, it could confirm that a reversal is likely.
#### 4. **Market Extremes**:
- **Overbought/Oversold Conditions**: A **very low PCR** (more call buying than put buying) suggests market optimism and can be seen as overbought. A **very high PCR** suggests market pessimism and can be seen as oversold. In these cases, a reversal or a price correction could be expected.
#### Example of Trading Strategy Using PCR:
- **Bullish Setup**: PCR rises significantly, signaling excessive bearish sentiment. Technical indicators show oversold conditions (e.g., RSI below 30). You could consider buying calls or entering long positions with a higher probability of a market reversal.
- **Bearish Setup**: PCR is low, indicating excessive bullish sentiment, while technical indicators like RSI suggest the market is overbought. You could consider selling calls, buying puts, or entering short positions in anticipation of a market correction.
### Example of PCR Calculation:
Let’s say you are analyzing a stock option market:
- Total Open Interest in Puts = 200,000 contracts
- Total Open Interest in Calls = 500,000 contracts
PCR would be:
\
This low PCR (below 1) indicates a **bullish** sentiment in the market, with more traders expecting the market to rise.
---
### Key Points to Remember:
- **PCR is a sentiment tool**, not a direct price predictor.
- A **PCR above 1** typically indicates **bearish** sentiment, while **below 1** indicates **bullish** sentiment.
- An **extremely high or low PCR** might suggest market **extremes**, potentially indicating an upcoming reversal.
- **Use PCR in combination** with other technical and fundamental indicators to enhance decision-making.
In short, PCR provides a snapshot of market sentiment, and when used correctly, it can help traders make better-informed decisions, especially for understanding broader market trends or finding contrarian trading opportunities.

learn fundamental analysis basic to advancelearn Fundamental Analysis from **basic to advanced**:
---
### **1. Basic Concepts of Fundamental Analysis**
#### a. **What is Fundamental Analysis?**
Fundamental analysis is the process of evaluating a company's financial health, industry position, and the overall economy to determine the true value of a stock or other financial asset.
#### b. **Key Areas of FA:**
- **Macroeconomic Factors**: Interest rates, inflation, GDP growth, unemployment, and fiscal policies.
- **Industry Analysis**: Understanding the sector in which the company operates and how it affects the company’s performance.
- **Company Analysis**: Evaluating a company’s financial health through its financial statements, management, competitive position, and future prospects.
#### c. **Key Financial Statements:**
- **Income Statement**: Shows profitability over a period (Revenue, Costs, Profit).
- **Balance Sheet**: Provides a snapshot of a company’s assets, liabilities, and equity.
- **Cash Flow Statement**: Details the inflows and outflows of cash, indicating the company’s liquidity.
---
### **2. Intermediate Level: Ratios & Metrics**
#### a. **Earnings Metrics:**
- **Earnings Per Share (EPS)**: Measures a company’s profitability on a per-share basis.
\
- **Price to Earnings Ratio (P/E)**: Compares the stock price to the company's earnings. A higher P/E might indicate overvaluation or growth prospects.
\
#### b. **Profitability Ratios:**
- **Return on Equity (ROE)**: Measures a company’s ability to generate profit from its shareholders’ equity.
\
- **Return on Assets (ROA)**: Indicates how efficiently a company uses its assets to generate profit.
\
#### c. **Liquidity Ratios:**
- **Current Ratio**: Measures a company’s ability to pay short-term liabilities with its short-term assets.
\
- **Quick Ratio**: A more stringent test of liquidity (excludes inventory).
\
#### d. **Debt Ratios:**
- **Debt to Equity Ratio**: Measures a company's financial leverage.
\
- **Interest Coverage Ratio**: Indicates how easily a company can pay interest on its debt.
\
---
### **3. Advanced Level: In-depth Analysis Techniques**
#### a. **Discounted Cash Flow (DCF) Analysis**
DCF is a valuation method used to estimate the value of an investment based on its future cash flows, adjusted for time value.
- **Formula**:
\
where:
- \( \text{CF}_t \) = Cash Flow in year t
- \( r \) = Discount rate (often WACC)
- \( t \) = Time period
#### b. **Economic Indicators**:
- **GDP Growth**: Indicates the health of the economy and consumer spending power.
- **Inflation**: Impacts purchasing power and can affect interest rates.
- **Unemployment Rate**: High unemployment can indicate economic weakness, affecting company performance.
#### c. **Dividend Discount Model (DDM)**:
Used to value companies based on the present value of their future dividend payments.
- **Formula**:
\
where:
- \( D_1 \) = Dividend in the next period
- \( r \) = Required rate of return
- \( g \) = Dividend growth rate
#### d. **Economic Moats**:
A company’s competitive advantage that protects it from competition and allows it to maintain profits over time. Common moats include:
- **Brand Recognition**: Brands like Apple and Coca-Cola.
- **Cost Advantages**: Efficient production methods or economies of scale.
- **Network Effects**: Platforms like Facebook or eBay where more users make the service more valuable.
---
### **4. Sector-Specific Analysis**
#### a. **Tech Sector**: Look for growth potential, intellectual property, R&D, and scalability.
#### b. **Consumer Goods**: Focus on brand strength, market share, and economic cycles.
#### c. **Financial Sector**: Analyze loan growth, interest rate sensitivity, and regulatory environment.
---
### **5. Risk Analysis and Management**
#### a. **Beta**: Measures the volatility of a stock in comparison to the market. A beta of 1 means it moves in line with the market.
#### b. **Country Risk**: Political and economic stability of the country in which the company operates.
---
### **6. Real-World Applications of Fundamental Analysis**
#### a. **Stock Selection**: Using financial ratios and valuation models (like DCF) to choose stocks that are undervalued.
#### b. **Portfolio Diversification**: Combining assets from different sectors and industries to reduce risk.
#### c. **Long-term Investing**: Based on solid fundamentals like growth prospects, stable cash flow, and profitability.
---
### **Books and Resources to Learn FA**
- **“The Intelligent Investor” by Benjamin Graham** – The classic on value investing.
- **“Common Stocks and Uncommon Profits” by Philip Fisher** – A great book for understanding qualitative analysis.
- **“Financial Statement Analysis and Security Valuation” by Stephen Penman** – A detailed guide to company analysis.
- **Online Courses**: Coursera, Udemy, or edX have comprehensive courses on financial analysis.
---
### Conclusion
Mastering Fundamental Analysis requires a blend of theoretical knowledge, practical experience, and continuous learning. Start by learning the key ratios and financial statements, and then progress to advanced valuation techniques like DCF and economic moats. Always stay updated on the macroeconomic environment, as it plays a crucial role in shaping the performance of individual companies.

what is option chain pcr ?The **Option Chain PCR (Put-Call Ratio)** is a ratio used by traders and analysts to gauge market sentiment and potential price direction. It is calculated by dividing the total open interest (OI) of **puts** by the total open interest of **calls** in a particular market or stock.
### Formula for PCR:
\
### What does PCR indicate?
- **PCR > 1**: This suggests that there are more open interest in puts than calls, which is generally considered a **bearish** signal, indicating that traders expect the price to decline.
- **PCR < 1**: This suggests that there are more open interest in calls than puts, which is generally considered a **bullish** signal, indicating that traders expect the price to rise.
- **PCR = 1**: This indicates an **equilibrium** where the market is neutral, with an equal amount of calls and puts.
### How it's used:
- **Sentiment Indicator**: Traders use the PCR to determine the overall sentiment of the market. A rising PCR might suggest that there is growing bearish sentiment, while a declining PCR might suggest increasing bullish sentiment.
- **Market Extremes**: When the PCR becomes too extreme (either very high or very low), it could signal a reversal, indicating that the market might be overbought or oversold.
### Example:
If the open interest for put options in a stock is 100,000 contracts and for call options is 200,000 contracts, the PCR would be:
\
This would typically indicate a **bullish sentiment**, as more traders are interested in calls than puts.

what is support and resistance and how to use it ?The support and resistance (S&R) are specific price points on a chart expected to attract the maximum amount of either buying or selling. The support price is a price at which one can expect more buyers than sellers. Likewise, the resistance price is a price at which one can expect more sellers than buyers.
Using Support and Resistance After a Breakout
Old Resistance Becomes New Support – If the price breaks above resistance, that resistance level may now act as support.
Old Support Becomes New Resistance – If the price breaks below support, that support level may now act as resistance
Support is a price point which is below the current market price and indicates buying interest. Resistance is the price point which is above the current market price and indicates selling interest. Support and resistance are used to identify the targets for the trade
Support and resistance levels are important points in time where the forces of supply and demand meet. These support and resistance levels are seen by technical analysts as crucial when determining market psychology and supply and demand.

Banswara Syntex Ltd.Banswara Syntex Ltd. (NSE: BANSWRAS) is currently exhibiting a **Neutral** technical outlook on the monthly timeframe.
**Technical Indicators:**
- **Relative Strength Index (RSI):** The 14-day RSI stands at 53.81, indicating a neutral market sentiment. citeturn0search5
- **Moving Averages:** The stock is trading below its 50-day simple moving average (SMA) of ₹144.23 and above its 50-day exponential moving average (EMA) of ₹139.63, suggesting a mixed trend. citeturn0search5
- **MACD (Moving Average Convergence Divergence):** The MACD value is -2.43, which is below the signal line, indicating a bearish momentum. citeturn0search5
- **Stochastic Oscillator:** The Stochastic Oscillator is at 68.59, suggesting a neutral market condition. citeturn0search5
**Support and Resistance Levels:**
- **Support:** The stock has support at ₹127.62. citeturn0search5
- **Resistance:** The resistance level is at ₹137.67. citeturn0search5
**Conclusion:**
Banswara Syntex Ltd. is currently in a neutral technical position on the monthly timeframe, with indicators suggesting neither strong bullish nor bearish momentum. Investors should monitor these indicators closely, as a breakout above resistance levels could signal a bullish trend, while a drop below support levels might indicate a bearish move. It's advisable to consider these technical factors alongside fundamental analysis and broader market conditions when making investment decisions.

#bls international #BLS PERFECT REVERSAL CANDIDATE
BLS International Services Ltd. (NSE: BLS) is currently exhibiting a **Neutral** technical outlook, with indicators suggesting neither strong bullish nor bearish momentum.
**Technical Indicators:**
- **Relative Strength Index (RSI):** The 14-day RSI stands at 35.13, indicating a neutral market sentiment. citeturn0search4
- **Moving Averages:** The stock is trading below its 5-day, 10-day, 20-day, and 50-day simple and exponential moving averages, suggesting a bearish trend. citeturn0search4
- **MACD (Moving Average Convergence Divergence):** The MACD value is -10.94, which is below the signal line, indicating a bearish momentum. citeturn0search4
- **Stochastic Oscillator:** The Stochastic Oscillator is at 16.70, suggesting a buy signal. citeturn0search4
**Support and Resistance Levels:**
- **Support:** The stock has support at ₹389.87. citeturn0search4
- **Resistance:** The resistance level is at ₹448.87. citeturn0search4
**Conclusion:**
BLS International Services Ltd. is currently in a neutral technical position, with indicators suggesting neither strong bullish nor bearish momentum. Investors should monitor these indicators closely, as a breakout above resistance levels could signal a bullish trend, while a drop below support levels might indicate a bearish move. It's advisable to consider these technical factors alongside fundamental analysis and broader market conditions when making investment decisions.

Crisil Ltd.CRISIL Ltd. (NSE: CRISIL) is currently exhibiting a **Neutral** technical outlook, as indicated by various technical analysis indicators.
**Technical Indicators:**
- **Relative Strength Index (RSI):** The 14-day RSI stands at 38.43, suggesting a neutral market sentiment. citeturn0search3
- **Moving Averages:** The stock is trading below its 5-day, 10-day, 20-day, and 50-day simple and exponential moving averages, indicating a bearish trend. citeturn0search3
- **MACD (Moving Average Convergence Divergence):** The MACD value is -124.85, which is below the signal line, suggesting a bearish momentum. citeturn0search3
- **Stochastic Oscillator:** The Stochastic Oscillator is at 38.63, indicating a neutral market condition. citeturn0search3
**Support and Resistance Levels:**
- **Support:** The stock has support at ₹4,996.55. citeturn0search3
- **Resistance:** The resistance level is at ₹5,455.40. citeturn0search3
**Conclusion:**
CRISIL Ltd. is currently in a neutral technical position, with indicators suggesting neither strong bullish nor bearish momentum. Investors should monitor these indicators closely, as a breakout above resistance levels could signal a bullish trend, while a drop below support levels might indicate a bearish move. It's advisable to consider these technical factors alongside fundamental analysis and broader market conditions when making investment decisions.

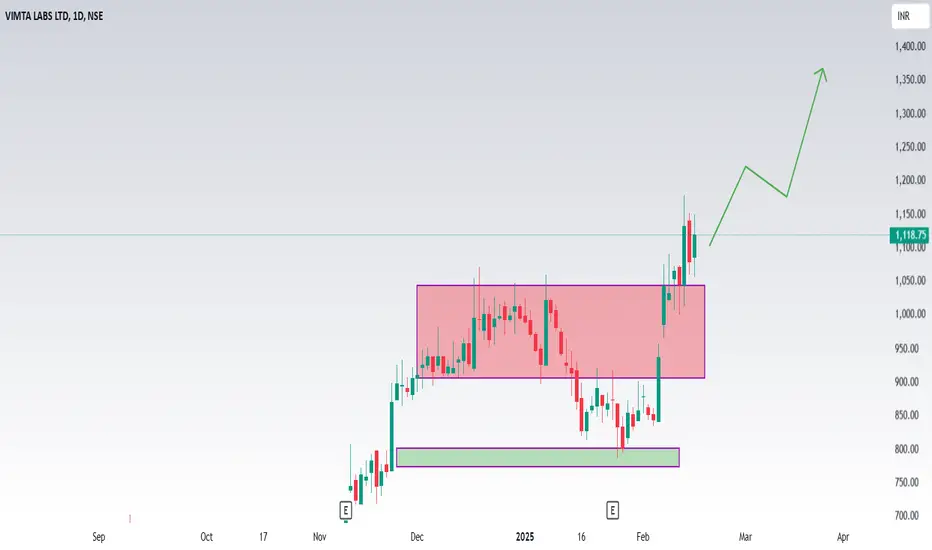
Vimta labs ltdShould I buy VIMTA LABS LTD stock? Our technical rating for VIMTA LABS LTD is buy today. Note that market conditions change all the time — according to our 1 week rating the strong buy trend is prevailing, and 1 month rating shows the strong buy signal.
Vimta Labs Ltd. (NSE: VIMTALABS) is currently exhibiting a strong bullish trend, as indicated by various technical analysis indicators.
**Technical Indicators:**
- **Moving Averages:** All moving averages (5, 10, 20, 50, 100, and 200 periods) are signaling a 'Buy' or 'Strong Buy' position, suggesting sustained upward momentum. citeturn0search2
- **Relative Strength Index (RSI):** The 14-day RSI stands at 89.33, indicating that the stock is in the overbought territory. While this suggests strong momentum, it also implies a potential for price correction. citeturn0search2
- **MACD (Moving Average Convergence Divergence):** The MACD is above the signal line, reinforcing the bullish trend. citeturn0search2
- **Stochastic Oscillator:** The Stochastic Oscillator is in the overbought zone, which may indicate a potential for price pullback. citeturn0search2
**Support and Resistance Levels:**
- **Support:** The stock has support at ₹560. citeturn0search3
- **Resistance:** The resistance level is at ₹1,020. citeturn0search3
**Volume Analysis:**
The stock has experienced high trading volumes at price peaks and lower volumes at price troughs, indicating that price movements are supported by significant trading activity. citeturn0search3
**Conclusion:**
While Vimta Labs Ltd. is currently in a strong bullish phase, the overbought conditions suggested by the RSI and Stochastic Oscillator warrant caution. Investors should monitor these indicators closely, as a price correction could occur if the stock remains in the overbought zone. It's advisable to consider these technical factors alongside fundamental analysis and broader market conditions when making investment decisions.
basic to advanced technical analysis ?What is Advanced Technical Analysis? Advanced technical analysis usually involves using either multiple technical indicators or a rather sophisticated (i.e., complex) indicator. “Sophisticated” does not necessarily mean “better” – it just means more difficult to calculate than, say, an arithmetic average.
Technical analysis seeks to predict price movements by examining historical data, mainly price and volume. It helps traders and investors navigate the gap between intrinsic value and market price by leveraging techniques like statistical analysis and behavioral economics
What are the four 4 basic principles of technical analysis?
The core principles of technical analysis in relation to the stock market are that prices discount all known information, reflect the psychology of market participants in the form of fluctuating prices, move in trends, and tend to repeat in historically identifiable patterns

What is adx use in technical analysis ?The ADX quantifies trend strength by measuring directional movement over a given time frame. It provides traders with specific numbers (from 0 to 100) that represent strong or weak price trends. Traders can simply refer to the numbers to quickly assess the strength of a trend.
Traders could utilise the ADX to help them determine entry or exit points for a trade. The ADX could be used to identify potential overbought or oversold levels in the market.
Key takeaways. Average directional index (ADX) is a short-term chart indicator. It can be used to help you evaluate the market or an investment's strength. ADX currently suggests the short-term momentum behind stocks may be strong, with a caveat.

What is swing trading and how to do it ?Swing trading is a stock investment strategy where profits are made over several days or weeks. Swing traders analyze stock price patterns to anticipate when prices will rise, allowing them to buy low, and when prices will fall, enabling them to sell high.
The simplest and most effective way to protect your equity through risk management is to establish strict loss parameters and abide by them. One popular method is the 2% Rule, which means you never put more than 2% of your account equity at risk
The 3 5 7 rule is a risk management strategy in trading that emphasizes limiting risk on each individual trade to 3% of the trading capital, keeping overall exposure to 5% across all trades, and ensuring that winning trades yield at least 7% more profit than losing trades.

what is the use of adx in trading ?The ADX quantifies trend strength by measuring directional movement over a given time frame. It provides traders with specific numbers (from 0 to 100) that represent strong or weak price trends. Traders can simply refer to the numbers to quickly assess the strength of a trend.
Key takeaways. Average directional index (ADX) is a short-term chart indicator. It can be used to help you evaluate the market or an investment's strength. ADX currently suggests the short-term momentum behind stocks may be strong, with a caveat.
Average Directional Index or ADX is a technical analysis indicator that can determine if a market trend is strong or weak. It provides values between 0 to 100 for the same. A value between 0-25 indicates a weak trend. A value between 25-50 indicates a fairly strong trend.

What is option chain pcr ?The Put-Call Ratio (PCR) is a popular technical indicator used by investors to assess market sentiment. It is calculated by dividing the volume or open interest of put options by call options over a specific time period. A higher PCR suggests bearish sentiment, while a lower PCR indicates bullish sentiment.
The Put Call Ratio (PCR) is a popular metric traders use to gauge market sentiment. It is calculated by dividing the number of put options by the number of call options. A high PCR indicates a bearish sentiment, as more traders buy puts, expecting the market to decline
An options chain displays all available option contracts for a security, organized by expiration date and strike price. Options chains typically show each contract's bid price, ask price, volume, open interest, and implied volatility.

What is rsi ? how to use it ?The relative strength index (RSI) is an indicator used in technical analysis to determine overbought and oversold conditions, which provides traders with buy and sell signals (when to enter and exit positions). Values above 70 indicate overbought conditions and those below 30 indicate oversold conditions.
To use the RSI indicator, check if the value is above 70 to show an asset is overbought, or below 30 to show it is oversold. Traders can use these signals to find possible trading opportunities.
Successful trades often occur when the RSI crosses above 30 (indicating a buy signal) or below 70 (indicating a sell signal). Adjusting the RSI period to 9 can make it more sensitive to price changes and be suitable for more active trading strategies.
