Top 10 Sentiment Tools Used in The Trading Market Today📊 1. SentimenTrader
Best for: comprehensive market sentiment + trend analysis
Overview:
SentimenTrader is widely regarded as one of the gold-standard platforms for sentiment analysis in financial markets. The platform synthesizes data from surveys, options positioning (like put/call ratios), futures, fund flows, and proprietary metrics into sentiment scores that traders can interpret for potential turning points and trend signals.
Why traders use it:
• Breadth of data: Combines classic sentiment gauges (like “Smart Money vs Dumb Money” confidence) with modern optix scores and market breadth indicators.
• Backtesting + strategy: Includes a powerful sentiment-driven backtesting engine where you can test ideas against historical price behavior.
• Actionable signals: Helps discern extremes in market psychology — which often precede big reversals or continuations.
Best for: intermediate and advanced traders who want holistic sentiment insight plus strategy validation.
📈 2. Fear Greed Tracker
Best for: quick, visual sentiment snapshot across asset classes
Overview:
The Fear Greed Tracker simplifies market sentiment into a single score — typically ranging from Extreme Fear to Extreme Greed — derived from multiple underlying indicators such as volatility, momentum, and social media buzz. This kind of gauge helps traders quickly assess whether markets are overheated or overly pessimistic.
Why it’s useful:
• Simplicity: One number that summarizes where market psychology stands.
• Wide coverage: Works for stocks and crypto alike, which is ideal if you trade across asset classes.
• Trend signals: Identifying extremes can help contrarian traders time entries/exits.
Limitations:
Some traders critique these broad indices for lagging during fast-moving news cycles.
🧠 3. AlphaSense
Best for: institutional-grade news sentiment analysis
Overview:
AlphaSense isn’t just a sentiment tool — it’s a premium AI search engine that scans billions of financial documents, earnings transcripts, SEC filings, and analyst research to extract sentiment signals and insights. Its NLP (natural language processing) engine scores corporate language for positive or negative cues that might move markets.
Key strengths:
• Deep coverage: More than just social mentions — it works on official sources where institutional money pays attention.
• Real-time alerting: Instant notifications on news sentiment shifts that might affect stocks.
Best for: professional investors and hedge funds who rely on text-based signals beyond price patterns.
📉 4. TradingView (Social & Community Sentiment)
Best for: crowd-sourced sentiment from retail traders
Overview:
TradingView is best known for charts, but its large community and social features mean that you not only see price action but also what other traders are thinking, forecasting, and voting on. Sentiment here is derived from indicators, trend indicators voted by community, and shared trading ideas.
Why it’s interesting:
• Community signals: Traders can see bullish/bearish sentiment trends from the crowd.
• Overlay with technical tools: Combine sentiment clues with trendlines, RSI, MACD, etc.
Drawbacks:
Crowd sentiment isn’t always predictive — sometimes it lags actual market moves.
📊 5. Trendlyne
Best for: Indian markets + multi-source sentiment metrics
Overview:
Specifically helpful for Indian stock traders, Trendlyne offers sentiment scores derived from news, social media chatter, and market data. It also provides advanced charting and other stock evaluation tools — all under one platform.
Why Indian traders like it:
• Localized insight: Sentiment tailored to domestic stocks.
• Alerts and real-time updates: Useful for active day traders or swing traders.
• Integrated analysis: Blends sentiment with fundamental and technical views.
🐤 6. Sentifi
Best for: global sentiment across news + social + expert voices
Overview:
Sentifi’s AI engine aggregates massive amounts of data — including news, tweets, blogs, and financial analyses — and applies sentiment scoring to show how markets and specific instruments are being portrayed in public narratives.
Why it stands out:
• Multi-layered data: Not just one source — covers a wide universe of investor content.
• Visual dashboards: Helps see sentiment shifts across time and topics.
Good for: traders who want sentiment fused with narrative context, not just signals.
🤖 7. Momentum Radar
Best for: AI-driven trend and sentiment tracking
Overview:
Highlighted as a modern sentiment tool, Momentum Radar uses social media tracking, influencer data, and AI to find shifts in sentiment and momentum in real time. Its machine learning insights aim to alert traders to potential breakout or breakdown scenarios.
Key features:
• Real-time social scanning: Picks up chatter spikes that may foreshadow price moves.
• Multi-asset coverage: Stocks, crypto, and more.
Ideal for: short-term traders and fast markets.
📌 8. HypeIndex
Best for: measuring social sentiment intensity
Overview:
HypeIndex aggregates social media and news mentions to score how “hyped” a stock or asset is at any given moment — not just positive vs negative sentiment, but how much buzz it’s generating.
Why traders like it:
• Hype gauge helps spot bubbles or momentum plays before they explode.
• Works well with breakout strategies.
Limitation:
Not always a predictor of long-term trend direction.
📊 9. FXSSI (Forex Sentiment Tools)
Best for: Forex traders
Overview:
FXSSI specializes in sentiment analysis for currency markets specifically, integrating positioning data like trader commitment (from platforms like the COT report), order book profiles, and crowd psychology indicators directly into MT4/MT5 charts.
Why it matters:
Forex sentiment differs from equities because positioning and carry trades often dominate. FXSSI helps visualize whether retail traders are net long or short — a potential contrarian indicator.
Best for: FX traders who want positioning data over just price signals.
🚀 10. StockGeist.ai
Best for: real-time equity sentiment + news analytics
Overview:
StockGeist provides live sentiment indicators for thousands of stocks, especially in major indices like the S&P 500 and Nasdaq 100. Its dashboard is designed for traders who want immediate insight into sentiment swings driven by news and social sources.
Key strengths:
• Live updates: Good for intraday or short-term trading.
• Visual sentiment heatmaps: Easy to spot where the market mood is strongest or weakest.
🧠 Bonus: How Sentiment Tools Fit into Your Strategy
Sentiment tools aren’t magic; they’re another lens on market psychology. They work best when combined with other analysis methods:
🔹 Contrarian Strategies
Sentiment extremes — insanely bullish or bearish readings — often precede reversals.
🔹 Confirmation
Use sentiment as a second opinion to confirm technical breakouts or breakdowns.
🔹 Risk Management
Sentiment shifts can warn of volatility spikes when news or crowd psychology changes fast.
🚨 Things to Keep in Mind
✔ Data sources matter: Tools that use multiple sources (news, social, surveys, positioning) tend to give richer insights.
✔ Latency matters: Real-time tools help intraday traders, while delayed surveys suit long-term investors.
✔ Noise vs signal: Social chatter can be noisy; professional-grade tools weigh sources differently.
Sentimentalanalysis

Advanced Intraday Institution Option TradingAdvanced Intraday Institutional Option Trading
Institutional intraday option trading focuses on order flow, volatility expansion, and hedging behavior, not prediction. Institutions deploy capital where liquidity, gamma, and vega sensitivity allow fast risk adjustment—usually in near-expiry (0DTE–3DTE) index options.
Institutional Interpretation
Max Call OI at 21,500 → Heavy call writing → Resistance
Rising Put OI at 21,400 → Strong downside hedge → Support
IV spike on Calls above 21,500 → Short covering risk → Breakout fuel
Balanced IV at ATM → Volatility expansion likely
High-Probability Intraday Trades
Gamma Scalping: Buy ATM options when IV expands + price holds VWAP
Directional Break: Long calls above call-writer resistance with OI unwinding
Volatility Fade: Sell options after IV spikes near key levels
Key Rule
Institutions trade structure, not direction.
Retail trades candles. Smart money trades the option chain.

SENSEX : Trading levels and Plan 18-Dec-2025📘 SENSEX Trading Plan for 18-Dec-2025
(Timeframe reference: 15-min | Gap criteria: 300+ points)
Key Levels to Track (from chart):
Opening Resistance: 84,745
Last Intraday Resistance: 84,949
Upper Supply / Extended Target: 85,133
Opening Support: 84,399
Last Intraday Support: 84,003
Lower Support (Extreme): 83,832
🟢 1. GAP-UP OPENING (300+ Points)
If SENSEX opens well above 84,745, price directly enters the resistance/supply region.
🎓 Educational Explanation:
Large gap-ups usually indicate strong overnight sentiment, but they also invite profit booking near resistance. Institutions often test whether new buyers are willing to defend higher prices. Hence, a break–retest–continue structure is healthier than chasing the opening candle.
Plan of Action:
If price sustains above 84,745 for 10–15 minutes, wait for a pullback before considering longs.
First upside hurdle is 84,949; watch price behaviour and volume here.
Acceptance above 84,949 opens the path toward 85,133 (extended supply zone).
Strong rejection or exhaustion near 85,133 can lead to a pullback toward 84,949 → 84,745.
Option buyers should prefer ATM/ITM Calls only after confirmation; avoid chasing spikes at resistance.
🟡 2. FLAT OPENING
A flat open near 84,550–84,650 keeps SENSEX inside a balance area between support and resistance.
🎓 Educational Explanation:
Flat openings indicate indecision. Direction emerges only after one side shows commitment. The first 30 minutes define intraday structure; trading before that often leads to whipsaws.
Plan of Action:
Sustaining above 84,745 turns sentiment positive, targeting 84,949.
Failure to cross 84,745 keeps price range-bound with a downside risk toward 84,399.
Breakdown below 84,399 shifts control to sellers, opening the move toward 84,003.
Bullish reversal patterns near 84,399 can offer low-risk bounce trades toward 84,745.
🔴 3. GAP-DOWN OPENING (300+ Points)
If SENSEX opens below 84,399, early sentiment turns cautious.
🎓 Educational Explanation:
Large gap-downs are often emotion-driven. Smart money waits for price reaction at strong demand zones instead of selling into panic. Many intraday reversals begin from such zones after sellers exhaust.
Plan of Action:
First demand area to watch is 84,003; look for rejection candles or bullish divergence.
A bounce from 84,003 can retrace toward 84,399.
Sustained breakdown below 84,003 exposes 83,832, the extreme support.
Any pullback toward 84,399 after a breakdown becomes a selling-on-rise opportunity.
⚙️ Risk Management Tips for Options Traders 🛡️
Avoid trading in the first 5–10 minutes during 300+ point gap days.
Never buy options at resistance or sell at support—wait for confirmation.
Use time-based stop loss (15–20 minutes) if premium doesn’t move as expected.
Risk only 1–2% of capital per trade; position sizing matters more than accuracy.
Prefer ATM options or spreads during high IV to reduce decay risk.
Book partial profits near key resistance/support zones.
🧾 Summary & Conclusion
Above 84,745: Bulls remain active; targets 84,949 → 85,133.
Between 84,399–84,745: Market stays balanced; patience is key.
Below 84,399: Sellers gain control unless strong demand appears at 84,003.
Focus on structure, confirmation, and disciplined risk management, not prediction.
The best trades come from waiting for price to reach predefined levels.
⚠️ Disclaimer
I am not a SEBI-registered analyst. This trading plan is for educational purposes only and should not be considered as financial or investment advice. Please consult your financial advisor before taking any market positions.

Bitcoin's Death Cross is Here: A crash with a message to all!BITSTAMP:BTCUSD has just delivered one of its most significant reality ✔ checks of the year — the recent crash wasn’t simply a dip; it was a multi-layered market unwind that exposes the current fragility of the crypto ecosystem.
📉 Current Bitcoin Situation: “From Euphoria to Uncertainty”
Bitcoin’s trend shifted rapidly over the past few weeks.
Spot ETFs that once fueled relentless upside have significantly slowed inflows, with some days printing net outflows as retail enthusiasm cooled and institutions trimmed exposure.
Meanwhile:
Over billions in long liquidations hit in some days.
Funding flipped aggressively negative
Sentiment turned from greed → hesitation
High beta alts saw steeper collapses, showing risk-off behavior
This wasn’t random volatility — it was a controlled flush triggered by structural weakness.
🔥 Why Bitcoin Crashed: The Real Story
🔹 Technical Factors
BTC lost a major support cluster after multiple failed attempts to hold the mid-range.
Open interest was overheated, creating the perfect setup for a liquidation cascade.
Price rejected sharply from a supply zone that aligns with the weekly imbalance.
☠️ Death Cross on Daily Time Frame: Now Confirmed
The 50 SMA crossing below the 200 SMA is not a “doom event” by itself…
But historically, Bitcoin rarely ignores this signal, especially when paired with weakening momentum and fading liquidity.
⚠ The last major Death Cross?
2022’s brutal bear continuation, which led to several months of grinding downside before any meaningful reversal.
The current structure looks uncomfortably similar:
Lower highs printing consistently
Loss of trend strength
Distribution patterns on higher time frames
Declining demand from smart money inflows
This isn’t fearmongering — it’s observation.
🔹 Fundamental + Macro Factors
ETF inflow cooldown = reduced demand pressure
Miners started selling into strength to stabilize income post-difficulty adjustment
Global markets leaned risk-off due to macro tightening
Whales began distributing quietly (confirmed by on-chain inflow spikes into exchanges)
When technical fragility meets fundamental slowdown, crashes are not accidents — they’re consequences.
🐋 Whales Are Selling: “When the quiet money moves, the market reacts loud.”
On-chain data over the last week showed:
Increase in exchange inflows from large wallets
Spot distribution from old long-term holders
ETF issuers are reducing inventory during downswings
This behavior is classic:
Whales distribute during periods of retail excitement…
Retail panics during whale exits…
And the crash becomes a self-fulfilling cycle.
📅 4–6 Week Forecast: “Chop, Pain & Opportunity”
Over the next month or so, the market will likely experience:
Sideways-to-down structure
Failed rally attempts near the 50 SMA
Whip-saw price action due to low conviction
Accumulation pockets are forming quietly
BITSTAMP:BTCUSD needs to reclaim the 50 SMA with strength before a clean trend resumes.
Until then, volatility ≠ strength.
🎯 Conclusion: Re-Investment Zones & Smart Accumulation
Crashes are emotional for most, but strategic for the prepared.
This is not a call to rush.
It’s a reminder:
Smart money enters when sentiment collapses.
Dumb money enters when sentiment peaks.
Analyze. Prepare. Don’t chase.
🧩 Comment down below 👇 and let’s talk about how to overcome it — build awareness together as traders, not competitors.
If this Idea gave you valuable information, then please boost it, and follow for more practical trading!
Happy Trading & Investing!
Team @TradeWithKeshhav ⚡

Bitcoin / USD – 15m Short Sell In this setup, I’m tracking BTC price action using the Fear Index (21) and Trend Shift Histogram (14) as confluence indicators for potential entries.
🔻 Key Observations:
The Fear Index showed a strong spike before the sharp sell-off, indicating growing selling pressure.
The Trend Shift Histogram gave multiple bearish signals (highlighted with arrows), aligning with the price rejection and downward continuation.
After the heavy drop, BTC attempted a recovery but faced resistance within the marked zone, forming a bearish retest.
📌 Trade Setup:
Short entry taken on confirmation of bearish trend shift.
Stop loss placed above the rejection zone.
Target aligned with the momentum continuation shown by the histogram and fear index.
⚡️ Conclusion:
This setup highlights how combining sentiment-based indicators (Fear Index) with momentum confirmation (Trend Shift Histogram) can help anticipate strong market moves. Always manage risk carefully, as volatility in lower timeframes can be sharp.

Advantages of Institutional Option TradingAdvantages of Institutional Option Trading
Institutional Investing
Institutional investing is the process of managing large-scale investment portfolios with long-term goals.
Investment Objectives
Capital Preservation: Maintaining the value of assets.
Capital Appreciation: Growing the portfolio over time.
Income Generation: Providing steady returns through dividends or interest.

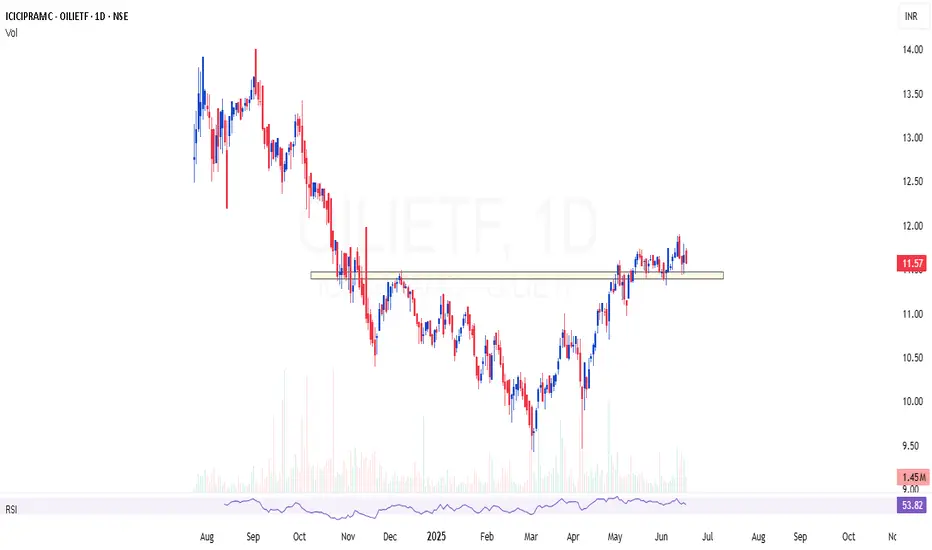
OILIETF | Good theme for current global sentimentOILIETF | Good theme for current global sentiment
The ETF has good volume to trade,
Portfolio consist of stable stocks that are fallen already
Trying to capture a 30% move in this ETF
Has good risk reward and momentum aswell
Relatively a stable bet
Institution Option Trading Part-1Role of Market Makers & Liquidity Providers
Institutions often rely on market makers for tight bid-ask spreads.
Market makers hedge every trade using delta-neutral strategies.
Their presence helps institutions build or unwind large positions without disrupting prices.
Institutional Examples in Option Trading
Hedge Funds: Use volatility arbitrage, gamma scalping, dispersion trading.
Insurance Firms: Use long-dated puts to hedge annuity products.
Banks: Write structured products with option-like features (e.g., equity-linked notes).
Asset Managers: Use protective puts or collars on core portfolios.

Option trading Who is the youngest successful stock trader in the world? 5 Youngest Stock Traders Ashu Sehrawat At only 22 years old, the self-made millionaire has created a name for himself as one of India's top stock traders.
Selling options spreads is one such strategy that fits the bill. It's often seen as one of the lowest risk option strategies because it allows you to have a pre-determined capped loss risk when trading. This way, you're not only minimizing risk but also generating income.

TCS trendline retest Tata Consultancy Services (TCS) is a leading global IT services and consulting company. Here's a detailed analysis of TCS's stock performance, focusing on the daily timeframe and recent trendline retests:
**Current Stock Price:**
As of February 14, 2025, TCS's share price is ₹3,934.85, reflecting a 0.63% increase from the previous day. citeturn0search0
**Recent Performance:**
- **1-Month Return:** The stock has declined by 7.04% over the past month. citeturn0search7
- **1-Year Return:** Over the last year, TCS's stock has decreased by 4.03%. citeturn0search7
**Technical Analysis:**
- **Trendline Retest:** TCS's stock has recently retested a significant trendline on the daily chart. This trendline has historically acted as a support level, and the recent retest suggests a potential for the stock to rebound if it holds above this line. Traders should monitor the stock's price action around this trendline to assess the likelihood of a sustained upward movement.
- **Support and Resistance Levels:** Key support is identified near ₹3,900, with resistance around ₹4,200. A break above ₹4,200 could signal a bullish trend, while a fall below ₹3,900 may indicate further downside.
- **Technical Indicators:** The Relative Strength Index (RSI) is currently at 45, indicating neutral momentum. The Moving Average Convergence Divergence (MACD) line is above the signal line, suggesting a potential bullish crossover. However, these indicators should be used in conjunction with price action for a comprehensive analysis.
**Analyst Insights:**
- **Price Target:** Analysts have set a price target of ₹5,620 for TCS, indicating a potential upside of approximately 42% from the current price. citeturn0search0
- **Dividend Yield:** TCS offers a dividend yield of 1.86%, reflecting a commitment to returning value to shareholders. citeturn0search7
**Conclusion:**
TCS's stock is currently testing a critical trendline support on the daily chart. Investors should monitor the stock's price action around this level to assess the potential for a rebound. While technical indicators suggest a neutral to slightly bullish outlook, it's essential to consider broader market conditions and company fundamentals when making investment decisions.
*Please note that stock market investments carry inherent risks. It's advisable to conduct thorough research or consult with a financial advisor before making investment decisions.*

RSI Divergence RSI divergence occurs when the price of an asset moves in the opposite direction to the RSI indicator. Depending on the type of divergence spotted, this can signal a potential reversal in the market trend, either bullish or bearish.
The best RSI settings are typically a 14-period timeframe with 70 as the overbought level and 30 as the oversold level. These settings can be adjusted based on specific trading strategies.

Hcl tech next outperforming stocks in IT sectorKey points : - 1. Crossed 60 on monthly chart
2. Taking support on weekly rsi
3. Outperform sector
4. Sectors storngest stock
5. Buy above 1700 is great buy
6. But after a sep fed cut buy will we be more strong
And ready to buy

Banknifty Index Long Levels #InvestingBanknifty Index Long Levels
Certainly! The Bank Nifty (BANKNIFTY) is an index that tracks the performance of the banking sector in the Indian stock market. Here are some key points to consider for long-term investment:
Bank Nifty ETFs: These exchange-traded funds offer easy diversification, flexibility, and low expense ratios. They can be suitable for long-term investments, potentially providing capital appreciation over time.
Historical Performance:
Over the last 3 years, the Bank Nifty has given better returns compared to other indices. It has rallied over 42%, while Nifty IT is up 36% and the broader Nifty has gained over 48%.
You can access historical data for Bank Nifty to analyze its performance over different time intervals.
Remember that investing involves risks, and it’s essential to conduct thorough research, consider your risk tolerance, and consult with a financial advisor before making any investment decisions

Tight close range - One side moment is expected in coming weeksThese tight ranges often result in a one-sided moment. Considering the current sentiments, there is concord among market participants about what the future holds for crypto, which is reflected in the price moment.
Resistance: 44k-49k
Support: 37-38 K

EURUSD stays in bear’s jaws ahead of US Retail SalesEURUSD stays within a three-month-old bearish trend channel despite rising the most in October the previous day. Adding strength to the bearish bias is the looming bear cross between the 100-day SMA and the 200-day SMA, as well as the steady RSI (14) line. However, three-week-long horizontal support surrounding 1.0500 joins the bullish MACD signals to restrict the immediate downside of the Euro pair. Following that, the monthly low of around 1.0450 will act as the final defense for the bulls before driving prices down towards the aforementioned channel’s bottom line, close to 1.0350 by the press time.
Meanwhile, EURUSD recovery needs to defy the bearish channel pattern, by clearly crossing the 1.0600 hurdle, to convince the short-term buyers. Even so, a horizontal area comprising multiple levels marked since May, near 1.0620-35, will be a tough nut to crack for the bulls. It’s worth noting that a convergence of the 100-day SMA and the 200-day SMA, near 1.0830 at the latest, holds to key to the bullish trend.
To sum up, the EURUSD remains within a bearish trajectory as markets await the Eurozone/German ZEW data and EU EcoFin Meeting, as well as the US Retail Sales. The same suggests that the outcome favoring the US Dollar, or weighing on the Euro, will have a clearer response than the otherwise.

Sentiment Analysis on EOD basis for NIFTY -AstrotechnicalsI have done Astro sentiment analysis using AI and mapped the results with an actual Nifty pattern. Here the objective is NOT to predict the price but the pattern for the month.
Sentiment response in Dec 2022
Sentiment response in Jan 2023
Sentiment response in Feb 2023
Sentiment response in March 2023

Bear flag in XAUUSD (gold)As we can clearly see a bear flag pattern in 2 hr time frame .Here we will get the good trade in the terms of risk and reward in both the directions just after the breakout or Breakdown of the consolidation phase in either direction. I am more confident towards the shorting side as compared to the long side just because of the short term negative sentiments of the market.
Manage proper risk reward/position size
Happy learning...

NIFTY Sentiment for DEC 7 2022
This is purely based on Astrological and Statistical parameters . Pattern matching of current data with past for coming up with a projection using Artificial Intelligence.
The technical levels to use are primary and this is just a sentimental analysis projection
Use the Weekly levels for Trade decisions .

Nifty Sentiment for SEP 20 2022Nifty Sentiment for SEP 20 2022
drive.google.com
This chart gives the sentiment based on Astro AI based on past pattern and tentatively gives the movement of price movement direction for the given time scale. If you find this useful give me a like
Use this along with weekly levels and Trend change value as per related idea
Buy Above 17600. 40
Buy Targets 17666.73 17732.70 17786.01 17839.33 17915.24 17961.32 18118.56 18291.15
Sell Below 17519.80
Sell Targets 17453.47 17387.50 17334.19 17280.87 17204.96 17158.88 17001.64 16829.05

NIFTY SENTIMENT for SEP 19 2022
NIFTY SENTIMENT
drive.google.com
This chart gives the sentiment based on Astro AI based on past pattern and tentatively gives the movement of price movement direction for the given time scale. If you find this useful give me a like
Use this along with weekly levels and Trend change value as per related idea
Buy Above 17600. 40
Buy Targets 17666.73 17732.70 17786.01 17839.33 17915.24 17961.32 18118.56 18291.15
Sell Below 17519.80
Sell Targets 17453.47 17387.50 17334.19 17280.87 17204.96 17158.88 17001.64 16829.05

An unfolding bear marketIn search of the next bottom, we look for five-wave declines to complete. Prices have been falling inside a channel and a breakout would put us in the price territory of the previous ivth wave near 16404 to the gap zone near 16484. But what if we do not breakout and keep falling below 16000 we could see a free fall with multiple extensions on the downside. Sentiment is poor and markets look oversold but will that work?

EURUSD professional analysis and markings by benickkingsentiment analysis
fundamentals
technicals
all are bearish so we have strong pressure you can see fundamental moves data on online ,and for sentimental analysis you can see in commitment of traders report, and for tecnicals you can see this patterns forming
1.strong support turns into resistance
2.falling wedge forming
3.bearish engulfing
4.parabolic sell signal
