Sequent (D): Strongly Bullish, Fundamentally-Driven BreakoutThe stock has confirmed a major breakout from a 3-year structural turnaround. The move is backed by a massive earnings beat, high-conviction volume, and aligned indicators across all timeframes.
📈 1. The Long-Term Structure (The Turnaround)
- The Crash (2021-2023): After hitting its All-Time High (ATH) in June 2021, the stock entered a brutal correction, falling ~81% to form a base around ₹62 in February 2023.
- The Recovery: Since March 2023, the stock has been in a steady uptrend, forming a classic "rounding bottom" or recovery structure.
- The Hurdle: The recovery faced a stiff horizontal resistance trendline at the ₹239 - ₹241 zone. This level acted as a ceiling in October 2024 (High: ₹240.70) and rejected price action multiple times recently.
🚀 2. The Catalyst & Breakout (Today's Action)
- The Catalyst: The breakout is fueled by Q2 FY26 Earnings , where the company reported a staggering 209.1% YoY jump in Net Profit
- The Breakout: Today (Nov 18, 2025), the stock decisively shattered the ₹240 resistance, surging 7.10% to close near ₹247 .
- Volume Confirmation: The move was backed by massive volume of 9.15 Million shares, a sharp spike compared to the drying volume seen during the recent consolidation. This confirms institutional buying.
📊 3. Technical Indicators
- EMAs: Short-term EMAs are in a PCO (Price Crossover) state across Monthly, Weekly, and Daily timeframes, signaling a synchronized bullish trend.
- RSI: The Relative Strength Index is rising across all three timeframes, confirming that momentum is expanding with price.
🎯 4. Future Scenarios & Targets
The breakout has opened the door to higher levels, with a specific structural target in focus.
- The Gap (The Magnet): An unfilled gap on the daily chart has been identified from the steep 2021 correction. This gap exists between ₹270 and ₹276 (formed in August 2021). Gaps often act as magnets for price.
🐂 Bullish Targets:
1. Target 1 (Gap Support): ₹270 . The stock is likely to run toward the bottom of this unfilled gap.
2. Target 2 (Gap Fill): ₹295 . If momentum sustains and fills the gap, the next extension level is near ₹295.
🛡️ Support (The Entry Zone):
- Re-test Level: The breakout level at ₹239 - ₹240 has now flipped from resistance to support. A pullback to this zone would be a classic "buy-the-dip" opportunity to enter the trend with a favorable risk-reward ratio.
Conclusion
This is a high-quality setup. The combination of a technical breakout , earnings explosion, and gap-fill potential makes this a strong candidate for continuation. Watch for a hold above ₹239 .
Sequentscientific

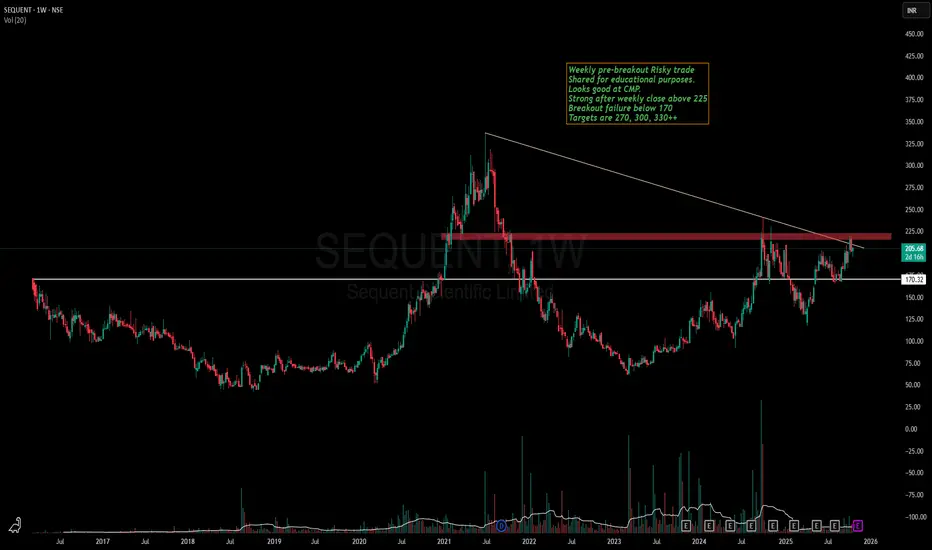
Sequent Scientific - Is it ready for a run towards ATH now?Sequent has been in my watchlist since the breakout of 170 levels.
Stock is making a good Higher high , Higher low pattern in weekly time frame and VCP in lower time frame.
Recently stock gave breakout of a strong resistance zone of 190-200 and is currently consolidating above the same.
If the breakout of 225 happens, we might see stock making a new ATH soon.
Keep this stock in watchlist and lets learn together how the patterns unveils.
This is not a recommendation and idea shared only for educational purposes
I am a NISM Certified RA & not SEBI registered.
SEQUENT SCIENTIFIC By KRS Charts8th May 2025 / 10:30 AM
Why SEQUENT SCIENTIFIC?
1. Technically it is showing Potential for movement.
2. In Past Already Got More than 50% Returns but important thing is as per Dow Theory it is making Higher Low.
3. In 1D TF multiple Breakouts with Above avg Volume is visible.
4. This is 1M Time Frame , so View is Medium to Long term.
T1 is already Achieved in Past but again after Retracement T1 & T2 will be same as before from current price.

Sequent Scientific cmp 177.90 by Weekly Chart viewSequent Scientific cmp 177.90 by Weekly Chart view
- Support Zone at 150 to 156 Price Band
- Bullish Head & Shoulders pattern with the neckline at Support Zone
- Can we expect a price reversal upside by support of Falling Resistance Trendline ?
- Price has sustained yet above the Falling Resistance Trendline crossing at Support Zone
- Weekly basis Support seen at 145 > 116 > 86 with the Resistance seen at 199 > 228 > 266
- *IF Support Zone is broken by continued selling then one may anticipate downside until 1st Support Level*

SEQUENT SCIENTIFIC By KRS ChartsDate: 4th July 2024
Time: 10:42 AM
Why Sequent Scientific ?
LH- Lower High, LL - Lower Low
HH- Higher High, HL- Higher Low
1. Applied Simple Dow Theory from year 2022 , It was consistently making LHs and LLs and very first time in Feb 2024 it breaks previous high and makes new HH , which is considered as a beginning of reversal.
2. After that on 3rd June Price action made new HL for first time without breaking previous LL level and moving upwards with strong candles and volume.
3. Meanwhile, on weekly TF price took support from 100EMA too and makes strong upward moves.
Target 1 - ~203 Rs.
Target 2 - ~260 Rs.
SL- Weekly Closing below 100EMA

SEQUENT SCIENTIFIC : Swing Trade#SEQUENT #swingtrade #breakout #momentumtrade #trendingstock
SEQUENT :
>> Momentum Stock
>> Trending Setup
>> Volumes Dried Up
>> Good Strength in Stock
>> Good Risk Reward
Swing Traders can lock profit at 10 % and keep Trailing
Please give a Boost or comment if u r Liking the analysis & Learning from it. Keep showing ur Love by following
Disc : Trade Ideas shared for Learning Purpose, not a Trade Recommendation

Sequent Scientific cmp 177.90 by Weekly Chart viewsSequent Scientific cmp 177.90 by Weekly Chart views since listing day
- Support Zone at 140 to 145 Price Band
- Price going upwards by Rising Support Trendline and having crossed Falling Resistance Trendline
- Upside targets to expect of 200++ and then some more based on continued price action and volumes momentum are sustained

Sequent Scientific- C & h breakout done decisivelyCup and Handle breakout done last week.
Targets are mentioned in the chart as red lines which is nothing but the intermediate resistances. The green colour is the final target.
Note: This is for educational purpose only.

Sequent Scientific PE is negative at -42
THE CARLYLE GROUP ACQUIRES A MAJORITY STAKE IN SEQUENT SCIENTIFIC LIMITED
Shares of Sequent Scientific soared over 9 percent in early trade on September 15 after the company's board approved the sale of its API (Active Pharmaceutical Ingredient) facility in Thane
Sequent Scientific (NSE:SEQUENT) delivers shareholders decent 8.8% CAGR over 5 years
Sequent Scientific shares jump 15% after terminating Tineta Pharma's proposed acquisition
mutual funds have increased stake from 0.25% to 1%
DII also increasing stake significantly
stock has come out of accumulation Phase!!!

Sequent Scientific potential rounding bottom formationSequent Scientifica CMP 122 ready for good upside with low correction potential. Can be added for 145/180/200 for longterm gains.
Sequent Scientific is India's leading animal health company, with presence in 5+ continents across 100 countries. Sequent Scientific Limited provides a wide-ranging portfolio of animal health products, including Finished Dose Formulations, APIs, as well as analytical services to the pharmaceutical and life sciences industries.

Sequent Scientific Ltd Analysis Stock has given move on daily & weekly chart with good volume and near to BO zone, and also trading above 200 DMA, follow chart for proper entry and exit levels.

Base complete in Sequent?Chart -> Sequent Scientific Daily
CMP: 89
Good Range To Buy: 83 to 89
Targets: 95, 105, 113, 124
SL: 79.50 Daily Close
Disclaimer: This is for educational purposes only, not any recommendations to buy or sell. As I am not SEBI registered, please consult your financial advisor before taking any action.

SEQUENT SCIENTIFIC - Trendline BrokenThe stock has given a trend line breakout with Good volume.
Can go long @ Current Market Price.
The levels are mentioned in the chart.

SequentAvailable at a good price for a long term investor. One can also take a swing trade. Note: Just for educational purpose.

SEQUENTCMP: 181
Stock has taken support near 140-145 level.
Also completed 61.8% retracement from its all time high.
Looks ready to go up.
Expectation: 225, 267

SEQUENT SCIENTIFIC rising from ashesCHART -> SEQUENT SCIENTIFIC DAILY SETUP
As we can see on chart, Sequent Daily chart is giving three bearish trendline breakouts. MACD finally going positive after August. Huge volumes also in last 2 days.
These factors should act as a forward looking journey for SEQUENT SCIENTIFIC.
Disclaimer: This is for educational purpose only. This is not any recommendations. I am not SEBI registered. Please consult your financial advisor before taking any action.

Sequent, new breakoutSequent scientific breakout is done.
Adding more quantity.
For long term only.
#vr

Sequent Scientific Descending channel breakoutChannel breakout above 170
RSI crossing above 55 will give bullish momentum

Chart Analysis of Sequent Scientific (11 Dec 2021)It is still trading in this downward channel. I don't expect the trend to change until and unless this downward channel is broken on the upper side.
I request everyone to wait for the signal and not rush in this stock. Don't get trapped looking at the volume.

Sequent ScientificSequent Scientific is in Animal Pharma API business, it is a very strong player in a relatively small industry. The stock is currently at its 61.8% retracement level. The stock should take support here, however, expect a time wise correction now in this counter. I remain Neutral but this can be a good accumulation zone if the levels are held.

Sequent Scientific | DailyLets Zoom-in to our Weekly chart shared previously and see what's happening in Sequent Scientific.
As mentioned in our previous weekly view, a weekly close below 214 level may result in trend reversal (Downtrend) for this stock.
Now, what can we see on Daily chart?
1)Today's close took support around 214-215 zone.
2)Bullish RSI divergence can be seen. Where Price making LL & RSI making HH.
3)RSI on weekly support (Check on weekly chart).
5)Upside gap yet to be filled.
Indications are at positive side but at the same time maintain cautiousness around 214 zone.
Lets see how things unfolds!!

Sequent Scientific Weekly View1) Weekly Trendline Support Broken.
2) Entered into Stage III - Consolidation/Minor correction.
3) Taking Support at 225.
4) If we apply Dow Theory:
(i) A close below previous swing low (HL/214) may result in change of Trend. Which is Stage IV - Downtrend. OR
(ii) Stage III may continue for a while before it enters next Stage II - Uptrend.
