Share India Securities Ltd. ---- Deep AnalysisShare India Securities Ltd.
1. -----Company Technical Analysis Data
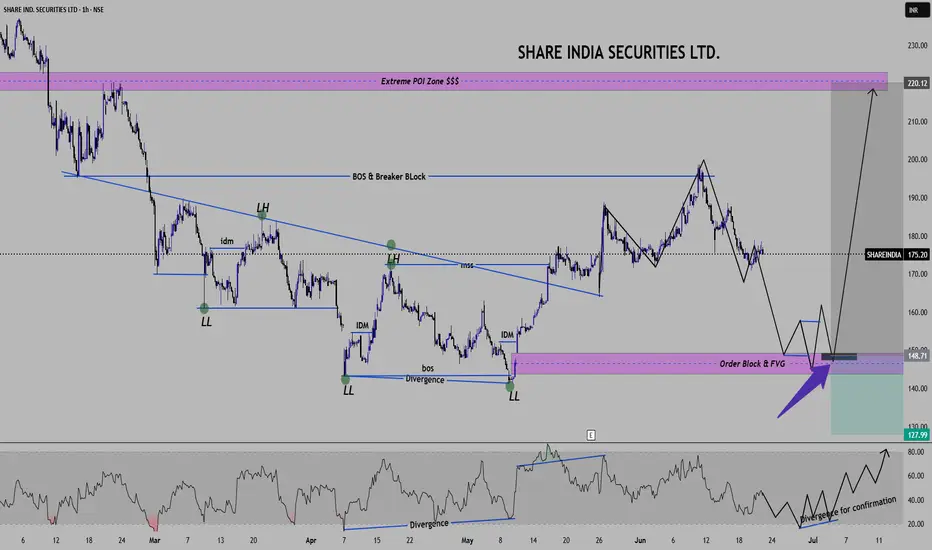
Analysis -- Based on ICT and SMC Concepts
TIME Frame -- 1 hour
Chart Elements & Observations ----
Market Structure -- 1. Clear bearish structure earlier with Lower Lows(LL) and Lower High(LH).
-- 2. Market Structure Shift (MSS) observed which indicates a possible reversal
-- 3. BOS(Break of structure) confirms shift from bearish to bullish bias.
Short Term Outlook (3-6 Weeks) ---
-- Price is currently retracing after recent high (190 levels)
-- We are projecting price to move down to the demand zone @150-160 levels followed by accumulation and reversal.
-- Short term plan is just watch price around 145-150, if price forms a liquidity sweep + Bullish structure then
this is a potential buy Zone.
-- RSI confirmation will strengthen this zone (here we will look for bullish divergence again.)
Short term trade plan -- Buy zone - 145-150 (after confirmation Liq. sweep, bullish engulfing candle and OB Tap)
Stop Loss - 135--138 (Liquidity Below demand)
Target -1 ---- 175 (Retest structure)
Target -2 ---- 190 (Recent High),
Target -3 -----220 (Extreme Liquidity Zone)
Keep note that ----- If price 148-145 demand zone fails then next Higher Time Frame demand may come near 135 levels.
All Traders and Market Influencers, Your Views or comments are most welcomed. Thank You.
==============================================================================
SHAREINDIA
Shareindia securities flag breakoutAfter technical correction after reaching target(check previous charts) and stock split shareindia reversal happening with a flag breakout. Shareindia has very good fundamentals.

ShareIndia Securities ReversalShareIndia 61.8% fib level of wave 2 to 3 held as support. Looks like wave 3 to 4 is over. Still don't see positive divergence in weekly chart. Can expect final wave to rise and reach above target levels as per chart.

SHAREINDIA - Weekly breakout and retest SHAREINDIA - Weekly breakout and retest successful. The stock shows a very healthy growth both fundamentally and technically. Great place to enter with a handsome risk: reward.
Note: It's important to note that these observations reflect my personal views, and I recommend conducting thorough research before making any buying or selling decisions.

SHAREINDIASHAREINDIA:- The stock has given a breakout after 11 months. Volumes are also showing good.
Hello traders,
As always, simple and neat charts so everyone can understand and not make it too complicated.
rest details mentioned in the chart.
will be posting more such ideas like this. Until that, like share and follow :)
check my other ideas to get to know about all the successful trades based on price action.
Thanks,
Ajay.
keep learning and keep earning.

Kindly Share SHAREINDIA with India !!!-3 Years ROE 46%
-Good profit growth of 86.8% CAGR over last 5 years
-Annual Net Profit rose 63.47% in the last year to Rs 328.83 Crores. Its sector's average net profit growth for the last fiscal year was 66.88%.
-Quarterly Net profit rose 39.35% YoY to Rs 82.11 Crores. Its sector's average net profit growth YoY for the quarter was 54.56%.
-PE Ratio is 13 lower than its sector PE ratio of 24.

Share India: Breakout and Growth Potential.Hello guys I hope you guys are doing great.
I am back again with a short analysis of share India securities LTD.
Chart is self explanatory so, we will keep it to the point. As we can see in weekly timeframe Share India has been consolidating for the past 18 months. Initially, it formed a descending triangle pattern and gave a breakout. Subsequently, it started forming a head and shoulders pattern, and this week it experienced a strong breakout. The company is fundamentally strong. Although it falls under the small-cap category and operates as a stockbroker, it is experiencing significant growth. We could consider a target of 25% with a stop loss set around 18%.
Do consider pressing the boost button🚀🚀, It helps me bring more interesting analysis. And if you've any question and suggestion please feel free to post in comment section.
Note: This is for informational purposes only. Do your own research before investing.

YR 2022 Idea #65: Long on SHAREINDIAThis is a public swing trade idea and is only for Learning and observational purpose. Please understand your risk and take full responsibility of your actions. I might trail my stoploss after I get an entry but even if my original Stoploss hits, i exit the trade with pre-planned loss (risk). At target, I book usually 75% positions and trail stoploss for rest. Our objective to help anyone who wants to learn technical analysis using charts by demonstrating my real trade entries. You can post your queries in comment section here and we will try to answer them asap.

SHAREINDIA Rising in Silence !!!!As the title states , SHAREINDIA has steadily shown a breakout
of cup and handle pattern with accumulating volume without
facing much resistance at its neckline.
RSI is also showing a uptrend with higher highs again
a positive signal.
MACD is also maintaining its strength.

Share India Securities Ltd-Trendline Breakout Daily Time .Swing Trade-Share India Securities Ltd. Trendline Breakout Daily Time Frame-Expect a 5-7% Return on This Stock. Only Education Purpose.


SHARE INDIA DAILY CHART ANALYSIS AS ON 23.12.2021POSTED 22.12.2021 SHARE INDIA above 933 level for a target 950 level and today the stock made a high 1055 and closed at 1007 level. Happy Trading to All

SHARE INDIA DAILY CHART ANALYSIS AS ON 22.12.2021SHARE INDIA as per daily chart analysis the stock is super bullish and above 933 level target 950 is achievable. Happy Trading to all. Tomorrow Market will be bullish.

Share India- Daily chart
- Swing/ Positional Idea
- Breakout, Strong absolute and relative momentum
- Strong Numbers
- Looks good for a swing or position on a pullback, little extended from short term averages right now

SHARE INDIA--> Super bullish breakout with volumeThe above references an opinion and is for information purposes only. It is not intended to be investment advice. Seek a duly licensed professional for investment advice
