Share India Securities Ltd. ---- Deep AnalysisShare India Securities Ltd.
1. -----Company Technical Analysis Data
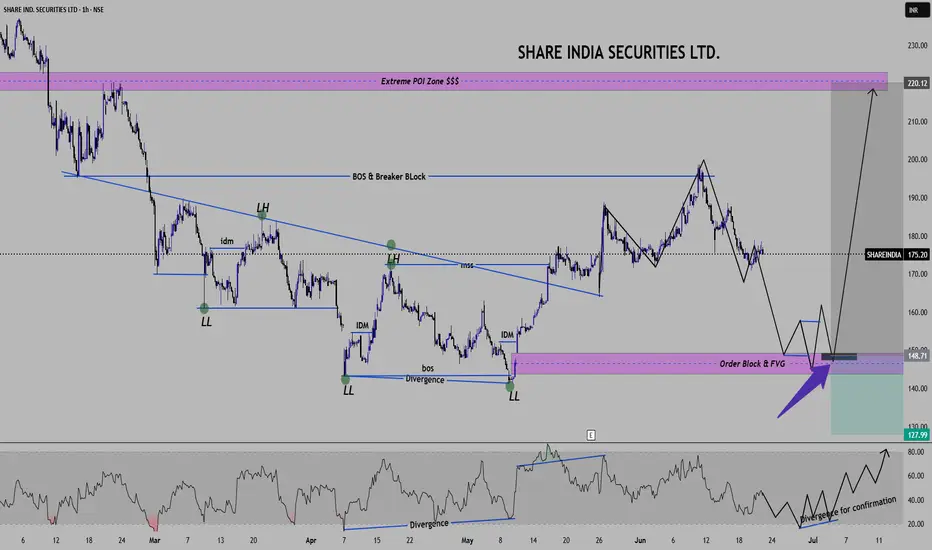
Analysis -- Based on ICT and SMC Concepts
TIME Frame -- 1 hour
Chart Elements & Observations ----
Market Structure -- 1. Clear bearish structure earlier with Lower Lows(LL) and Lower High(LH).
-- 2. Market Structure Shift (MSS) observed which indicates a possible reversal
-- 3. BOS(Break of structure) confirms shift from bearish to bullish bias.
Short Term Outlook (3-6 Weeks) ---
-- Price is currently retracing after recent high (190 levels)
-- We are projecting price to move down to the demand zone @150-160 levels followed by accumulation and reversal.
-- Short term plan is just watch price around 145-150, if price forms a liquidity sweep + Bullish structure then
this is a potential buy Zone.
-- RSI confirmation will strengthen this zone (here we will look for bullish divergence again.)
Short term trade plan -- Buy zone - 145-150 (after confirmation Liq. sweep, bullish engulfing candle and OB Tap)
Stop Loss - 135--138 (Liquidity Below demand)
Target -1 ---- 175 (Retest structure)
Target -2 ---- 190 (Recent High),
Target -3 -----220 (Extreme Liquidity Zone)
Keep note that ----- If price 148-145 demand zone fails then next Higher Time Frame demand may come near 135 levels.
All Traders and Market Influencers, Your Views or comments are most welcomed. Thank You.
==============================================================================
Shareindiasecurity
Pull Back Pattern Seen with Long Lower Shadow Hammer CandlestickHello everyone, i hope you all will be enjoying the weekend, but let's do some learning now.. i have found a stock which has shown a pull back pattern with long lower shadow hammer candlestick pattern on weekly chart. Stock name is Share India Securities Ltd and it is a financial service provider that uses technology to offer customized capital market tech-based solutions to clients. It offers financial products & personalized services, including equity broking, currency & commodity derivative, depository participant services, mutual fund advisory and distributorship, etc to retail and corporate clients. The co. has a PAN India presence with 61 branches of NBFC business and, 293 sub-brokers/franchisees.
Let's learn about the pattern which i have written in Title:-
Q:- What is Pull back pattern?
Ans by Rahul:- Pullback is a term used in stock trading that refers to a price decline from an existing high point. This decline is usually temporary and serves as a correction after an upward trend. Pullbacks are common in the stock market, and they offer traders opportunities to buy stocks at discounted prices.
Q:- How to Trade Pull back patterns?
Ans by Rahul:- For trading pull back pattern there is strategy and this strategy works by waiting for a stock’s price to decline from previous highs before buying it. The idea is that when there is a dip in prices, there is usually an opportunity for investors to buy into the stocks at lower prices, and then sell their shares once the stock rebounds. if you look at the Share india chart above, you will see after breakout stock rallied almost 35% and made high at 405 and now stock again came at their support zone where stock had given breakout earlier, we also call this breakout retest strategy. So this is the zone where we have to try to accumulate and keep your stop loss at below to support zone, for the Targets you can plan previous highs or you can expect same length of previous consolidation zone.
I hope now you guy's have learned about pull back pattern and how to trade to these patterns, Right. If yes then do not forget to hit like and share with others after you done reading.
Let's focus on other aspects of company:-
Company History
The Co. was established in 1994 and entered the equity broking segment in 2000. Subsequently, it diversified its offerings by undertaking derivatives trading in 2007, currency trading in 2008 and commodities trading in 2012.
In 2016, it was registered as a Mutual Fund Advisor with AMFI and in 2018 it registered as a Category I Merchant Banker & Portfolio Manager with SEBI. In 2020, it moved from SME platform to BSE Main Board.
New Launch
In FY24, the co. launched Algo Platform – uTrade Algos for automated trading.
In FY23, it launched a Retail Platform - IBT, a digitally-enabled online account opening and trading platform.
Market Cap
₹ 5,953 Cr.
Current Price
₹ 302
High / Low
₹ 408 / 233
Stock P/E
14.0
Book Value
₹ 91.2
Dividend Yield
0.56 %
ROCE
38.3 %
ROE
31.0 %
Face Value
₹ 2.00
Industry PE
17.9
Debt
₹ 403 Cr.
EPS
₹ 22.2
Promoter holding
52.3 %
Intrinsic Value
₹ 754
Pledged percentage
36.2 %
EVEBITDA
6.54
Change in Prom Hold
-0.87 %
Profit Var 5Yrs
76.9 %
Sales growth 5Years
48.4 %
Return over 5years
81.1 %
Debt to equity
0.23
Net profit
₹ 426 Cr.
ROE 5Yr
37.5 %
Profit growth
30.0 %
Earnings yield
15.0 %
Disclaimer:- Please always do your own analysis or consult with your financial advisor before taking any kind of trades.
Dear traders, If you like my work then do not forget to hit like and follow me, and guy's let me know what do you think about this idea in comment box, i would be love to reply all of you guy's.
Thankyou.
