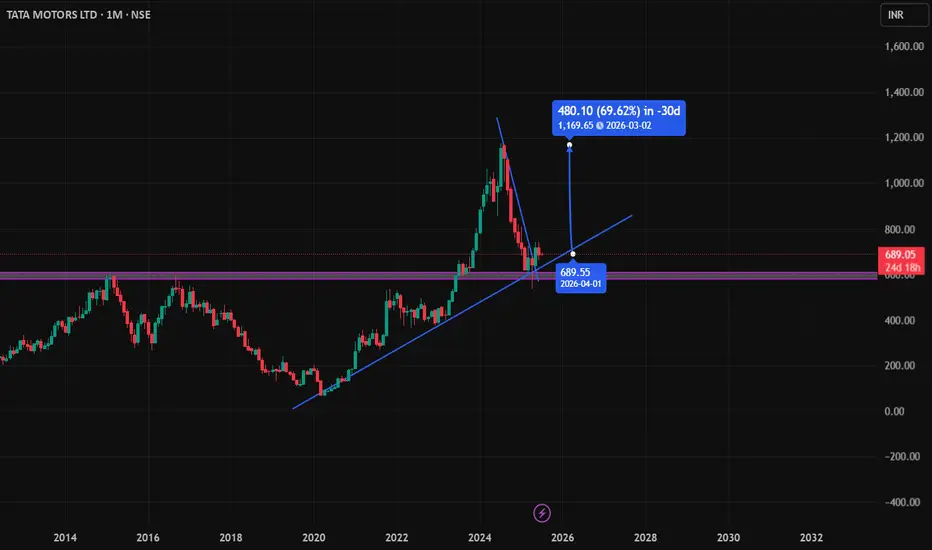
Tata Motors Long SetupTata Motors has confirmed a breakout from its recent downtrend, indicating a potential reversal. The breakout is supported by the formation of a strong bullish candle right at a key support zone, signaling renewed buying interest. This setup suggests favorable risk-reward for a long position, especially with increasing volume and momentum backing the move. Traders can consider entering above the breakout candle with a stop loss below the support.
Sharemarket
HERITAGE FOODS (LONG TERMVIEW)Trendline Breakout With Retest
Big Bar Breakout
Proper Retest
20-30% Upside Potential
Till Then Stay Focused

"Selling Shares in Under a Year? Know Your Tax Rules!"💰 Sold shares and made a profit? Wondering if you pay tax on the full sale or just the profit? In this video, we break down Short-Term Capital Gains (STCG) tax in simple terms — including how to calculate tax, adjust losses, and carry forward STCL. No jargon, just clear answers every beginner needs!

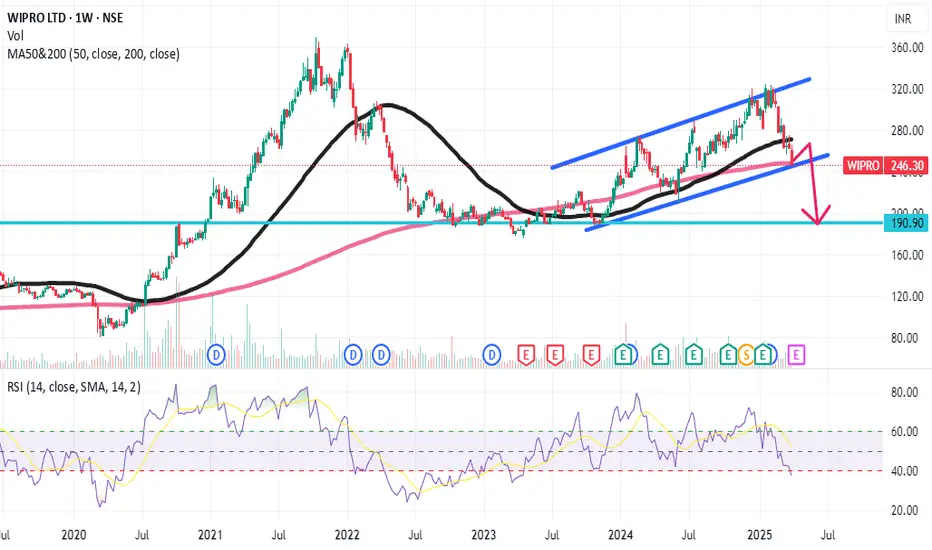
Wipro breakdown Higher probality?A very high probability that stock of Wipro can breakdown from the level. This says channel break. RSI also below 40 levels. This is for your educational purpose only.
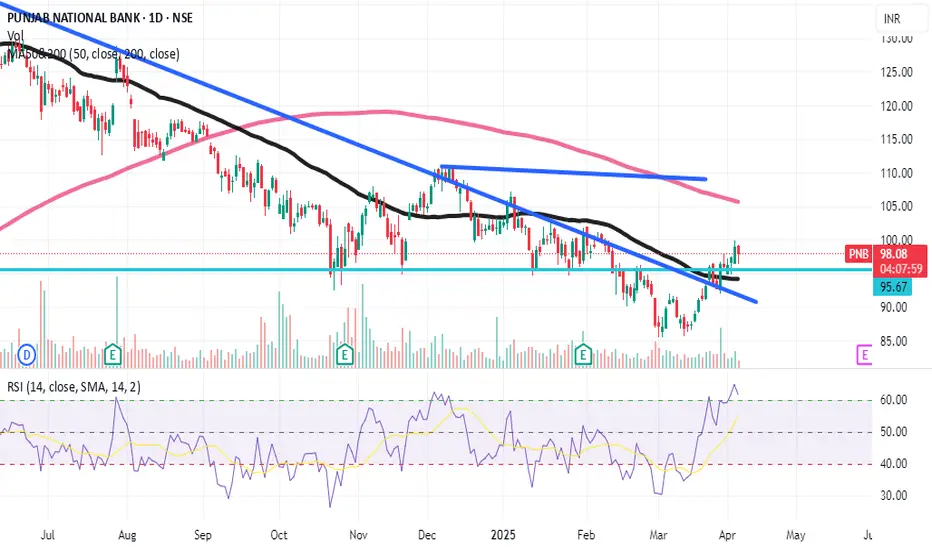
PNB is really Trend shifting?High probability that trend shifting can be seen in PNB bank. On daily chart high probability of trend reversing with the support of 50 EMA. Also stock is trading above the resistance area. Can take long entry above 99 for the first target between 112-115. later we can trail the SL .This is for your educational purpose only.
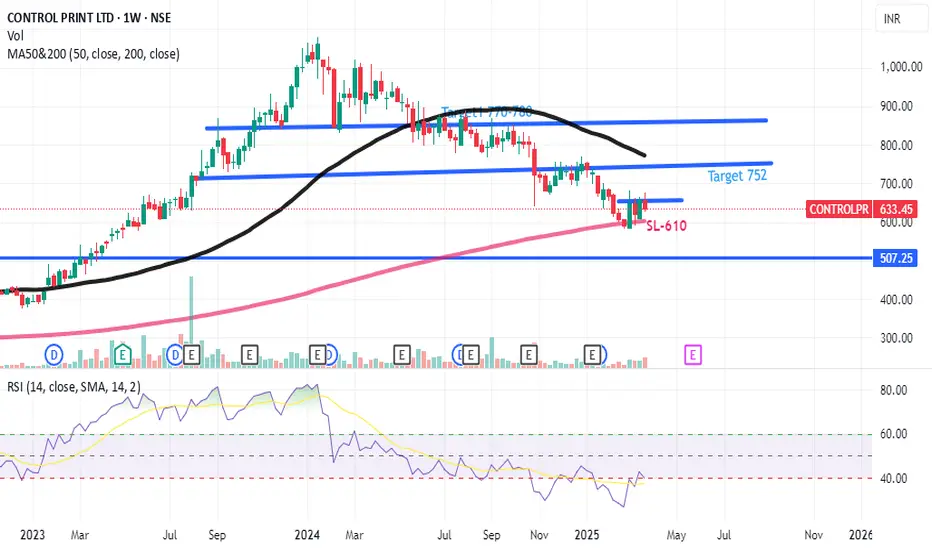
Control Print stock to take Long entryLong Control Print above 640 for the 1st target of 750 with SL 611. A very good setup with risk to reward ratio. After a long time stock is touching the 200 EMA & consolidating at the level. On shorter time frame we can go long. This is for your educational purpose only.
Ambuja cement long?Watch on weekly chart ambuja cement also taking 200 EMA suport. Can touch above 600 levels.
This is for your learning purpose only. Happy trading.

ACC can take Long entry?ACC stock has been crossed 50 & 200 EMA levels on the hourly charts. A very high probability that stock is able to breakout from the area . A good risk to reward trade setup has been shared for learning purpose. Happy trading.

Long entry in BSEFor the First on the daily chart we have seen the BSE stock trading in bullish mode above the 200 EMA levels. A long entry for both trading & Investment can be seen in the stock. Below the 200 EMA we can keep the SL. Good risk to reward trade.

Long Artemis stockThe stock showing pull back from the current level. W pattern has been formed on the daily chart as well as clear breakout of the resistance zone. All Important levels are marked on the charts. Happy trading.

ADANI PORT TO TAKE LONG ENTRYLong Adani Port between 1175-1180 for the next target of 1250-1300 shortly with the small stop loss as per chart. The stock has trading above the 50 RMA and after retest is also completed. On daily chart the RSI is above 60 is the bullish sign. A very high probability that stock will bounce from the level. Happy trading.

Bear Market Survival Guide : Strategy vs Area of TradingI make educational content videos for swing / positional trading

Infosys Technical Analysis #Infosys stock price has recently shown a bearish signal by breaking below a harmonic pattern's at 1840.00, with potential for further decline towards a Price Reversal Zone . This could signal a short-term correction or a deeper pullback.
#StockMarket #stocks #MarketOutlook

Indian energy exchange in weekly analysisIndian energy exchange in weekly analysis
It touches the previous support RSI is below 40 and MACD is also crossover signal line as per technical analysis
company also give good quarterly result is expected to give quarterly result as well as in future
do your study and then invest

Tata consumer productTATA consumer product in weekly analysis
It touches the trend line that supported from more than two years
Company also give good quarterly result as compared to previous quarter
Company also expected to give higher than current profit in this quarter

NIFTY... ELLIOT WAVES COUNTING....Dear friends,
As we see in the chart, Nifty is correcting rapidly from an all time high level.
While counting the Elliot waves, we can see that waves 1 and 3 on the downside have been completed.
The five waves of wave 3 are shown in the chart.
Now we can expect wave 4, which is likely to consolidate for a few days.
Wave 4 is likely to have moves on either sides and it can form a zig zag or a flat or a triangle pattern. I had shown a flat pattern of wave 4 in the chart.
As per my view, the right time to invest will be at the end of wave 5 which is likely to be around 24000 to 24300 levels.
Get ready to ride the bumpy wave 4 guys!
Trade with appropriate stoploss.

CAN MARKETS SURPRISE US??? BANK NIFTYIndian markets are at an all-time high. Both Nifty and Bank Nifty are trading near their resistance levels.
Technically, a correction is due. I'm not expecting any big upside move in Indian indices.
I won't be surprised if Bank nifty corrects by 3000 points in the coming days.
This would correspond to the length of wave 3 as well as 0.618 Fibonacci retracement.
Trade with appropriate stop-loss.
PS: MARKET is always RIGHT!

Rico Auto near EMA support.There is a very high probability that the stock of Rico Auto can bounce back from the 50 EMA levels. In the past, we have seen many times, that the stock has taken support from the same level. On any bullish signal, we can take entry for the next swing trade. Keep the stock in your watch list. This is for your educational purpose only.

Adani Green ready for massive breakoutKeep the stock in your watch list Adani Green is going to break out the resistance area as well as the high resistance zone. Buy on the break out for the next target of 2400 and 2800 in the next few months. This is for your educational purpose only

JTEKINDIA to take long entryWatch the stock of JTEKINDIA taking 50 EMA support every time on the weekly chart. This time, the stock is also trading in the same area. There is a very high probability that the stock will bounce back from the current levels. If in the coming days, the stock shows the volumes. A very good risk to reward trade. All important levels are marked on the charts. This is for your educational purpose only.

Silver Futures: Navigating the Bullish Breakout
The Silver Futures chart presents a compelling picture, but as we know, navigating the market demands more than just technical analysis. Let's break down what we see:
Bullish Signals: The decisive breakout above the VWAP, coupled with the series of green Heikin Ashi candles, paints a bullish picture. The recent breach of the Base Camp level further strengthens this positive outlook.
VWAP as a Guide: The VWAP is now acting as dynamic support, offering potential buying opportunities on dips. However, remember that even in a bullish scenario, the market can be unpredictable.
Beyond the Chart: While technicals are promising, external factors can sway silver prices. Keep an eye on global economic indicators, geopolitical tensions, and any news that might impact precious metals.
Applying the Wisdom:
Don't Get Complacent: Even with a bullish setup, risk management is paramount. Set stop-losses to protect your capital in case of unexpected reversals.
Stay Informed: Technical analysis is valuable, but it's only one piece of the puzzle. Stay updated on fundamental factors that can influence silver's price trajectory.
Avoid Blind Faith in Tips: This bullish setup might attract stock tips, but remember, no one can predict the market with certainty. Do your own research and make informed decisions.
In Conclusion:
The Silver Futures chart is signaling a potential bullish trend. However, successful trading involves more than just following signals. Combine technical analysis with a keen understanding of market dynamics, risk management, and a healthy dose of skepticism towards "hot tips." This approach will increase your chances of navigating the market successfully, even when faced with its inherent unpredictability.
Disclaimer: This is an analysis, not financial advice. Trading involves risk; conduct your own research and consider your risk tolerance before making any investment decisions

Campus- A high risk bottoming breakout for multibagger returns!Campus is a typical example of bottoming breakout done with volumes.
I had given it as an example of falling knife stock but now looks good for a U-turn.
ATH from here means 2x returns.
Please note that Stock doesn't have good fundamentals currently.
Invest as per your risk appetite after discussion with financial advisor. Not a recommendation.

Cummins stock is ready for breakout?Cummins stock is trading near the high resistance zone area. There is a very high probability that the stock would break the resistance zone. Buy 50% qty @ 3870 and add more qty around 3880 after the clear breakout. This shows a strength in the stock. Also, the long-term trend is positive. Target near 4175-4200 with SL 3725. This is for your educational purpose only.
