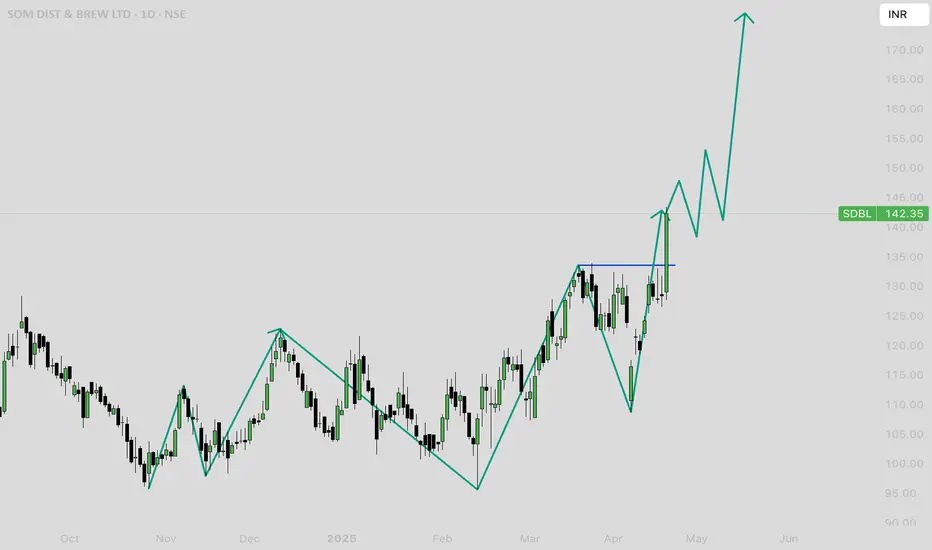
Som Distilleries & Breweries Ltd (SDBL) Price Analysis
- **Current Price:** ₹156.00 (all-time high as of April 22, 2025)
- **Day’s Range:** ₹127.66 – ₹143.40
- **Previous Close:** ₹128.38
- **Volume:** 13.36 million (well above 20-day average of 1.34 million)
- **52-Week Range:** ₹95.61 – ₹148.90 (new all-time high today)
- **VWAP:** ₹137.86
- **Market Cap:** ₹2,931 crore
### **Trend & Momentum**
- SDBL has surged sharply, breaking out to a new all-time high with exceptionally high volume, indicating strong bullish momentum
- The stock has rallied over 20% in a single session, moving far above recent resistance levels and its VWAP
- Technical patterns suggest a bullish formation with potential for further upside, possibly another 10% move, according to chartists
### **Support & Resistance**
- **Immediate Support:** ₹143.40 (today’s high), then ₹127.66 (today’s low), and ₹128.38 (previous close)
- **Resistance:** With a new all-time high at ₹156.00, the stock is in price discovery; next resistance will form as the stock trades higher
### **Valuation**
- **TTM PE:** 30.48 (sector PE: 88.54)
- **P/B:** 4.75
- **EPS (TTM):** ₹4.67 (+5.28% YoY)
- **Book Value per Share:** ₹30.02
### **Outlook**
- **Short-Term:** The breakout and volume spike suggest continued bullishness. However, after such a sharp rally, some profit booking or volatility is possible.
- **Medium-Term:** Sustained trade above ₹143–₹148 keeps the trend positive. Watch for consolidation near new highs before the next leg up.
- **Downside Risk:** If the stock falls below ₹143, it may retest support around ₹128–₹130
Shark
PUNJAB NATIONAL BANK (NSE) PNB Trade Setup - Key Levels to Watch! 📊📉📈
Stock: PUNJAB NATIONAL BANK (NSE)
Timeframe: 1D Chart
Current Price: ₹87.39
Entry Level: 86 to 87 ⚡
Stoploss: Below ₹84.19 (If weekly close is below ₹84, next major support is ₹74)
🎯 Bullish Targets:
✅ ₹94.70
✅ ₹99.47
✅ Final Target ₹107.22
✅ If 'C' Breaks, Next Target ₹127 - ₹130 (6-8 Months)
🔻 Bearish Breakdown Levels:
🔴 ₹84 Breakdown → Next major support at ₹74

Crude oilAll detail for chat. good entry at mark price only. and must stoploss minimum risk and good profit. risk ratio 1:1 to manage modified SL.
📌 This is not a buy/sell recommendation, just an educational trading idea.
📌 Market conditions can change; always conduct your own research.
📌 Understand risks before investing and take full responsibility for decisions.

JUBLFOOD Probable price actionBased on the recent price action for Jubilant FoodWorks Ltd (JUBLFOOD), the stock shows a bullish trend in the short term:
1. The stock closed at ₹670.5 on February 14, 2025, up 1.27% from the previous close.
2. JUBLFOOD has been in an uptrend since late January 2025, rising from ₹638.65 on January 27 to the current price of ₹670.50.
3. The stock has shown strong momentum, breaking above the ₹700 level in early January before a brief pullback.
4. Recent price action indicates a recovery from the pullback, with the stock forming higher lows and higher highs since February 12, 2025.
5. The stock is trading above its 50-day moving average of ₹699.307, suggesting bullish sentiment in the medium term.
6. Volume has been above average in recent sessions, with 4,032,606 shares traded on February 14, compared to the average volume of 2,001,293.
7. The stock is showing strength relative to its 52-week range, currently trading closer to its year high of ₹796.75 than its year low of ₹421.05.
However, traders should note some potential resistance levels:
1. The stock may face resistance near the ₹700 level, which it failed to hold in early February.
2. The year high of ₹796.75 could act as a strong resistance if the uptrend continues.
Overall, the price action suggests a bullish short-term outlook for JUBLFOOD.

SHREECEM Price action analysisBased on the latest available data, the price action analysis for Shree Cement Ltd (SHREECEM) indicates a bullish trend in the short to medium term:
1. The stock is trading above its key moving averages, including the 5, 10, 20, 50, 100, and 200-day moving averages, suggesting strong upward momentum.
2. As of February 14, 2025, the stock was showing bullish signals for short-term, medium-term, and long-term investors.
3. The current price is significantly higher than the 200-day moving average of 26,081.26, indicating a sustained uptrend.
4. Recent price action has formed a cup and handle pattern on the daily chart, which is typically considered a bullish continuation pattern.
5. The stock has been in an uptrend since September 2023, breaking out of a sideways movement that had persisted since August 2022.
However, it's important to note some potential caution signals:
1. As of January 21, 2025, there were indications of a possible short-term downtrend, with the price falling below the important level of 25,422.22.
2. The stock was trading below its short-term Volume Weighted Average Price (VWAP) of 25,264.61, suggesting some selling pressure.
3. Technical indicators like ADX and MACD were showing sell signals in the short term as of January 21, 2025.
Given the conflicting signals between the January and February data, traders should closely monitor the stock for confirmation of the current trend and be aware of potential volatility.

Bharti Airtel SL day candle close only, Target Trigger Price
All detail for chat. good entry at mark price only. and must stoploss minimum risk and good profit. risk ratio 1:1 to manage modified SL. This is not call, Just my idea. Please understand your risk and take full responsibility of your actions

Gold Next Move SL 1Hr candle close only, Target Trigger Price
All detail for chat. good entry at mark price only. and must stoploss minimum risk and good profit. risk ratio 1:1 to manage modified SL. This is not call, Just my idea. Please understand your risk and take full responsibility of your actions

Copper Next Move SL 1Hr candle close only, Target Trigger Price
All detail for chat. good entry at mark price only. and must stoploss minimum risk and good profit. risk ratio 1:1 to manage modified SL. This is not call, Just my idea. Please understand your risk and take full responsibility of your actions

LICI Needs InsurancePatrons,
Today I came up with NSE:LICI on weekly time frame forming a Bullish shark pattern. At Present, Price crossed B Leg and took and testing the B Leg for resistance. I am expecting price to test 886.15 levels and breaks 818 lower level to reach 663.20 Level which is D Leg. Enthusiasts can look for long at 663.20 levels.

Swing Positional in CholaFinIdentified A shark in Cholafin on 30 MTF Potential Reversal Zone 1 & 2 are 1173, Support at 1165

LTF for Long Positions Price Range with Shark and Butterfly patterns is identified in L&T Finance Ltd.
There are my ideas but Not any Trade Recommendations.

Revered from B Leg, Will it Form a Shark?HDFCBANK, A major contributor for NSE: NIFTY50 may see a little downfall considering harmonic analysis on Daily, Weekly Time Frames.
At this Juncture Let us consider Daily Time Frame, and as drawn on charts it is about to form a Bullish Shark Pattern which is reversed from B Leg.
Expected Behavior can be as represented in Red Color path.
As price comes down from 1775, Price may reach to 1690.80 which is PRZ1 Level.
on Weekly Time Frame(WTF), Price is expected to reach 1425-1400 Levels as major shark pattern completes its D Leg.

Reliance; Is it a Crab ? or a Shark?In Reliance, I have identified two patterns -
Major Pattern - Shark
Minor Pattern - Crab
We need to wait and see which pattern will unfold Bullish Reversal.
I Prefer Shark here as it is Major Pattern. Minor Pattern may give knee jerk reversal.

It's on Level; Let it Raise.DMART, has just created its Terminal Bar by touch all its PRZ Levels forming Bullish Alt Shark.
Terminal Bar + 1 Candle is also indicatively reversed by by showing a a Bullish Harami Pattern.
Take Secondary Methods into consideration before entering into Trade.
Type 1 Reversal journey will start now.
4221 will be Type 1 initial Reversal Target.

Guess !!! How Much Further Fall Can we Expect in Asian PaintsA Deep Crab, and A Crab are Identified in Asian Paints.
There is much more to fall, Will update as price reaches near to Reversal Zones

Bullish SharkIn M&M Fin Serv (M&MFIN) a Bullish Shark formed and took Type 1 Reversal and Price is coming to retest Reversal Zone for Type 2 Reversal.

BULLISH SHARKAs Harmonic Analyst, I have identified Potential Reversal Zone One (PRZ1) at 647.15 and Potential Reversal Zone Two (PRZ2) at 655.40 on Weekly Time Frame.
Observe Terminal Bar strength and Proceed.
Look for Type 1 Reversal Target as 850 Before Price comes back retesting to Initial Reversal Zone.

$ETH Bullish Shark Pattern: Key Levels and Potential New ATHCRYPTOCAP:ETH has formed a bullish shark pattern, indicating a potential move towards the $3,850 level initially. Following this, there's a likelihood of a drop to around $3,550, possibly forming a double bottom before rallying to a new all-time high.

CIPLA - TrendlineCIPLA is bouncing from weekly timeframe trendline. Price bounce area confluences with Shark harmonic pattern and double confirmed by hammer candle
Entry around 1500 SL if price settles below 1470 target 1575-1600

Crufeoil SL 1Hr candle close only, Target Trigger Price
All detail for chat. good entry at mark price only. and must stoploss minimum risk and good profit. risk ratio 1:1 to manage modified SL. This is not call, Just my idea. Please understand your risk and take full responsibility of your actions

USDT.D formed bearish shark pattern USDT.D formed bearish shark patten and also formed clear bearish divergence .
which clearly shows it will retest 5.19% area if that also breaks bullish for crypto market
usdt.d and btc & altcoins are inversely related so we can expect pull back .
btc targets around 65k & 69k.

SEI/USDT: Bullish Shark Pattern Signals Potential RallySEI/USDT has formed a bullish shark pattern and is showing a bullish divergence bounce, indicating strength.
There is now a chance to retest the $0.30 level, after which a rally is expected.
The targets are $0.58 and $1.16.
#SEI #USDT #CryptoTrading #BullishSharkPattern #BullishDivergence #CryptoAnalysis #TradingTargets #CryptoRally #TechnicalAnalysis

Take Shanthigear silently Take entry at 455
Target 684
Next Average at 346 Rs
Counter belongs from Auto sector with very good Q1 result.
