Gold is currently in a corrective phase after a sharp sell-off Price is now retracing and approaching the 61.8 Fibonacci retracement zone, which aligns with previous structure resistance and a descending trendline.
📌 I’m expecting price to:
Test the 61.8 retracement zone
Face short-term rejection
Rotate towards the next support/demand zone
This is a reaction-based setup, not a prediction.
How price behaves at 5125–5140 will decide the next move.
🎯 Key Levels
Resistance / Retracement: 5125 – 5140 (61.8)
Next Support / Demand: Below 5050 – 5000
Invalidation: Strong acceptance above 5140
Follow @arunmano_fx for clean XAUUSD structure-based analysis.
Also Please Go Through My Previous Analysis Also
👉👉👉 Full structure and levels shared on TradingView👉👉👉
#IndianTrader
#ForexIndia
#ArunManoFX
Short

Nifty50 analysis(3/2/2026)Expiry day.CPR: wide + overlapping cpr: slightly bullish and consolidtion
FII: -1,832.46 sold
DII: 2,446.33 sold.
Highest OI:
cant say whats oi because of hugeeeeeeeeee gap up.
Resistance: -
Support : -
conclusion:.
My pov:
1.price has crossed the range 25500, this will be the strong support for today.
2.there is a huge gap up so market makes another rally because of short covering wait for first one and trade.
3. today is expiry that also has volatality, mind that.
What IF:
1.today market can break ATH.
2.can retest from high because most of the smart money try to entry at low .
psychology fact:
Trading fails not because of lack of opportunity,
but because most minds can’t handle unlimited freedom.
note:
8moving average ling is blue colour.
20moving average line is green colour
50moving average line is red colour.
200moving average line is black colour.
cpr is for trend analysis.
MA line is for support and resistance.
Disclaimer:
Iam not Sebi registered so i started this as a hobby, please do your own analysis, any profit/loss you gained is not my concern. I can be wrong please do not take it seriously thank you.

BTCUSD Monthly Outlook -Potential Pullback - 0.618 B4 Major Move🔴This analysis is based on the Monthly timeframe, with Fibonacci drawn from the recent swing high to the current low.
The price is currently in a corrective phase, and based on its structure and Fibonacci alignment, there is a high probability of a retracement toward the 0.618 level before the next major directional move.
📊 Key Levels & Expectations
0.618 Fibonacci zone: 105,400 – 105,800
This zone aligns with a strong historical resistance/supply area
Price may attempt a corrective pullback into this region (marked with the small red arrow)
This move should be viewed as a retracement, rather than a trend reversal.
⚠️ High-Risk Area – Not a Buy Zone
Even if the price reaches the 0.618 resistance zone, the overall structure remains weak unless there is: a strong bullish monthly close, Clear volume expansion, and acceptance above the resistance. Without these confirmations, the 0.618 zone is expected to act as a sell-on-strength area.
🩸 Downside Scenario
If rejection occurs from 105.4K – 105.8K, a larger downside move (marked by the big red arrow) becomes highly probable.
Key support to watch:
81,100 – 83,500 (critical structure support)
A break and close below this zone can accelerate bearish momentum.
🧠 Trading Perspective
This is a patience-based market:
Short-term upside is possible
But risk remains elevated
A safer approach is waiting for confirmation at key levels
📌 This idea is shared for educational and market-structure discussion only.
🔔 Note
I’ll be actively sharing structured, level-based BTC analysis here going forward.
Follow if you prefer probability-based setups over emotional bias.

Gap-Up & Gap-Down Trading – A Complete Guide1. What Is a Price Gap?
A price gap occurs when a stock opens significantly higher or lower than its previous trading session’s close, leaving a visible blank space (gap) on the chart.
This happens when new information enters the market while the exchange is closed—earnings, news, global cues, institutional orders, or sudden sentiment shifts.
There are two main types:
Gap-Up: Today’s opening price is higher than yesterday’s high.
Gap-Down: Today’s opening price is lower than yesterday’s low.
Gaps are powerful because they show urgency and imbalance between buyers and sellers.
2. Why Do Gaps Occur?
Gaps occur due to:
Earnings announcements
News events (mergers, orders, regulatory changes)
Global market cues
Institutional buying or selling
Overnight demand–supply mismatch
Short covering or panic selling
In simple terms:
👉 When traders are willing to buy or sell at any price at the open, a gap is born.
3. Types of Gaps (Important!)
Understanding gap types is critical because not all gaps are tradable the same way.
a) Common Gap
Small gap
Low volume
Usually gets filled quickly
Not very reliable
b) Breakaway Gap ⭐
Occurs at major support/resistance
High volume
Signals start of a new trend
Best for positional & swing trading
c) Runaway (Continuation) Gap
Occurs in the middle of a strong trend
Confirms trend strength
Rarely fills quickly
d) Exhaustion Gap
Happens after a long trend
High volume but weak follow-through
Often reverses and fills
Ideal for contrarian trades
4. Gap-Up Trading Strategy
A gap-up shows bullish sentiment—but buying blindly is dangerous. The key question is:
Will the gap sustain or fade?
Common Gap-Up Behaviors
Gap and Go
Gap Fill
Partial Fill + Trend
False Gap
Strategy 1: Gap and Go (Bullish)
When it works
Gap-up above strong resistance
High pre-market volume
Strong sector support
Index is bullish
How to trade
Wait for first 5–15 minutes
Enter on break of opening range high
Stop loss below VWAP or opening low
Trail stop with higher lows
Best for
Intraday momentum traders
Strategy 2: Gap Fill (Bearish After Gap-Up)
When it works
Gap-up into resistance
Weak follow-through
Low volume after open
Negative broader market
How to trade
Short below opening range low
Target previous day’s close
Tight stop above opening high
Psychology
Early buyers get trapped → price falls → gap fills.
5. Gap-Down Trading Strategy
A gap-down reflects fear, bad news, or heavy selling pressure.
Common Gap-Down Behaviors
Gap and Crash
Dead Cat Bounce
Gap Fill Rally
Reversal Gap
Strategy 1: Gap and Go Down (Bearish)
When it works
Break below strong support
High selling volume
Weak index
No buying interest near VWAP
How to trade
Short below opening range low
Stop above VWAP
Trail with lower highs
Strategy 2: Gap Fill Buy (Bullish Reversal)
When it works
Gap-down after overreaction
Stock near long-term support
RSI oversold
Strong buying volume emerges
How to trade
Buy once price reclaims VWAP
Target gap fill (previous close)
Stop below day’s low
Used by
Professional intraday & swing traders
6. Role of Volume in Gap Trading
Volume is the truth detector.
High volume + gap → Genuine interest
Low volume + gap → Trap potential
Key volume clues:
Opening spike confirms intent
Declining volume = exhaustion
Volume expansion after pullback = continuation
Never trade gaps without volume confirmation.
7. VWAP & Opening Range (Must-Use Tools)
VWAP (Volume Weighted Average Price)
Acts as institutional fair value
Price above VWAP = bullish bias
Price below VWAP = bearish bias
Opening Range (First 15 Minutes)
Breakout = trend day
Breakdown = reversal or fill day
Most professional gap traders rely on VWAP + Opening Range, not indicators.
8. Risk Management in Gap Trading
Gap trading is fast and emotional, so risk control is mandatory.
Rules:
Risk max 1–2% per trade
Always use stop loss
Avoid trading every gap
No revenge trades after loss
Trade only clean setups
Best gap traders trade 1–2 quality gaps, not 10 random ones.
9. Common Mistakes Traders Make
❌ Buying gap-up at market open
❌ Shorting gap-down blindly
❌ Ignoring higher time-frame levels
❌ Trading without stop loss
❌ Over-leveraging
❌ Assuming all gaps will fill
Remember:
Gaps don’t move because of price—they move because of participants.
10. Who Should Trade Gaps?
Best suited for
Intraday traders
Momentum traders
Scalpers with discipline
Experienced swing traders
Not ideal for
Beginners without risk control
Emotional traders
Low-capital traders without margin planning
11. Final Thoughts
Gap-Up & Gap-Down trading is one of the most powerful price-action strategies because it reflects real market emotion—fear, greed, urgency, and surprise.
But gaps are double-edged swords:
Correct read = fast profits
Wrong read = instant losses
Success in gap trading comes from:
Context (trend, support, resistance)
Volume
VWAP
Patience
Discipline
If you respect the gap, the gap will pay you.

NaturalGas ShortGo with short as Natural Gas conditions are not favor to it. Check the entry and exit point for the NatGas.
It's just our analysis we're not responsible for your losses or gains. you must do strong analysis.

TCS – Supply Zone + Channel Resistance | Short Idea (4H)Price has reached a major supply zone aligned with the upper channel resistance, creating a high-probability rejection zone.
The confluence of:
Horizontal resistance
Supply zone
Rising channel top
makes this area a strong rejection point.
🔵 Reason for Short Setup
Price is reacting at a previous rejection zone
Clear bearish wick activity near resistance
Channel structure shows exhaustion at the top
Risk:Reward remains favorable
🎯 Trade Plan
Entry: Around current rejection zone
Stop-Loss: Above supply zone + channel breakout
Target 1: Mid-channel
Target 2: Lower channel support
🔍 Market Structure
4H trend is still forming higher lows, but momentum weakens at resistance
If price closes above the blue zone, setup becomes invalid
Watching for confirmation candle (bearish engulfing / rejection wick)
⚠️ Invalidation
A strong 4H close above the blue resistance breaks the idea.
💬 Note
This is a pure price-action confluence setup. Will update once price reaches mid-channel target or shows breakdown signals.

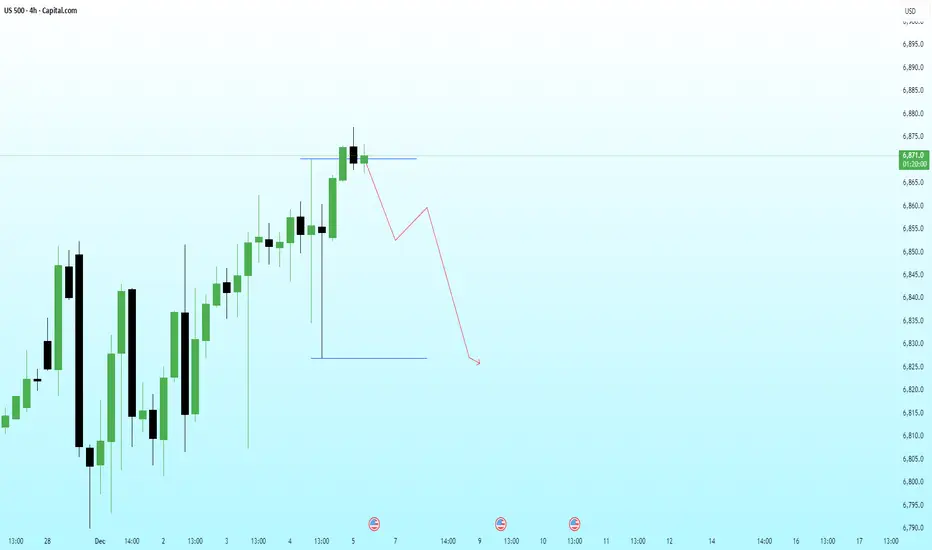
US500 – Liquidity Sweep at the Highs With Bearish Continuation PPrice has swept the immediate buy-side liquidity sitting above the recent high and is already showing signs of exhaustion. The reaction suggests a possible distribution phase forming near the top, aligning with the broader HTF narrative for a corrective leg.
If price fails to reclaim the swept high, the next logical target becomes the sell-side liquidity resting at the lower blue line.
Bearish Path:
• Sweep of the highs
• Failure to sustain above the level
• LTF shift into bearish structure
• Continuation toward downside liquidity + imbalance fill
⚠️ ENTRY CONDITION (IMPORTANT):
I will execute this trade only if the LTF replicates the structural behavior I expect from the HTF.
No LTF confirmation = No trade.
Is BTCUSD (Bitcoin) heading towards $91,000?Hello!
BTC has finally broken through its main downward trendline, signaling a shift in market sentiment after a prolonged period of selling pressure. Following this breakout, the price formed a clear inverse head and shoulders pattern, indicating that buyers have stepped in strongly after the final liquidation at the head level. Since then, BTC has been moving within a clearly defined ascending channel, consistently creating higher highs and higher lows, which confirms the bullish trend.
As long as the price respects the lower boundary of this channel, the bullish structure remains intact. The next significant resistance lies between the 92,500 and 93,000 levels, which also aligns with the previous breakout area you marked. This area is likely to attract sellers, making it a realistic target for the current move.
Overall, the chart continues to support an upward movement towards the 93K level, unless the price breaks below the channel support, which would weaken the bullish reversal setup.

BTCUSD: Overbought Rally Approaches Strong Support ZoneBINANCE:BTCUSD is nearing a crucial support zone, one where buyers have consistently stepped in before and sparked significant reversals. This price history alone makes this level incredibly important to watch closely. Price is approaching this zone once more, and the current market structure suggests potential for a bullish move if we see signs of rejection, such as a strong bullish engulfing candle, long lower wicks indicating absorption of selling pressure, or an uptick in buying volume.
If this support holds, I anticipate price will push towards the 98,700 area, fitting well with a short-term rebound scenario. However, if price breaks through this support and remains below it, the bullish thesis will be invalidated, opening up the possibility for a deeper pullback.
The best approach here is to wait for confirmation from the chart. Pay attention to how candles close, how volume behaves, and only consider long positions if the market defends this support level clearly. Solid risk management is key: position sizing, stop loss placement, and invalidation levels should always be aligned with the volatility that could arise around such a critical area.
This is just my personal view on the current support and resistance structure, not financial advice. Always do your own research and trade with a well-structured risk management plan. Best of luck out there!

HAL – Trendline Rejection & Short SetupPrice has approached a major descending trendline and shown clear rejection near the supply zone. The structure is still respecting lower highs, indicating sellers are active at the top of the range.
I’ve taken a short position based on:
Retest of the descending trendline
Rejection from the previous supply zone
Overall bearish momentum within the channel
Good risk–reward towards the major demand zone around 4360
Invalidation:
Idea becomes invalid if price breaks and sustains above the trendline + supply zone.
Targets:
Major support / demand zone around 4360
Further downside if structure breaks
This is a technical analysis–based idea, not financial advice.
Let’s see how price reacts in the coming sessions.

Technical Analysis of BTCUSD – Is a Correction Approaching?BINANCE:BTCUSD is currently moving within a clearly defined falling wedge pattern, with price now pressing against the lower boundary of the structure. This level may act as dynamic support, and if price shows a strong rejection, a corrective move toward the resistance zone near 102,000 could occur.
If sellers manage to defend that resistance area, the bearish structure remains intact, giving BTCUSD the potential to continue dropping to lower levels. But if price breaks above that zone, there is room for a higher correction toward the upper boundary of the wedge.
At this stage, paying close attention to candlestick patterns and volume behavior around this key area is crucial for identifying the best selling opportunities. Make sure every trade setup is supported by clear confirmation, and always apply solid risk management.
If you have any additional insights or a different perspective on this setup, I’d love to hear it. Feel free to share your thoughts in the comments!

Nifty 50 Analysis If Nifty breaks below the 25,673 zone, a downside move is likely. This could be a good opportunity to buy PE positions and capture potential profits.
• Support 1: 25,673
• Support 2: 25,454
• Resistance: 25,800
In my view, the market may continue to move lower as it recently made an all-time high (ATH) and faces multiple resistance levels.

NASDAQ 100 : This is going to hurt Chart is self explanatory. Refer to marked S/R Zones
- Divergent RSI
- NNH (Net new highs) dropping fast
- Anticipatory shorts are riskier but can give a great entry.
Stop Loss - 25200 DCB

Ethereum sell sign in 15 min as per indicator To identify potential short-selling opportunities in the stock market, technical indicators can signal a stock is overbought, losing momentum, or entering a downtrend. Short-selling is a high-risk strategy, and these indicators are most effective when used together to confirm signals.

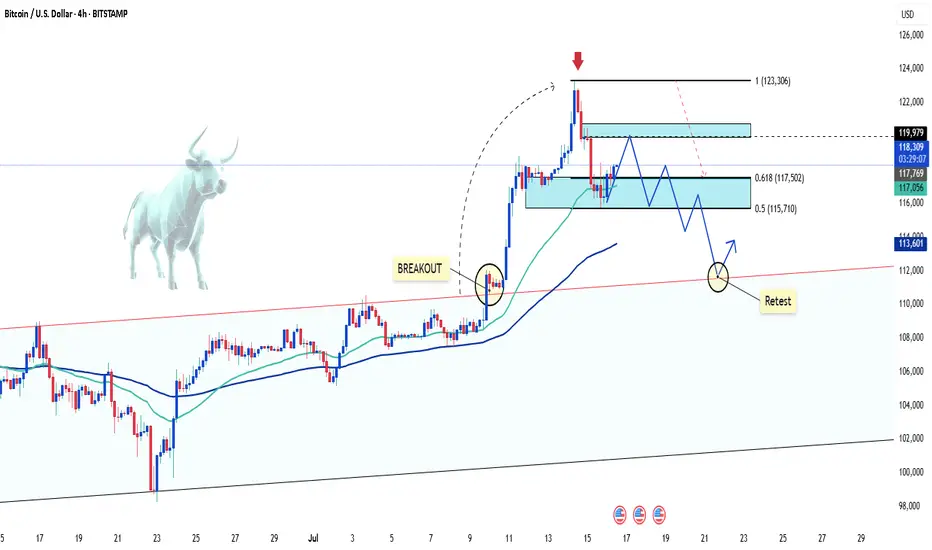
Bitcoin rebounds with strength after whale dumpAfter a surprising sell-off triggered by whale pressure, Bitcoin (BTCUSD) has shown impressive internal strength, bouncing quickly from the Fibonacci support zone between 114,488 and 116,571 USD (0.618 – 0.5 levels).
The D1 chart reveals that the bullish structure remains intact, with EMA 34 and EMA 89 acting as solid support levels. The recent "dump" did not alter the overall trend; on the contrary, it created an opportunity for reaccumulation within the price box—serving as a vital base for the next breakout.
A likely scenario is that BTCUSD will continue to move sideways for a few more sessions before targeting the 1.272 Fibonacci extension near the 128,000 USD area. If this plays out, it would be a strong confirmation of the next growth phase for Bitcoin.
Do you believe Bitcoin is ready to break all-time highs and set a new record? Share your thoughts below!

HeranbaSwing Trade -
Look interesting at current level - still closing pending
If today close above break out level
Maybe we can see Good move upside.
Risk around 8-10% around
Target next resistance

NIFTY50Nifty could 📉 fall to below level 24850 within 18th July 2025 or to the white line marked on the chart.
Even there's a high possibility that 24850 could break and it could even fall 📉 to below red dashed line 24370 within last week of july 2025.
Disclaimer:
It's a personal view not a financial advice and I assume no responsibility and liability whatever outcome arises.

BTC/USD Pullback: What’s Next for Bitcoin?Hello, passionate and wealthy traders! What are your thoughts on BTC/USD?
After a strong surge above the 122,500 USD zone, BTC/USD has started to experience a slight pullback. This is completely normal and necessary for Bitcoin to gain new momentum.
In my personal view, the recent peak of BTC/USD signals that this correction is in play. But where do you think BTC/USD will adjust to? Personally, I believe the 111,500 USD zone is quite reasonable. It’s also the previous breakout level, and this pullback aims to test the uptrend safely.
What about you? Where do you see BTC/USD heading? Looking forward to hearing your thoughts!
BTC/USD Soars: A Surge That Took the Market by SurpriseBitcoin BITSTAMP:BTCUSD has shocked the market with a massive surge, reaching new highs in recent days. This unexpected jump has taken many traders and analysts by surprise, as BTC breaks through previous resistance levels.
The driving forces behind this surge appear to be increased institutional interest, positive market sentiment, and strong demand from retail investors. As Bitcoin enters new territory, it's essential for traders to stay vigilant and manage their risk, as volatility remains high.
Will Bitcoin continue its rally or face a correction? Keep an eye on the charts for the next move!

XAUUSD Short Setup – Bearish Structure Break & RetestI’m watching a clean bearish structure on Gold (XAUUSD) as follows:
✅ Trendline Rejections:
Price has respected a descending trendline with three confirmed lower highs, showing clear bearish pressure.
✅ Key Support Broken:
The 3,325–3,330 zone previously acted as strong support. Price has broken below this area with momentum.
✅ Potential Retest:
I expect a pullback retest of the broken support (now resistance) zone. If we see rejection in this area, I plan to enter short.
✅ Target Area:
The final target for this move is set near the 3,262–3,265 zone, which aligns with previous demand and potential liquidity levels.
🎯 Trade Idea Summary:
Bias: Bearish
Entry Zone: 3,325–3,330 (on retest confirmation)
Stop Loss: Above the descending trendline (~3,340+)
Target: 3,262
Risk-Reward: Approx. 1:2 or higher depending on entry execution
⚠️ Note:
Always confirm entries with price action (e.g., bearish engulfing candles or rejections) before entering. Manage risk properly as Gold can be volatile.
💬 What do you think? Share your thoughts and charts below!
#XAUUSD #Gold #TradingView #ShortSetup

BTCUSDT – Is a Breakout Imminent?Bitcoin is once again testing the descending trendline that previously triggered three strong rejections, hovering around the 106,500–106,600 USDT zone. A clear rounded bottom has formed, with strong support holding around 104,200–104,700, fueling the recent rebound.
Price action is now consolidating just below the key resistance, setting the stage for a potential bullish continuation pattern. A clean breakout above this zone could open the door for a rally toward 108,600 and even 110,200 – both previous highs.
However, if the trendline holds again, the highlighted support zone is likely to attract fresh buying interest. The overall market bias leans bullish, but confirmation via breakout is crucial for the next move.
Are you ready to ride the next BTC wave?

Nifty 22nd Draw Although long term view is bullish
I will be looking for 24667 and 24600
The gap at 24404 may also be filled before
the long term view... Expecting
T1 T2 tomorrow
Induslnd bank will tank due to poor results
which will cause pressure on banks

Crude Oil Futures Under Pressure; Key Resistance Confirmed at ₹5Crude Oil futures on the MCX continued their downward trajectory on Wednesday, closing near ₹4,949 amid growing bearish momentum. WaveNodes Pro Max AI flagged a "Seller Trap Possible", but downside targets remain intact for now.
Seller trap alert means big players are finding opportunity to trap or shed short sellers.
The system-identified Short Entry at ₹5,212 has held firm as resistance, with two clear retests failing to breach the impact zone of ₹5,233–₹5,263. This former support has now flipped decisively into supply, adding pressure on intraday rallies.
🔻 Key Developments:
AI Bearish Probability: Rises to 50.9%, surpassing bullish odds.
Target 1 (₹5,036–₹5,103) achieved successfully.
Target 2 set at ₹4,750–₹4,818, with potential for deeper correction toward ₹4,465–₹4,533.
Profit Booking Alert: ₹5,084 marked as short-term profit-taking zone.
📉 Market Sentiment:
Volatility remains elevated at 23 PPB, with good volatility reading at 21 PPB, suggesting controlled but active movement.
Despite bearish strength, the AI warns of a possible seller trap, especially if prices reclaim levels above ₹5,084.
🧠 Analyst Take: “The rejection at ₹5,212 confirms the breakdown structure. As long as crude trades below this zone, lower targets remain open. However, a surprise reclaim could trigger short covering,” analysts from WaveNodes noted.
📊 Outlook:
Trend: Bearish
Resistance: ₹5,212–₹5,263
Support: ₹4,750 → ₹4,465
Traders are advised to watch volumes closely as crude approaches the next support band. A failure to break lower could validate the seller trap thesis.
